
Vietnam bottled water sells trust as much as hydration
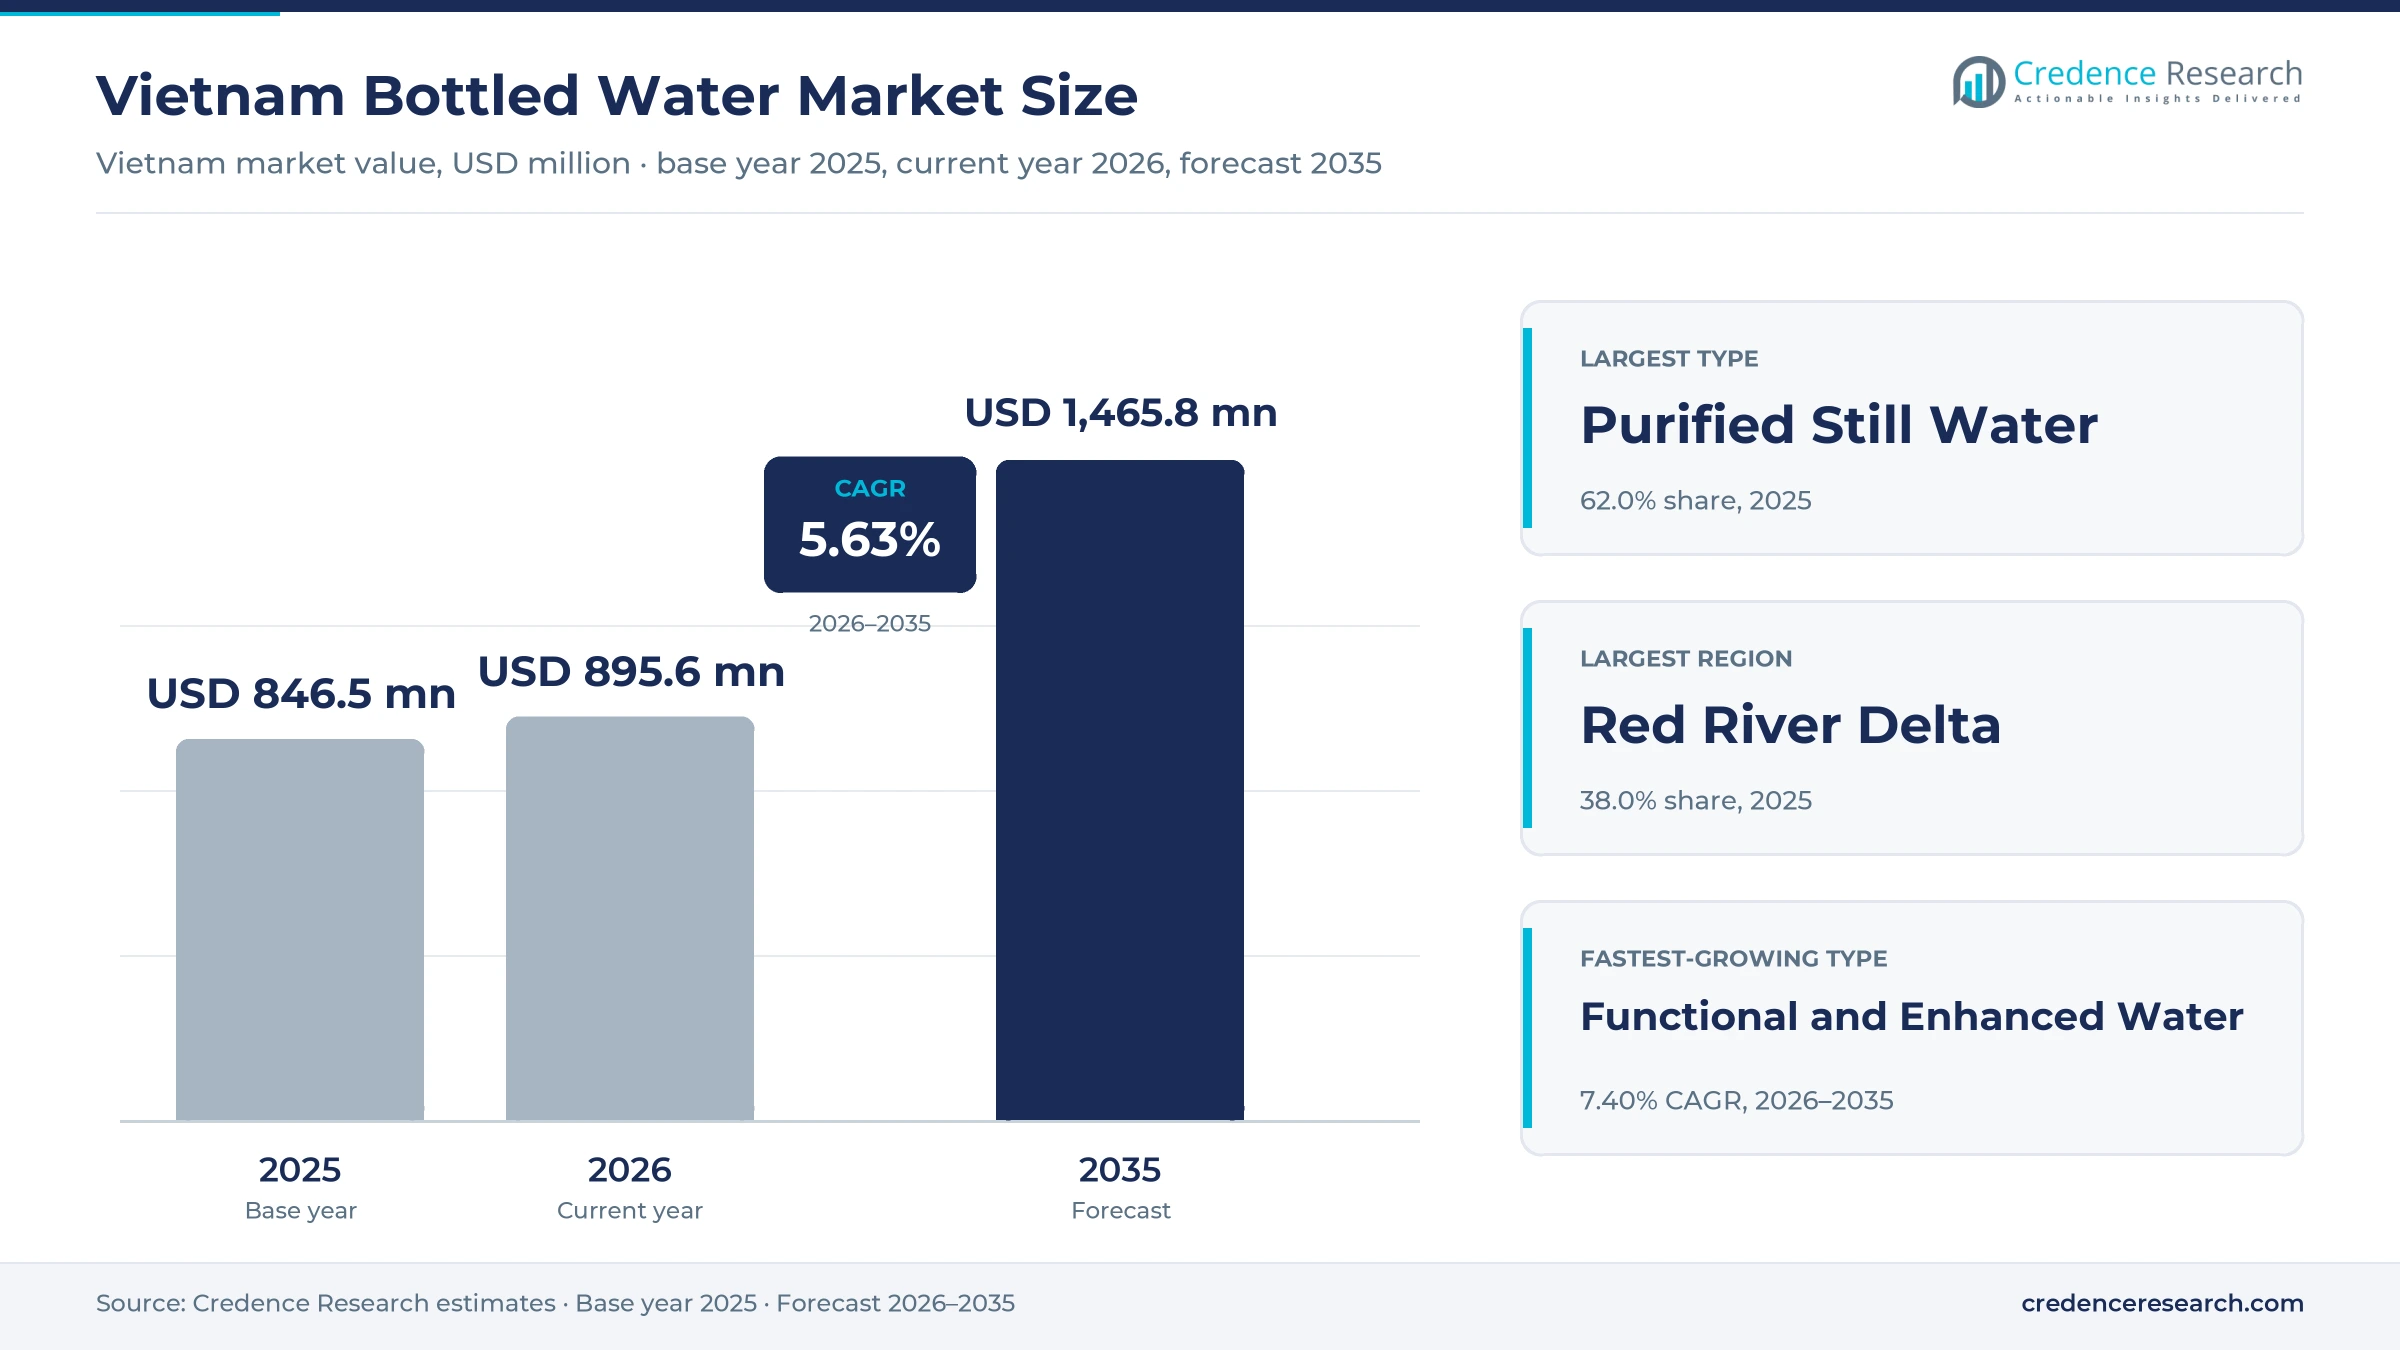
The Vietnam bottled water market was valued at USD 846.5 million in 2025 and is projected to increase from USD 895.6 million in 2026 to USD 1.47 billion by 2035, registering a CAGR of 5.63% during 2026–2035. Demand comes from households that do not fully trust piped supply, commuters buying single bottles at corner stores, and hotels and restaurants serving a record flow of visitors. Red River Delta held the largest regional share, 38.0% in 2025, because Hanoi and its neighbors combine dense population with strong output growth. North and Central Provinces is the fastest-growing region at 5.98% a year as mini-mart chains push into smaller towns and tourism lifts coastal cities. The revised excise law of June 2025 also favors plain water, because it taxes sugary drinks from 2027 while leaving natural mineral water and bottled purified water outside the duty.
What does the bottled water market in Vietnam count, and how do people buy it?
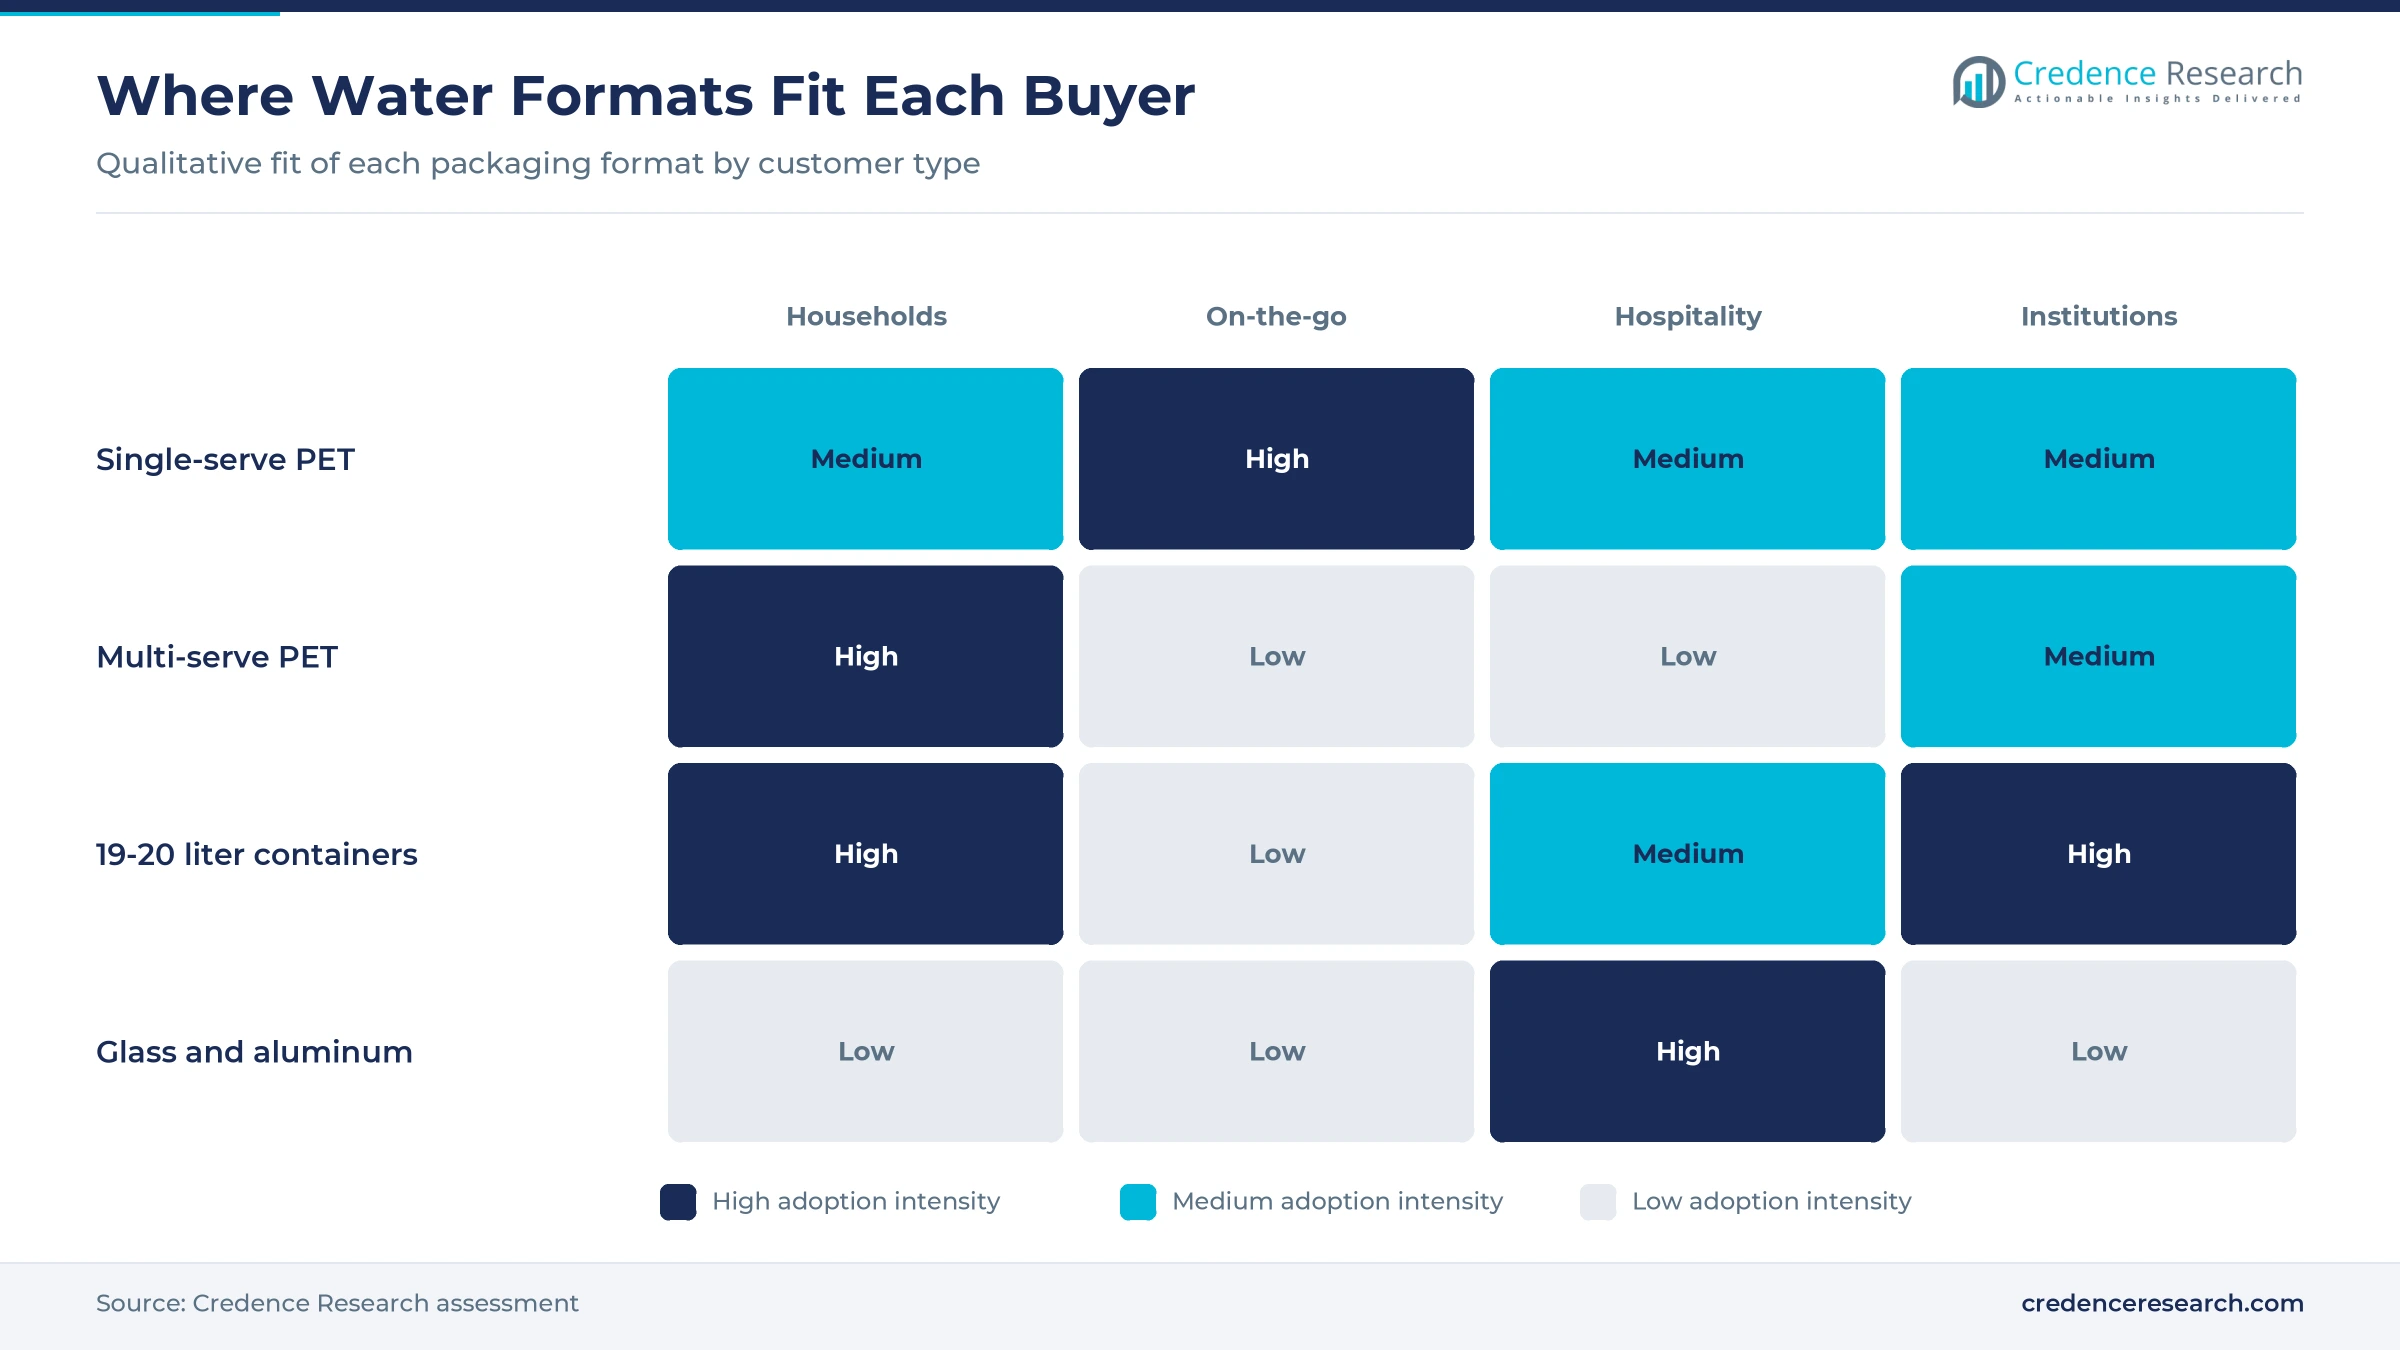
The market counts retail and trade sales of purified still water, natural mineral water, sparkling water and functional and enhanced water sold in sealed packs. Buyers pick up small PET bottles at street-side grocers and mini-marts, order refillable 19-20 liter jugs for homes and offices, and purchase cases for hotels, restaurants and workplaces. Domestic plants supply nearly all of the volume, while imported labels serve a small premium shelf.
The estimate excludes sugar-sweetened and flavored soft drinks, tea and juice drinks, water from home purifiers, and municipal or tanker supply. It also excludes counterfeit product, which cannot be measured reliably. Value is counted at the point of final sale, so bottlers, distributors, jug delivery agents and retailers all sit inside the chain that the final price pays for.
Vietnam Bottled Water Market Insights
- The market grows from USD 846.5 million in 2025 to USD 1.47 billion by 2035, a 5.63% annual pace built on repeat household and on-the-go purchases.
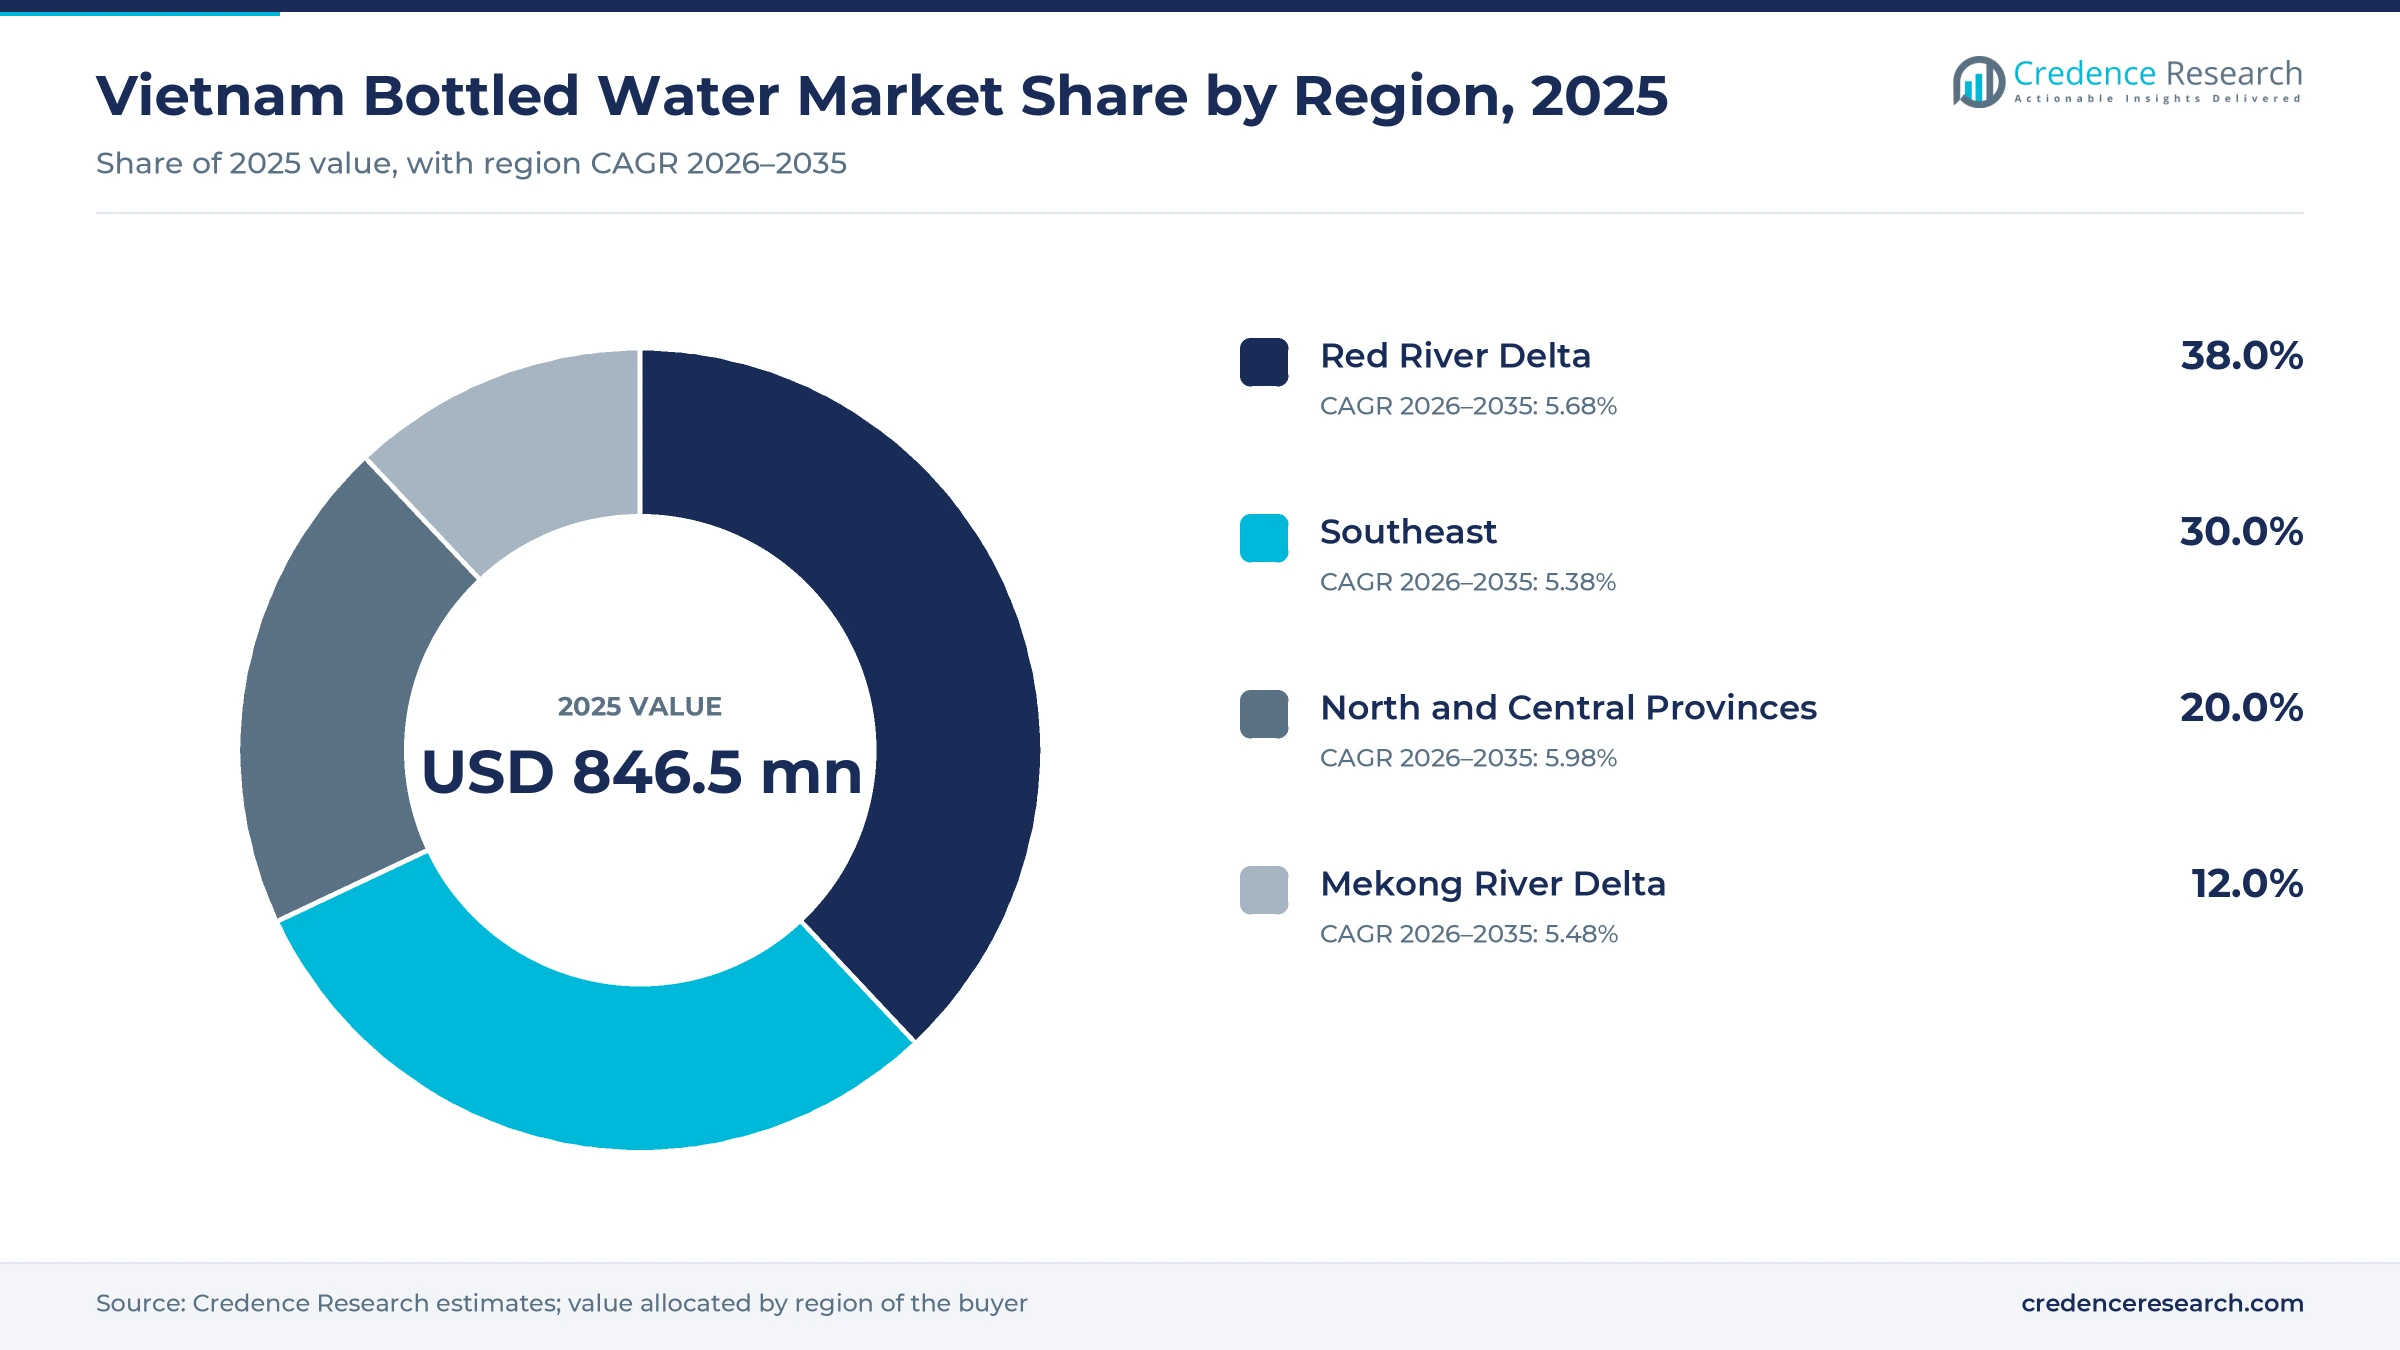
- Red River Delta led with 38.0% of 2025 value, ahead of the Southeast at 30.0%, while North and Central Provinces expands fastest at 5.98% a year.
- Purified Still Water held 62.0% of 2025 bottled water value, because treatment-based brands sell a safety promise at the lowest shelf prices in the category.
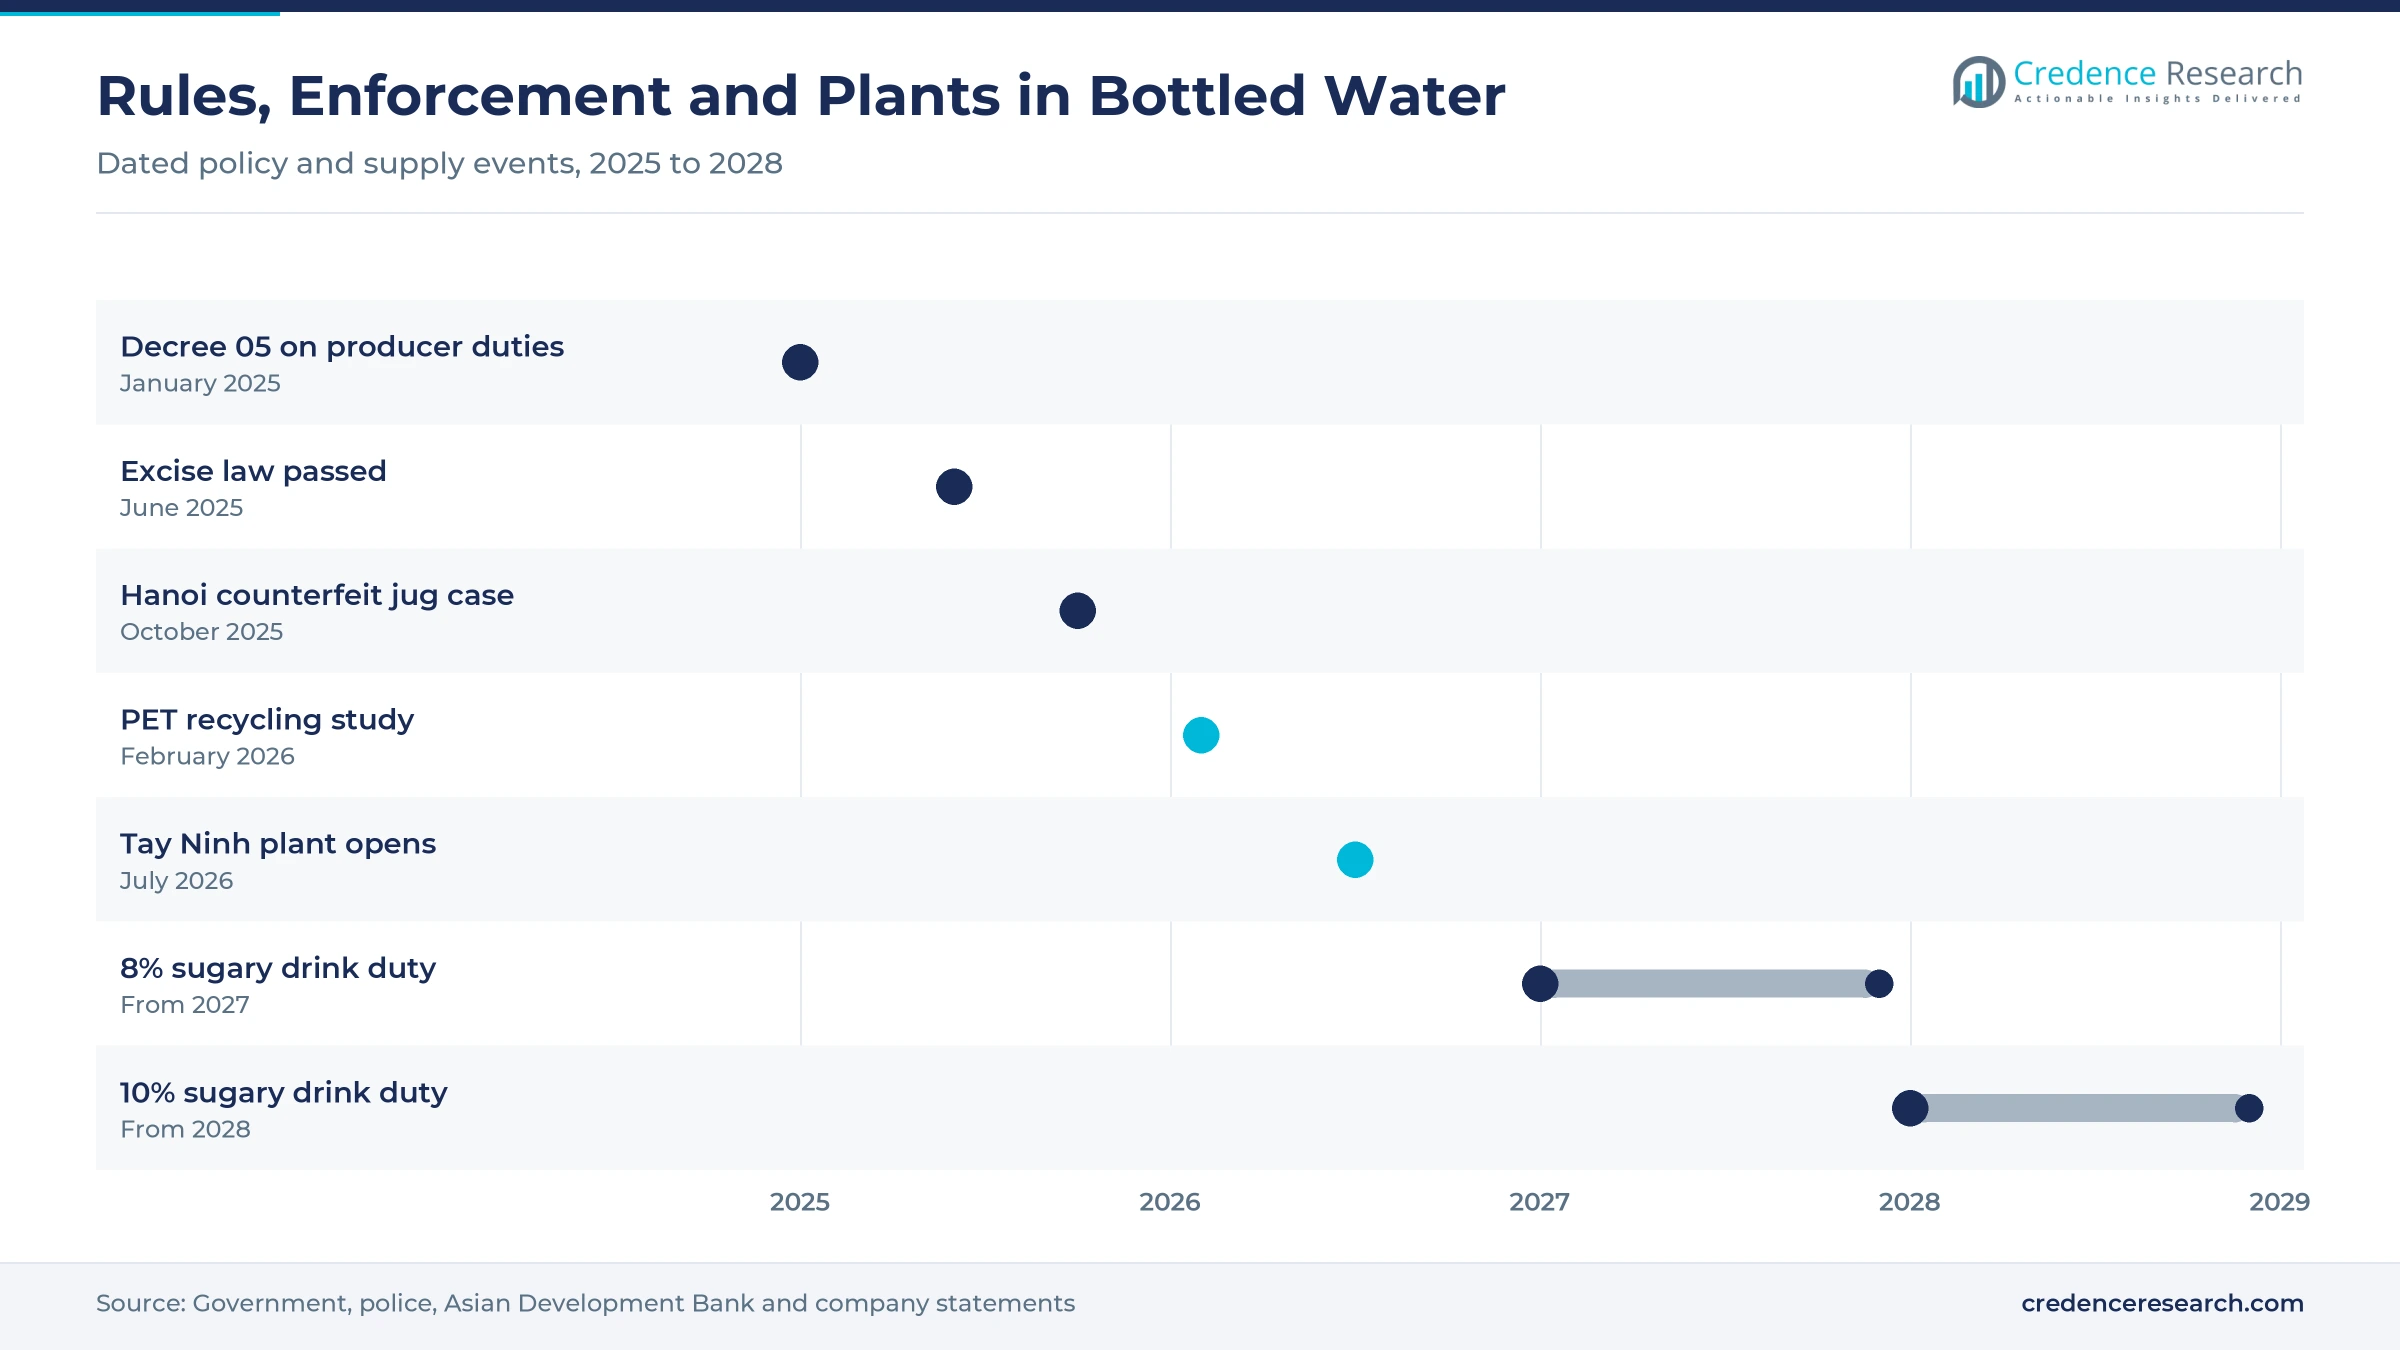
- The excise law passed June 14, 2025, puts an 8% duty on sugary drinks from 2027 and exempts bottled purified water, which improves the relative price of plain water.
- Suntory PepsiCo opened a USD 300 million plant in Tay Ninh on July 10, 2026, showing that global bottlers are adding automated capacity for the local beverage market.
Purified still, corner stores and small PET hold the value
Why does purified still water outsell spring-sourced labels?
Based on product type, the market is categorized into purified still water, natural mineral water, sparkling water and functional and enhanced water. Purified Still Water led with 62.0% of 2025 value because any plant meeting the QCVN 6-1:2010 rule can scale it without a spring, and Pharmacity lists a 500 ml Aquafina bottle at VND7,000. Functional and Enhanced Water grows fastest at 7.40% a year as alkaline labels widen the wellness shelf, with retailer iWater listing i-on Life at about pH 8.5 to 9.5 and LaVie Alkaline at about pH 8.0 to 8.6.
Which buyers set the pace beyond the family kitchen?
Based on customer type, the market is categorized into households, on-the-go consumers, hospitality and foodservice buyers, and institutional and corporate buyers. Households led with 46.0% of 2025 value because jugs replace tap water for drinking, and Bidrico sells 19-liter faucet jugs with a 12-month shelf life for that use. Hospitality and Foodservice Buyers grow fastest at 6.64% a year as lodging capacity widens, with Nhan Dan reporting around 40,000 tourist accommodation establishments and 800,000 rooms in 2025. Mass events add on-the-go volume, as the Da Nang marathon of July 20, 2025, drew nearly 11,000 runners.
How long can street-side grocers hold the lead?
Based on distribution channel, the market is categorized into traditional trade, modern grocery, foodservice and hospitality, and e-commerce and direct delivery. Traditional Trade led with 54.0% of 2025 value because Viet Nam News reported in February 2026 that modern outlets took only 15-20% of rural retail sales and 35-40% of urban sales. E-Commerce and Direct Delivery grows fastest at 6.99% a year as households move routine orders online, with The Investor reporting that online retail on four platforms reached VND429.7 trillion in 2025, up 34.75%, while Sapuwa already reported its own delivery fleet in August 2014.
What keeps small PET ahead of the returnable jug?
Based on packaging format, the market is categorized into single-serve PET bottles, multi-serve PET bottles, returnable 19-20 liter containers, and glass and aluminum formats. Single-Serve PET Bottles led with 44.0% of 2025 value because each bottle carries a higher price per liter, and La Vie’s Long An plant alone can fill 60,500 bottles an hour, according to The Investor in January 2025. Glass and Aluminum Formats grow fastest at 7.18% a year from a small base in hotels and restaurants, where high-end table labels sit alongside imports of unsweetened mineral and aerated waters worth only about USD 4.8 million in 2024 on Trade Map figures.
| Segment Group | Leading Sub-segment | Share, 2025 | Fastest-growing Sub-segment | CAGR, 2026–2035 |
|---|---|---|---|---|
| By Product Type | Purified Still Water | 62.0% | Functional and Enhanced Water | 7.40% |
| By Customer Type | Households | 46.0% | Hospitality and Foodservice Buyers | 6.64% |
| By Distribution Channel | Traditional Trade | 54.0% | E-Commerce and Direct Delivery | 6.99% |
| By Packaging Format | Single-Serve PET Bottles | 44.0% | Glass and Aluminum Formats | 7.18% |
Request a Free Sample
Fill in your details and we'll send you a free sample report.
- Sample data tables & charts
- Research methodology
Tap doubts, 21.2 million visitors and a sugar tax lift sales
Why does the safe-water confidence gap keep households buying?
The clearest demand driver is that piped supply still fails to reassure many households about what they drink. World Bank data put safely managed drinking water at 58.6% of the population in 2024, with 47.0% in rural areas and 75.8% in cities. UNICEF and the agriculture ministry reported in December 2021 that only 51% of rural households had water meeting the national standard. The same release said a 2020 survey found E. coli contamination among 44% of household members whose sources were tested. Those numbers explain why a jug on the dispenser remains a routine purchase rather than a luxury. As a result, purified still water, at 62.0% of 2025 value, benefits most because it sells on treatment.
How do cities and record tourism widen out-of-home drinking?
Urban living and tourism move drinking occasions out of the home, where a sealed bottle is the default choice. World Bank data show urban residents at 38.8% of about 101.6 million people in 2025, so the shift to city life still has far to run. The National Statistics Office counted nearly 21.2 million foreign visitors in 2025, up 20.4%, led by 5.3 million from China and 4.3 million from South Korea. Nhan Dan also reported about 135.5 million domestic visitors that year. Those trips lift wider food and beverage spending, and hotel rooms, tour buses and restaurants all stock sealed water for guests. Consequently, hospitality and foodservice buyers grow at 6.64% a year.
Will the sugar tax push more drinkers toward plain water?
Health policy now reinforces the move from sweet drinks to plain water, and the price gap should widen from 2027. The Ministry of Health said per capita sugary drink consumption rose from 18.5 liters in 2009 to 66.5 liters in 2023, according to Viet Nam News in June 2025. The National Assembly responded on June 14, 2025, with an excise law that sets an 8% duty in 2027 and 10% from 2028 on drinks that pass a threshold of 5 grams of sugar per 100 ml, and it exempts natural mineral water and bottled purified water. Brands are already leaning into the wellness message, with an August 2025 ANA case study describing a La Vie line built around mineral benefits without a mineral taste.
What does the mini-mart rollout add to everyday availability?
New grocery outlets put chilled multipacks and cases within reach of shoppers who used to rely on a single neighborhood stall. Bach Hoa Xanh opened 789 stores in 2025 and planned about 1,000 more for 2026, mainly in the North, according to Viet Nam News. WinMart+ ended 2025 with 4,592 stores after adding 764, and 602 of those openings were rural formats, Vietnam Investment Review reported in January 2026. WinCommerce also put rural modern retail penetration below 15%, which leaves room for further rollout in smaller towns. This expansion matters because a chain listing puts national labels in front of shoppers who previously saw only one stall’s stock. In turn, modern grocery gains ground on traditional trade, whose 54.0% share should narrow through 2035.
Bigger plants and alkaline labels reset the shelf
Shift toward alkaline and mineral-function positioning
Several labels now sell a measurable water property instead of simple purity, which supports higher shelf prices. Khanh Hoa Mineral Water promoted Vikoda at pH 9.0 in August 2022, and FoodIngredientsFirst reported that month production lines able to supply 180 million liters a year. The Fujiwa alkaline brand, from a company Bizhub says was established in early 2018, draws from a groundwater source more than 180 meters below a Cu Chi factory built on a VND100 billion investment. La Vie has moved in the same direction with LaVie Alkaline, which sits beside these brands on retailer shelves. Because these labels start from a small base, functional and enhanced water holds a modest share, yet it grows at 7.40% a year.
Rise of larger automated plants in place of small lines
Capacity is concentrating in large, automated sites and that raises the scale a national brand needs to compete. Suntory PepsiCo opened its sixth Vietnam site in Tay Ninh on July 10, 2026, a USD 300 million investment that FoodBev says includes a fully automated warehouse and LEED Gold certification. TH Group’s purified line in Nghe An was built for up to 600,000 liters a day, or 40,000 bottles an hour, according to Bao Nghe An in December 2018. Swire Coca-Cola took over three plants and 18 production lines when it completed its Vietnam purchase in January 2023. Smaller bottlers therefore face stronger price pressure in the 44.0% single-serve PET format.
Food-grade recycled resin is an opening for bottle brands
Recycled-content bottles offer an opening because food-grade supply now exists inside the country. An Asian Development Bank study published in February 2026 estimated 152,771 to 217,000 tons of PET bottles placed on the market in 2024. It also identified Duy Tan Recycling, with about 60,000 tons a year of food-grade capacity, as the only producer thought to meet European and U.S. standards. The study projected demand of about 66,500 tons of food-grade recycled PET resin for bottles by 2030. La Vie and Coca-Cola already report using recycled content in some bottles, so followers can still differentiate. Bottlers that secure resin early may also ease their producer responsibility obligations.
Direct jug delivery and online reordering are an opening
Heavy jugs suit scheduled delivery, and online reordering gives bottlers a direct link to households that traditional trade does not offer. The Investor reported that online retail reached VND429.7 trillion in 2025 across four platforms, with 3.94 billion products sold, although it published no separate figure for drinks. Sapuwa built an early model around its Ho Chi Minh City depots, reporting more than 20 delivery vehicles and three distribution centers to Vietnam Pictorial in August 2014. Verified delivery also answers the counterfeit concern that surfaced in Hanoi during 2025. E-commerce and direct delivery holds a modest base today, yet it expands at 6.99% a year, the fastest pace among channels.
Fake jugs and packaging duties squeeze honest sellers
How much damage can counterfeit jugs do to brand trust?
Refilled jugs are a direct risk to the safety promise that the whole category depends on. Hanoi police announced on Oct. 14, 2025, that one ring sold about 20,000 counterfeit 19-liter Lavie jugs between March and October 2025, filling discarded shells with tap water. Each jug cost about VND10,000 to make and sold for nearly VND70,000, which shows the margin available to fraud. Genuine suppliers and agents carry the reputational damage, so tamper-evident seals and direct delivery have become practical defenses.
Could better tap supply and home filters cap jug demand?
Improving piped supply and home purifiers give families a lower-cost substitute for jug water over time. The national rural strategy launched on Dec. 22, 2021, targets safe water for all rural residents by 2045. Treatment capacity is also expanding locally, as Doanh Nghiep Hoi Nhap reported that Tan An’s plant in Long An rose from 12,000 to 16,800 cubic meters a day in July 2022 with La Vie sponsorship. Bottlers will likely need portable formats and wellness claims as household purchases mature.
What do packaging duties cost smaller bottlers?
Producer responsibility rules add administrative work and cash costs that small bottlers feel most. Decree 05/2025, issued Jan. 6, 2025, requires the recycling contribution in a single payment by April 20 each year, law firm Tilleke & Gibbins noted. A Vietnam Beverage Association survey in 2023 found more than 80% of businesses reported difficulties implementing the rules, according to Viet Nam News. Larger groups can spread these costs across brands, while regional labels may need shared recycling programs to comply.
How exposed are spring brands to groundwater charges?
Source-based brands depend on extraction licenses and resource charges that can change the cost of a liter. The Investor reported on Jan. 15, 2025, that La Vie was ordered to pay VND61.6 billion in natural resource tax arrears covering 2016 to 2020, at a Long An site licensed for up to 1,560 cubic meters a day. Mineral labels therefore face closer scrutiny on the volumes they declare each year. Careful metering and early compliance are the main mitigation for spring-based producers.
The Red River Delta leads while Central Provinces catch up
| Region | Value, 2025 (USD million) | Share, 2025 | CAGR, 2026–2035 |
|---|---|---|---|
| Red River Delta | 321.7 | 38.0% | 5.68% |
| Southeast | 253.9 | 30.0% | 5.38% |
| North and Central Provinces | 169.3 | 20.0% | 5.98% |
| Mekong River Delta | 101.6 | 12.0% | 5.48% |
Red River Delta keeps the largest share on density and income growth
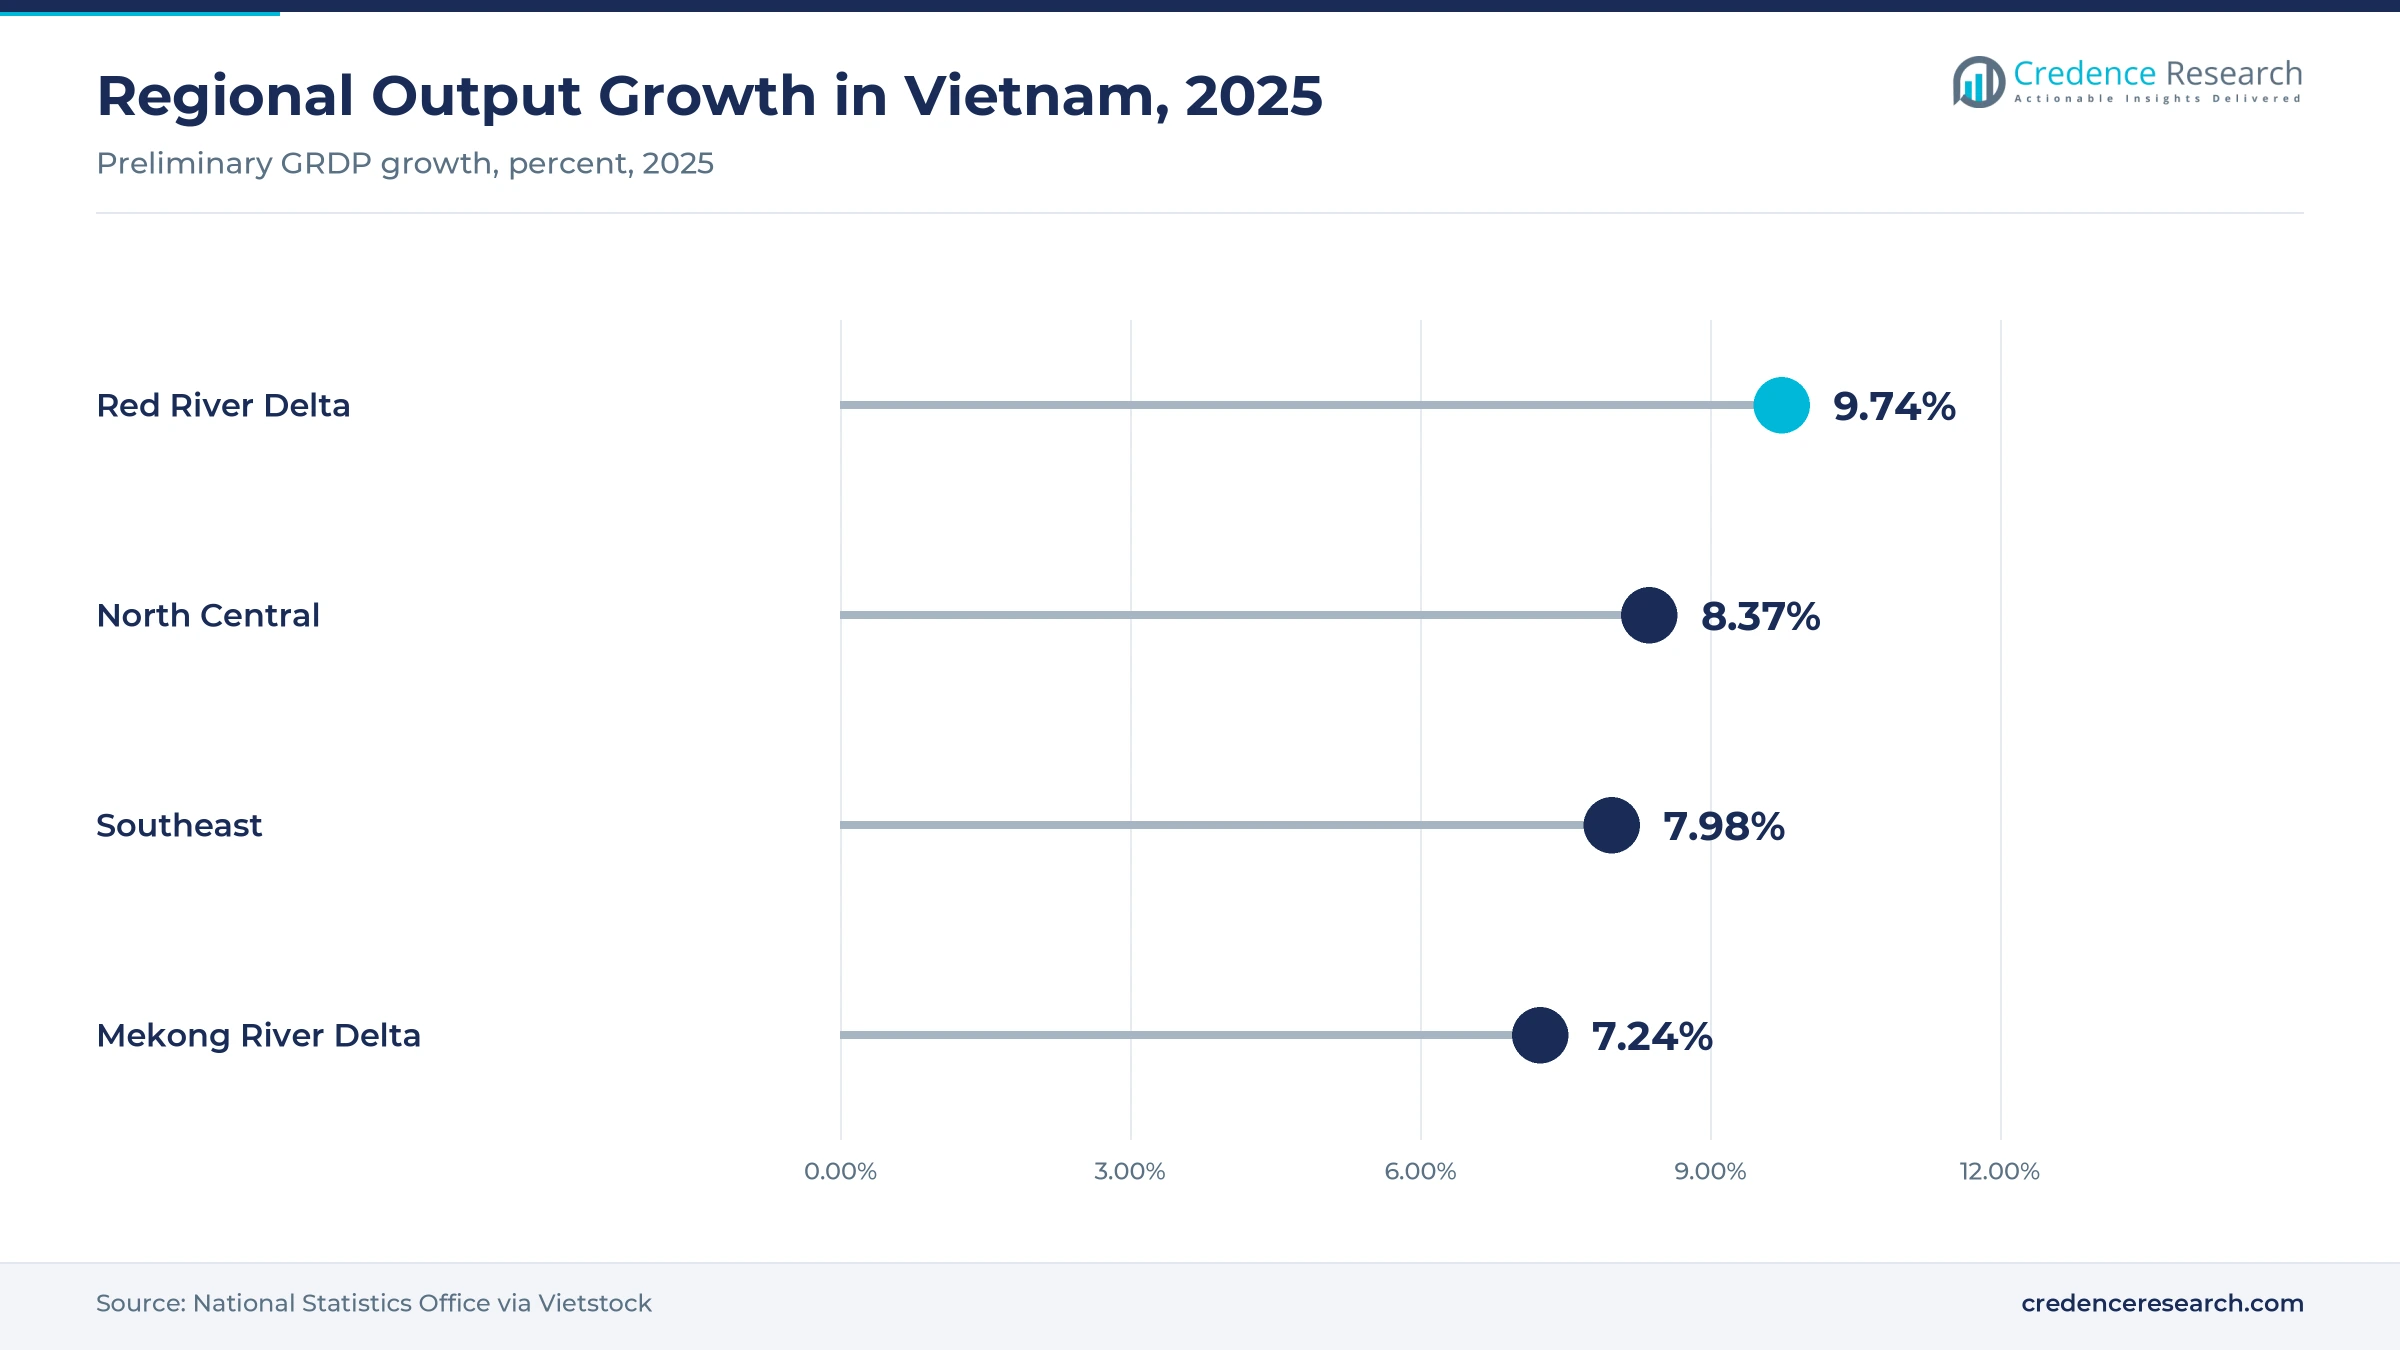
The Red River Delta held 38.0% of 2025 value and grows at 5.68% a year. The General Statistics Office counted about 24 million residents, 23.7% of the country, at 1,126 people per square kilometer in its 2024 mid-term census. Regional output rose 9.74% in 2025, the National Statistics Office estimated, the fastest among the regions tracked here. Grocery chains are also heading north in 2026, although the 2025 fake-jug case and a 39% bottle collection rate in Hanoi, reported by the Asian Development Bank, show the weak points.
Southeast combines the biggest city with new bottling capacity
The Southeast held 30.0% of 2025 value and grows at 5.38% a year, the slowest pace because its market is already well served. The General Statistics Office put density at 814 people per square kilometer, and regional output grew 7.98% in 2025. Ho Chi Minh City also hosts jug suppliers, with Sapuwa’s factory in Go Vap and a Bidrico distribution network centered on the city. The Asian Development Bank reports a 62% bottle collection rate there, which gives bottlers an easier route to recycled resin.
North and Central Provinces gain from new stores and coastal travel
North and Central Provinces held 20.0% of 2025 value and grow fastest at 5.98% a year. WinMart+ opened 409 stores in the North and 341 in Central Vietnam during 2025, which extends packaged-goods reach beyond the large deltas. North Central output rose 8.37% in 2025, while TH Group’s Nghe An line and Vikoda’s Khanh Hoa spring give the area local supply. The Asian Development Bank also notes higher plastic volumes in tourist areas such as Da Nang.
Mekong River Delta buys on seasonal water stress
The Mekong River Delta held 12.0% of 2025 value and grows at 5.48% a year. VietnamPlus reported that about 73,900 households faced water shortages in the 2023-24 dry season, when saline intrusion cut into fresh supply. In Long An’s Tan Lap commune, more than 4,700 households paid VND200,000 to VND300,000 per cubic meter for trucked water in March 2024. However, output growth of 7.24% in 2025 was the slowest of the four regions tracked here, so gains should be steady rather than rapid.
Tax, recycling and plant moves mark 2025 and 2026
| Development | Status and market relevance |
|---|---|
| In January 2025, the government issued Decree 05/2025 revising producer responsibility rules, with a single annual payment date of April 20. | In force; adds compliance work for PET bottlers |
| In June 2025, the National Assembly passed the amended excise law, taxing sugary drinks from 2027 and exempting plain bottled water. | Passed; widens the price gap in favor of water |
| In October 2025, Hanoi police announced charges against four suspects over about 20,000 counterfeit 19-liter jugs sold across the capital. | Prosecuted; raises demand for verified delivery |
| In February 2026, the Asian Development Bank published a PET recycling study covering bottle flows, collection rates and food-grade capacity. | Published; a planning reference for recycled content |
| In July 2026, Suntory PepsiCo opened a USD 300 million site in Tay Ninh, its sixth manufacturing hub in the country. | Operating; adds automated regional capacity |
Filtration steps and recycled resin set the product
- Multi-stage membrane treatment combines ultrafiltration and reverse osmosis in the seven-stage process TH Group describes for its Nghe An line, followed by ultraviolet and ozone steps.
- Fine filtration and ozonation appear on the Bidrico jug line, which lists ion exchange, ultraviolet sterilization and filtering down to 0.2 microns before filling.
- Automatic jug handling reduces contact risk, as Tan Quang Minh showed in 2014 with a line that automates sanitizing, filling, capping and sealing at 2,500 jugs an hour.
- Food-grade recycled resin lets bottlers add recycled content under European and U.S. standards, at about USD 1,400 to 1,500 a ton in 2023, according to the Asian Development Bank.
Need a Custom Version of This Report?
Tailor the scope, geography, or segments to your exact requirements.
- Custom geography or segment scope
- Direct access to our analyst team
Global bottlers face deep-rooted local spring brands
Competition splits between global beverage systems and long-established local spring and jug brands. Suntory PepsiCo sells Aquafina through a dense soft-drink network, and Swire Coca-Cola brings the Coca-Cola system’s bottling plants and distribution centers to the category. La Vie, a Nestle-linked joint venture, anchors natural mineral sales from Long An, while Masan Consumer lists Vinh Hao in 350 ml, 500 ml and 1.5 liter packs alongside a heritage story dating to 1928. Local companies defend specific niches, with Sapuwa and Bidrico strong in southern jugs and Vikoda rooted in Khanh Hoa. TH Group sells TH true WATER from its Nghe An line. Scale buys distribution and low unit costs, but trust remains the deciding factor, so verified sourcing and tamper-proof seals matter as much as price. FoodBev called the Tay Ninh site the group’s largest and most advanced in Asia, which shows how the wider Asia Pacific category shapes plant decisions.
Companies profiled and their roles in this market
| Company | Type | Role in the market |
|---|---|---|
| Suntory PepsiCo Vietnam Beverage | Joint venture | Sells Aquafina; opened a USD 300 million Tay Ninh hub in July 2026 |
| La Vie LLC | Joint venture | Natural mineral producer in Long An since 1992, with a Nestle Waters shareholder |
| Vinh Hao Mineral Water | Local brand | Listed by Masan Consumer; natural mineral water in 350 ml, 500 ml and 1.5 liter packs; source introduced in 1928 |
| Swire Coca-Cola Vietnam | Global bottler | Three plants and 18 lines acquired in the January 2023 deal for the Coca-Cola system |
| TH Group | Local group | TH true WATER; Nghe An line reported in 2018 at up to 600,000 liters a day |
| Saigon Pure Water (SAPUWA) | Local bottler | Founded in 1990; Go Vap factory; more than 20 delivery vehicles reported in August 2014 |
| Khanh Hoa Mineral Water (Vikoda) | Local listed firm | Natural mineral water at pH 9.0; lines reported in August 2022 at 180 million liters a year; UPCOM-listed since 2021 |
| Tan Quang Minh (Bidrico) | Local bottler | Purified 19-liter jugs and 350 ml and 500 ml bottles made to QCVN 6-1:2010 |
| i-on Life | Local brand | Alkaline water retailed at about pH 8.5 to 9.5 |
Proof of purity will decide the next share shift
Credence Research’s view is that the next share shift will favor suppliers that can prove what is inside the pack. The Hanoi jug case showed how easily a trusted label can be copied, and 19-liter jugs remain the most exposed format. National bottlers already hold the capital for automation, so smaller brands should compete through narrow regional supply and auditable delivery. The sugar duty arriving in 2027 offers a one-off pricing opening for plain water, and suppliers that use it to fund seals and recycled resin should keep gains after the initial switch fades.
How the bottled water estimate was built and checked
The report uses 2025 as the base year and forecasts values to 2035. Market values come from the Credence Research model, and segment and regional splits are Credence Research estimates. The size was cross-checked against population, estimated liters per person and observed shelf and jug prices. Evidence comes from World Bank data, national statistics reported in government and press sources, legal notices, a development bank study, police announcements, trade data and company statements. No interviews or surveys were conducted for this edition, and the regional split is the most assumption-heavy estimate.
Health and hospitality carry value through 2035
The market should grow steadily rather than dramatically through 2035, since Vietnam already drinks packaged water widely and the gains come from mix as well as volume. Household jugs should keep their base while piped supply improves slowly toward the 2045 rural target. Faster gains should come from hotels, delivery and alkaline labels, along with the northern and central store rollout. Excise on sugary drinks should support the category from 2027, and recycled content will likely move from a differentiator to an expected feature as producer responsibility rules tighten.
Frequently Asked Questions
How big is the Vietnam bottled water market?
Which region leads bottled water sales in Vietnam?
Which product type is largest?
Why do households keep buying jugs?
Does the sugar tax apply to bottled water?
Which channel grows fastest?
What is the biggest risk for brands?
Who are the leading companies?
Table of Content
Chapter 1 Market Segmentation
- 1.1 Segmentation Framework
- 1.1.1 Product and Service Classification
- 1.1.2 Application and End-Use Classification
- 1.1.3 Technology and Solution Classification
- 1.1.4 Customer and Distribution Channel Classification
- 1.1.5 Geographic Segmentation
- 1.1.6 Market Segment Definitions and Boundaries
- 1.2 By Product Type
- 1.2.1 Purified Still Water
- 1.2.2 Natural Mineral Water
- 1.2.3 Sparkling Water
- 1.2.4 Functional and Enhanced Water
- 1.3 By Customer Type
- 1.3.1 Households
- 1.3.2 On-the-Go Consumers
- 1.3.3 Hospitality and Foodservice Buyers
- 1.3.4 Institutional and Corporate Buyers
- 1.4 By Packaging Format
- 1.4.1 Single-Serve PET Bottles
- 1.4.2 Multi-Serve PET Bottles
- 1.4.3 Returnable 19-20 Liter Containers
- 1.4.4 Glass and Aluminum Formats
Chapter 2 Introduction
- 2.1 Report Objectives and Scope
- 2.2 Product Definition and Industry Terminology
- 2.3 Market Inclusions and Exclusions
- 2.4 Research Process
- 2.4.1 Primary Research and Expert Interviews
- 2.4.2 Secondary Research and Source Review
- 2.4.3 Top-Down and Bottom-Up Estimation
- 2.4.4 Data Triangulation and Verification
- 2.5 Market Size Measurement Basis
- 2.5.1 2025: USD 846.5 million → 2035: USD 1.47 billion
- 2.6 Historical and Forecast Reference Periods
- 2.6.1 Historical Period: 2018-2025
- 2.6.2 Base Year: 2025
- 2.6.3 Forecast Period: 2025-2035
- 2.7 Research Assumptions and Limitations
Chapter 3 Executive Summary
- 3.1 Market Snapshot and Key Findings
- 3.2 Base-Year Market Size, 2025
- 3.3 Forecast Market Size, 2035
- 3.4 Revenue and Volume Growth Outlook
- 3.5 Key Demand and Supply Indicators
- 3.6 Leading Market Segments
- 3.7 Fastest-Growing Market Opportunities
- 3.8 Regional Performance Highlights
- 3.9 Technology and Industry Transformation
- 3.10 Competitive Landscape Summary
- 3.11 Analyst View and Strategic Implications
Chapter 4 Vietnam Bottled Water Market Trends and Developments
- 4.1 Historical Industry Development, 2018-2025
- 4.2 Recent Market Trends and Developments
- 4.3 Demand and Customer Behavior Trends
- 4.4 Technology and Product Innovation
- 4.5 Artificial Intelligence, Automation and Digitalization
- 4.6 Local Manufacturing and Supply Chain Realignment
- 4.7 Industry Partnerships, Mergers and Acquisitions
- 4.8 Sustainability and Circular Economy Developments
- 4.9 Government and Private Sector Investment Trends
- 4.10 Emerging Business Models and Commercialization
- 4.11 Industry Developments and Announcements
Chapter 5 Vietnam Bottled Water Market Production, Supply and Demand Analysis
- 5.1 Demand Trend and Consumption Analysis, 2018-2025
- 5.2 Demand Forecast, 2025-2035
- 5.3 Production and Output Trend, 2018-2025
- 5.4 Production and Output Forecast, 2025-2035
- 5.5 Installed Capacity and Capacity Utilization
- 5.6 Company-Wise Production Plants and Statistics
- 5.6.1 Installed Production Capacity
- 5.6.2 Actual Production
- 5.6.3 Planned Capacity and Expansion Targets
- 5.7 Supply Chain Structure and Procurement Trends
- 5.8 Supply-Demand Gap and Bottlenecks
- 5.9 Import Dependence and Sourcing Structure
- 5.10 Contract Manufacturing and Outsourcing
- 5.11 Regional Supply and Demand Concentration
Chapter 6 Vietnam Bottled Water Market Pricing Analysis
- 6.1 Pricing Structure and Measurement
- 6.2 Historical Pricing Trends, 2018-2025
- 6.3 Pricing Outlook, 2025-2035
- 6.4 Average Selling Price and Unit Economics
- 6.5 Pricing by Product and Market Segment
- 6.6 Geographic Pricing Differences
- 6.7 Key Input, Energy, Labor and Logistics Costs
- 6.8 Contract Pricing and Purchasing Models
- 6.9 Pricing Sensitivity and Competitive Positioning
- 6.10 Price, Margin and Profitability Implications
Chapter 7 Vietnam Bottled Water Market Dynamics
- 7.1 Market Growth Drivers
- 7.1.1 Demand-Side Drivers
- 7.1.2 Technology and Innovation Drivers
- 7.1.3 Infrastructure and Investment Drivers
- 7.1.4 Regulatory and Policy Drivers
- 7.2 Market Restraints
- 7.2.1 Cost and Affordability Constraints
- 7.2.2 Technology and Adoption Barriers
- 7.2.3 Supply Chain and Operational Constraints
- 7.3 Market Challenges
- 7.3.1 Competitive Pressure and Margin Erosion
- 7.3.2 Skills, Infrastructure and Implementation Gaps
- 7.4 Emerging Market Opportunities
- 7.5 Market Dynamics Impact and Time-Horizon Assessment
Chapter 8 Vietnam Bottled Water Value Chain Analysis
- 8.1 Industry Value Chain Overview
- 8.2 Upstream Suppliers and Critical Inputs
- 8.3 Technology and Component Providers
- 8.4 Manufacturing or Service Delivery
- 8.5 Distribution, Channel Partners and Integrators
- 8.6 Downstream Applications and End Users
- 8.7 Value Addition and Profit Pools
- 8.8 Vertical Integration and Outsourcing
- 8.9 Supplier Concentration and Risk
- 8.10 Supply Chain Localization and Resilience
Chapter 9 Vietnam Bottled Water Market Regulations and Policies
- 9.1 Relevant Laws, Standards and Compliance Frameworks
- 9.2 Product, Service, Safety and Quality Requirements
- 9.3 Government Policies, Incentives and Subsidies
- 9.4 Imports, Exports and Trade Barriers
- 9.5 Public Procurement and Local Content Requirements
- 9.6 Environmental and Sustainability Compliance
- 9.7 Upcoming Policy Changes and Market Implications
Chapter 10 Vietnam Bottled Water Market Hotspots and Opportunities
- 10.1 Market Opportunity Mapping and Growth Hotspots
- 10.2 High-Growth Applications and Customer Groups
- 10.3 Underserved Markets and White-Space Opportunities
- 10.4 Emerging Technology and Product Opportunities
- 10.5 New Capacity and Investment Hotspots
- 10.6 Market Entry and Expansion Opportunities
- 10.7 Distribution and Partnership Opportunities
- 10.8 Near-Term and Long-Term Commercial Potential
- 10.9 Opportunity Attractiveness and Execution Risks
Chapter 11 Vietnam Bottled Water Market Outlook, 2025-2035
- 11.1 Market Size and Analysis
- 11.1.1 Revenue (Market Measurement: 2025: USD 846.5 million → 2035: USD 1.47 billion)
- 11.1.2 Market Volume and Quantity Sold
- 11.1.3 Historical Market Size, 2018-2025
- 11.1.4 Base-Year Market Size, 2025
- 11.2 Market Forecast, 2025-2035
- 11.2.1 Revenue Forecast to 2035
- 11.2.2 Volume Forecast to 2035
- 11.2.3 CAGR and Year-on-Year Growth
- 11.2.4 Incremental Revenue Opportunity
- 11.3 Forecast Assumptions and Scenario Analysis
- 11.3.1 Base-Case Forecast
- 11.3.2 Optimistic and Conservative Scenarios
- 11.3.3 Technology, Pricing and Policy Sensitivities
- 11.4 Market Attractiveness and Growth Outlook
Chapter 12 Vietnam Bottled Water Market Segmentation and Outlook
- 12.1 Segmentation Summary and Market Shares, 2025
- 12.2 Largest and Fastest-Growing Segments
- 12.3 By Product Type - Market Size and Forecast, 2025-2035
- 12.3.1 Segment Definition and Scope
- 12.3.2 Historical Market Size, 2018-2025
- 12.3.3 Revenue Forecast, 2025-2035
- 12.3.4 Volume Forecast, 2025-2035
- 12.3.5 Base-Year Market Share, 2025
- 12.3.6 Segment CAGR and Growth Drivers
- 12.3.7 Subsegment Market Size and Forecast
- 12.3.7.1 Purified Still Water
- 12.3.7.2 Natural Mineral Water
- 12.3.7.3 Sparkling Water
- 12.3.7.4 Functional and Enhanced Water
- 12.3.8 Subsegment Pricing and Adoption Trends
- 12.3.9 Leading Suppliers and Competition
- 12.3.10 Regional Demand and Opportunities
- 12.4 By Customer Type - Market Size and Forecast, 2025-2035
- 12.4.1 Segment Definition and Scope
- 12.4.2 Historical Market Size, 2018-2025
- 12.4.3 Revenue Forecast, 2025-2035
- 12.4.4 Volume Forecast, 2025-2035
- 12.4.5 Base-Year Market Share, 2025
- 12.4.6 Segment CAGR and Growth Drivers
- 12.4.7 Subsegment Market Size and Forecast
- 12.4.7.1 Households
- 12.4.7.2 On-the-Go Consumers
- 12.4.7.3 Hospitality and Foodservice Buyers
- 12.4.7.4 Institutional and Corporate Buyers
- 12.4.8 Subsegment Pricing and Adoption Trends
- 12.4.9 Leading Suppliers and Competition
- 12.4.10 Regional Demand and Opportunities
- 12.5 By Packaging Format - Market Size and Forecast, 2025-2035
- 12.5.1 Segment Definition and Scope
- 12.5.2 Historical Market Size, 2018-2025
- 12.5.3 Revenue Forecast, 2025-2035
- 12.5.4 Volume Forecast, 2025-2035
- 12.5.5 Base-Year Market Share, 2025
- 12.5.6 Segment CAGR and Growth Drivers
- 12.5.7 Subsegment Market Size and Forecast
- 12.5.7.1 Single-Serve PET Bottles
- 12.5.7.2 Multi-Serve PET Bottles
- 12.5.7.3 Returnable 19-20 Liter Containers
- 12.5.7.4 Glass and Aluminum Formats
- 12.5.8 Subsegment Pricing and Adoption Trends
- 12.5.9 Leading Suppliers and Competition
- 12.5.10 Regional Demand and Opportunities
- 12.6 Segment Growth Comparison
- 12.7 Segment Attractiveness and Priority Matrix
Chapter 13 Vietnam Bottled Water End-Use and Application Market Outlook
- 13.1 End-Use Industry and Customer Demand Structure
- 13.2 Leading Applications and Customer Groups
- 13.3 End-Use Market Size, Share and Forecast
- 13.4 Major End-Use Industry Deep Dives
- 13.4.1 Customer Requirements and Use Cases
- 13.4.2 Demand and Replacement Cycles
- 13.4.3 Technical and Regulatory Considerations
- 13.4.4 Purchasing and Procurement Models
- 13.4.5 Leading Vendors and Distribution Channels
- 13.4.6 Forecast and Commercial Opportunities
- 13.5 Emerging Applications and Cross-Segment Demand
- 13.6 End-Use Industry Investment Priorities
Chapter 14 Vietnam Bottled Water Geographic Market Outlook, 2025-2035
- 14.1 Domestic Market Distribution and Demand Clusters
- 14.2 State- or Province-Wise Market Size and Forecast, 2025-2035
- 14.3 City and Metropolitan Market Outlook
- 14.4 Industrial, Manufacturing and Commercial Clusters
- 14.5 Geographic Concentration of Key End Users
- 14.6 Local Pricing and Purchasing Differences
- 14.7 Domestic Production Facilities and Capacity Map
- 14.8 Local Infrastructure and Project Pipeline
- 14.9 State-Level Policy and Incentive Differences
- 14.10 Subnational Investment Hotspots and Opportunities
- 14.11 Distribution and Logistics Networks
- 14.12 Domestic Competitive Footprint
Chapter 15 Vietnam Bottled Water Technology, Innovation and Sustainability Outlook
- 15.1 Technology Landscape and Maturity
- 15.2 Product, Process and Service Innovation
- 15.3 AI, Automation and Digital Tools in the Industry
- 15.4 Technology Adoption and Performance Benchmarking
- 15.5 Innovation Pipeline and R&D Investment
- 15.6 Patent and Intellectual Property Trends
- 15.7 Energy Efficiency and Resource Management
- 15.8 Sustainability, Recycling and Circularity
- 15.9 Technology Roadmap, 2025-2035
- 15.10 Risks of Obsolescence and Technology Substitution
Chapter 16 Vietnam Bottled Water Market Key Strategic Imperatives
- 16.1 Growth and Market Entry Priorities
- 16.2 High-Return Products and Segments
- 16.3 Pricing, Profitability and Cost Optimization
- 16.4 Technology Investment and Product Differentiation
- 16.5 Supply Chain Localization and Resilience
- 16.6 Distribution and Customer Acquisition
- 16.7 Partnership, Acquisition and Capacity Strategy
- 16.8 Regional Expansion Priorities
- 16.9 Short-, Medium- and Long-Term Actions
Chapter 17 Competition Outlook
- 17.1 Industry Competition Characteristics
- 17.2 Market Structure and Concentration
- 17.3 Market Share and Competitive Positioning, 2025
- 17.4 Company-Wise Revenue and Product Benchmarking
- 17.5 Production and Service Capacity Benchmarking
- 17.6 Technology, Pricing and Differentiation
- 17.7 Regional Footprint and Distribution Strength
- 17.8 Mergers, Acquisitions and Strategic Alliances
- 17.9 New Entrants and Competitive Threats
- 17.10 Porter's Five Forces and Industry Attractiveness
- 17.11 Competitive Outlook, 2025-2035
Chapter 18 Company Profiles
- 18.1 Company Coverage and Selection Criteria
- 18.2 Suntory PepsiCo Vietnam Beverage Co., Ltd.
- 18.2.1 Business Description
- 18.2.2 Company Ownership and Geographic Presence
- 18.2.3 Product and Service Portfolio
- 18.2.4 Manufacturing and Operating Footprint
- 18.2.5 Production Capacity and Expansion Plans
- 18.2.6 Financial Performance and Investment
- 18.2.7 Market Share and Competitive Position
- 18.2.8 Technology and Innovation Capabilities
- 18.2.9 Strategic Alliances or Partnerships
- 18.2.10 Recent Developments
- 18.2.11 Growth Strategy and Outlook
- 18.3 La Vie LLC
- 18.4 Vinh Hao Mineral Water JSC
- 18.5 Swire Coca-Cola Vietnam
- 18.6 TH Group
- 18.7 Saigon Pure Water LLC (SAPUWA)
- 18.8 Khanh Hoa Mineral Water JSC (Vikoda)
- 18.9 i-on Life Corporation
- 18.10 Tan Quang Minh Manufacturing and Trading Co., Ltd. (Bidrico)
- 18.11 Other Relevant Market Participants
Note: Every listed company is profiled on the structure shown under the first company. The company list is preliminary and may change based on research findings, market developments, data availability and client requirements.
Chapter 19 Disclaimer
- 19.1 Research and Forecast Disclaimer
- 19.2 Data Source and Estimation Limitations
Note: The depth of individual sections depends on data availability for this market. Volume, capacity, trade and other unit-based metrics are included where applicable.

