
Market Overview
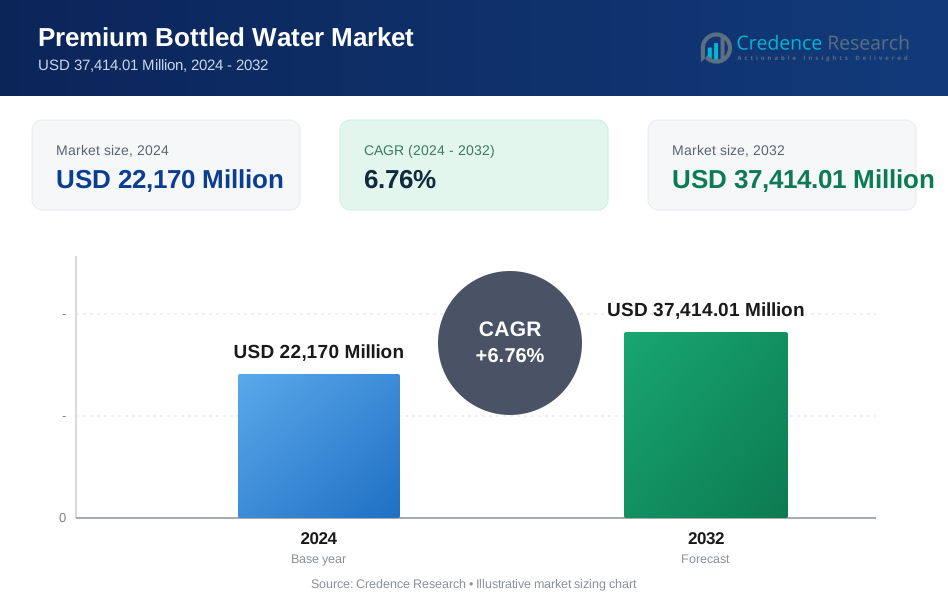
Premium Bottled Water Market size was valued at USD 22,170 Million in 2024 and is anticipated to reach USD 37,414.01 Million by 2032, at a CAGR of 6.76% during the forecast period.
| REPORT ATTRIBUTE | DETAILS |
|---|---|
| Historical Period | 2020-2023 |
| Base Year | 2024 |
| Forecast Period | 2025-2032 |
| Premium Bottled Water Market Size 2024 | USD 22,170 Million |
| Premium Bottled Water Market, CAGR | 6.76% |
| Premium Bottled Water Market Size 2032 | USD 37,414.01 Million |
Premium Bottled Water Market features leading players such as Bling H2O, Roiwater, Beverly Hills Drink Company, NEVAS GmbH, Lofoten Arctic Water AS, VEEN, Uisge Source, Berg Water, BLVD Water, and Alpine Glacier Water Inc., each strengthening their presence through premium sourcing, distinctive branding, and luxury positioning across retail and hospitality channels. North America emerged as the leading region with a 32.4% share in 2024, driven by strong consumer preference for natural, functional, and artisanal hydration products. Europe followed with a 29.7% share, supported by long-standing consumption of mineral and spring water and high adoption of sustainably packaged premium offerings.
Market Insights
- Premium Bottled Water Market reached USD 22,170 Million in 2024 and is set to grow at USD 37,414.01 a 6.76% CAGR through 2032, driven by rising demand for natural, purified, and luxury-positioned hydration products.
- Growing health consciousness fuels strong uptake of spring water, which held a 3% share in 2024, as consumers prefer minimally processed and mineral-rich sources over sugary beverages.
- Key trends include rising demand for functional, flavored, alkaline, and source-verified premium waters, along with increased adoption of eco-friendly and glass-based packaging aligned with sustainability goals.
- Major players expand visibility through artisanal extraction, high-end branding, and strategic partnerships across luxury hospitality, while pricing pressures and regulatory scrutiny on water sourcing and plastic waste act as key restraints.
- North America led with 4%, followed by Europe at 29.7% and Asia-Pacific at 23.8%, while supermarkets & hypermarkets dominated distribution with a 48.6% share, reinforcing strong retail-driven growth.
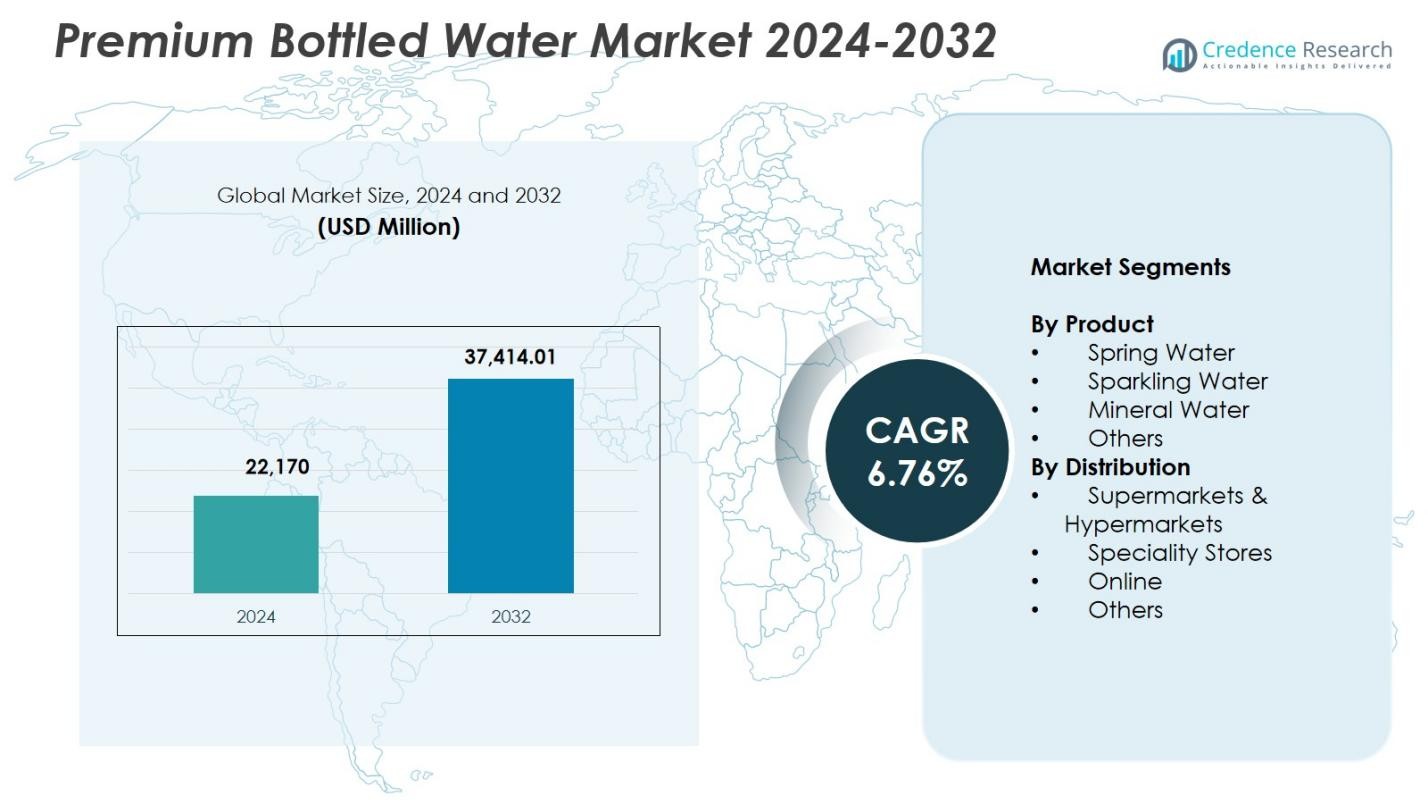 Market Segmentation Analysis:
By Product
Spring water dominated the Premium Bottled Water Market with a 41.3% share in 2024, driven by strong consumer preference for naturally sourced, minimally processed hydration options. Its positioning as a clean-label product with inherent mineral content supports rising adoption across mature and emerging markets. Sparkling water held a significant portion of demand as health-conscious consumers shift from sugary carbonated drinks. Mineral water continued to expand due to its micronutrient profile, while the Others category gained traction through flavored, functional, and artisanal water offerings appealing to niche premium buyers.
- For instance, Evian spring water, filtered for 15 years through French Alps glacial rock, delivers 80 mg/L calcium and 26 mg/L magnesium for crisp hydration.
By Distribution Channel
Supermarkets & hypermarkets led the market with a 48.6% share in 2024, supported by broad product availability, premium shelf placement, and strong consumer trust in organized retail formats. These outlets drive higher volume sales through curated premium water sections and frequent promotional campaigns. Specialty stores accounted for meaningful growth as they cater to affluent buyers seeking luxury hydration brands. Online channels gained a notable share due to subscription models and doorstep delivery convenience, while Others, including HoReCa and airport retail, contributed to rising premium water consumption in on-the-go and luxury hospitality settings.
- For instance, Aava Natural Mineral Water doubled volumes after partnering with Amazon for direct premium alkaline water deliveries.
Key Growth Drivers
Rising Health Consciousness and Preference for Natural Hydration
Growing consumer awareness of health and wellness significantly accelerates demand for premium bottled water. Shoppers increasingly prefer natural, mineral-rich, and additive-free hydration alternatives over sugary beverages, driving strong uptake across urban and high-income populations. The perception of purity, superior quality, and functional benefits further strengthens market momentum. Brands emphasizing source authenticity, mineral composition, and sustainable extraction practices continue to attract health-focused consumers, reinforcing premium water’s position as a lifestyle-driven product category.
- For instance, FIJI Water draws from a protected Fijian rainforest aquifer, transitioning its 500 mL and 330 mL bottles to 100% recycled plastic (rPET) to highlight source purity and environmental responsibility.
Premiumization and Lifestyle-Based Consumption Patterns
Premium bottled water benefits from rising global interest in luxury lifestyle products and aspirational consumption. High-income consumers associate premium water with quality, exclusivity, and sophisticated living, fueling demand for artisanal, glacier-sourced, and heritage-positioned brands. Hospitality, fine-dining, and travel sectors enhance visibility through curated beverage menus featuring high-end water labels. Stylish packaging, brand storytelling, and luxury positioning encourage higher spending, while expanding retail exposure strengthens penetration across both mature and developing markets.
- For instance, Icelandic Glacial sources its naturally alkaline water from the Ölfus Spring in Iceland, featuring glacier-inspired bottle designs that evoke the landscape and emphasize sustainability through carbon-neutral production powered by geothermal and hydroelectric energy.
Expansion of Modern Retail and E-commerce Distribution
Growth of organized retail networks and e-commerce platforms strongly contributes to market expansion by offering broad accessibility and enhanced product visibility. Supermarkets, hypermarkets, and specialty stores provide premium shelf placement and curated assortments that drive consumer trial. Online channels introduce subscription services, bulk delivery, and direct-to-consumer models, enabling brands to reach geographically diverse buyers. Enhanced digital marketing, personalized recommendations, and transparent product information further support rapid adoption among digitally connected premium consumers.
Key Trends & Opportunities
Demand for Functional, Flavored, and Alkaline Premium Waters
A major trend influencing the market is the rising popularity of functional and enriched premium water varieties. Consumers actively seek alkaline, electrolyte-infused, flavored, and antioxidant-rich formulations that provide added health benefits. This creates strong opportunities for manufacturers to innovate with botanicals, natural flavor extracts, and performance-enhancing ingredients. Functional positioning helps brands differentiate in an increasingly crowded premium segment while appealing to fitness-oriented and wellness-driven users seeking value beyond hydration.
- For instance, Essentia produces ionized alkaline water with a pH of 9.5 or higher, purified through reverse osmosis and microfiltration.
Sustainability, Eco-Packaging, and Source Transparency
Growing environmental awareness is reshaping premium bottled water consumption, encouraging brands to introduce recyclable, biodegradable, and lightweight packaging solutions. Companies adopting responsibly sourced water, carbon-neutral operations, and transparent sustainability commitments gain a competitive advantage. Innovations such as plant-based bottles, refillable premium glass packaging, and blockchain-enabled source tracing enhance trust and brand loyalty. This trend presents strong opportunities for premium players to align with conscious consumer values while meeting emerging global regulatory requirements on plastic reduction.
- For instance, Belu Water sources its mineral water from the UK and packages it in lightweight bottles made with at least 40% recycled content that are 100% recyclable, while achieving carbon neutrality certification.
Key Challenges
Environmental Concerns and Increasing Regulatory Pressure
The industry faces significant scrutiny due to rising concerns over plastic waste, carbon emissions, and ecological impact of water extraction. Governments worldwide are implementing stricter regulations on single-use plastics, resource licensing, and sustainability disclosures. These pressures increase operational costs and require major investment in eco-friendly packaging and responsible sourcing practices. Failure to comply can affect brand reputation and restrict market access, forcing companies to adopt long-term environmental strategies.
High Pricing and Limited Accessibility in Emerging Markets
Premium bottled water often carries a significantly higher price point, limiting adoption among middle-income consumers and creating accessibility barriers in price-sensitive regions. Import duties, transportation costs, and premium packaging further elevate retail prices, restricting volume growth outside major urban centers. Local consumers may opt for affordable mainstream water options, while economic fluctuations intensify spending constraints. Brands must balance premium positioning with localized pricing strategies to expand penetration in developing markets.
Regional Analysis
North America
North America held a 32.4% share in 2024, driven by strong consumer preference for premium, natural, and functional hydration products. High-income groups, wellness trends, and rising adoption of sparkling and mineral-rich varieties support steady market expansion. The U.S. dominates regional demand due to extensive retail penetration, luxury lifestyle positioning, and brand-focused marketing. Growth in on-the-go premium consumption and increasing availability through specialty stores, fine-dining establishments, and e-commerce platforms further enhance market traction. Canada contributes additional momentum through rising interest in eco-friendly and source-verified premium bottled water.
Europe
Europe accounted for a 29.7% share in 2024, supported by long-standing consumption of mineral and spring water, particularly in markets such as Germany, France, Italy, and the UK. Strong cultural preference for naturally sourced hydration and stringent quality regulations reinforce premium product acceptance. The region’s extensive presence of artisanal and heritage-positioned brands boosts demand. Increasing consumption in hospitality, luxury travel, and fine-dining sectors further supports growth. Rising environmental consciousness accelerates adoption of sustainable packaging and glass-bottled premium water, enhancing brand differentiation across European markets.
Asia-Pacific
Asia-Pacific captured a 23.8% share in 2024, driven by rapid urbanization, rising disposable incomes, and growing health awareness among young and affluent consumers. Premium water demand is fueled by concerns over tap-water safety and expansion of organized retail. Countries such as China, Japan, India, and South Korea show strong adoption of mineral, alkaline, and functional premium water formats. E-commerce plays a central role in boosting accessibility across metropolitan areas. Increasing penetration in hospitality chains, airports, and premium dining further enhances market visibility, positioning Asia-Pacific as the fastest-growing premium water consumption hub.
Latin America
Latin America secured a 7.6% share in 2024, supported by growing interest in premium hydration products among urban consumers in Brazil, Mexico, Argentina, and Chile. Rising health consciousness and lifestyle upgrades contribute to expanding demand for mineral-rich and naturally sourced premium water. Retail modernization and improved supply chain networks enhance product availability across major cities. However, high pricing relative to income levels presents growth challenges. Premium brands are increasingly targeting affluent segments and hospitality channels, while sustainability-focused packaging initiatives improve brand perception and create new opportunities within the region.
Middle East & Africa
The Middle East & Africa region accounted for a 6.5% share in 2024, influenced by hot climatic conditions, rising tourism, and strong consumption of bottled water across premium hospitality sectors. Countries such as the UAE, Saudi Arabia, and South Africa drive demand through luxury dining, hotels, and airport retail. Premium brands benefit from high expatriate populations and growing preference for imported artisanal and sparkling water. Increasing investments in retail infrastructure and higher disposable incomes support gradual market expansion. Sustainability initiatives and premium glass packaging adoption further attract environmentally conscious consumers looking for high-quality hydration choices.
Market Segmentations:
By Product
- Spring Water
- Sparkling Water
- Mineral Water
- Others
By Distribution
- Supermarkets & Hypermarkets
- Speciality Stores
- Online
- Others
By Geography
- North America
- U.S.
- Canada
- Mexico
- Europe
- Germany
- France
- U.K.
- Italy
- Spain
- Rest of Europe
- Asia Pacific
- China
- Japan
- India
- South Korea
- South-east Asia
- Rest of Asia Pacific
- Latin America
- Brazil
- Argentina
- Rest of Latin America
- Middle East & Africa
- GCC Countries
- South Africa
- Rest of the Middle East and Africa
Competitive Landscape
The competitive landscape of the Premium Bottled Water Market includes major players such as Bling H2O, Roiwater, Beverly Hills Drink Company, NEVAS GmbH, Lofoten Arctic Water AS, VEEN, Uisge Source, Berg Water, BLVD Water, and Alpine Glacier Water Inc. These companies strengthen their market presence by emphasizing source purity, artisanal extraction, premium packaging, and strong brand storytelling. Many brands highlight origin-specific attributes such as glacier meltwater, artesian wells, deep aquifers, and volcanic springs to differentiate themselves in a crowded premium segment. Luxury positioning across hospitality, fine dining, and travel retail further enhances brand visibility. Several players invest in eco-friendly packaging, glass bottling, and carbon-neutral sourcing to meet rising sustainability expectations. Expansion through online platforms, exclusive partnerships with luxury hotels, and curated retail placement supports targeted consumer reach. With increasing demand for functional and lifestyle-driven hydration, companies continue to innovate through flavored variants, mineral-rich formulations, and designer bottle aesthetics to reinforce brand exclusivity.
Key Player Analysis
- Berg Water
- NEVAS GmbH
- BLVD Water
- Alpine Glacier Water Inc.
- VEEN
- Beverly Hills Drink Company
- Uisge Source
- Lofoten Arctic Water AS
- Bling H2O
- Roiwater
Recent Developments
- In November 2025, a new bottled water made entirely from air launched in India, marking a novel entry into the premium water segment.
- In November 2025, AQUAIR launched — becoming India’s first bottled water brand produced entirely from air under a collaboration between AeroNero Solutions Pvt. Ltd. and OI Brewing Co..
- In August 2025, B Water & Beverage unveiled a Disney-licensed line of premium bottled water packaged in sustainable aluminum containers.
Report Coverage
The research report offers an in-depth analysis based on Product, Distribution and Geography. It details leading market players, providing an overview of their business, product offerings, investments, revenue streams, and key applications. Additionally, the report includes insights into the competitive environment, SWOT analysis, current market trends, as well as the primary drivers and constraints. Furthermore, it discusses various factors that have driven market expansion in recent years. The report also explores market dynamics, regulatory scenarios, and technological advancements that are shaping the industry. It assesses the impact of external factors and global economic changes on market growth. Lastly, it provides strategic recommendations for new entrants and established companies to navigate the complexities of the market.
Future Outlook
- Premium bottled water consumption will rise as health-conscious consumers increasingly choose natural and additive-free hydration.
- Demand for artisanal, source-verified, and luxury-positioned water brands will strengthen across hospitality and fine-dining channels.
- Functional premium water, including alkaline, electrolyte-infused, and antioxidant-rich variants, will gain broader adoption.
- Sustainability initiatives will accelerate, with brands expanding glass, biodegradable, and plant-based packaging solutions.
- Online retail and subscription-based delivery models will significantly increase market accessibility.
- Emerging markets will witness rapid uptake driven by urbanization, lifestyle upgrades, and rising disposable incomes.
- Technological integration will grow, enabling digital traceability, QR-based origin verification, and smart packaging.
- Partnerships with luxury hotels, airlines, and travel retail operators will enhance global brand visibility.
- Product diversification through flavored, botanical, and wellness-oriented variants will expand consumer segments.
- Regulatory pressure on water sourcing and packaging waste will shape long-term strategic investments and sustainability practices.
Request a Free Sample
Fill in your details and we'll send you a free sample report.
- Sample data tables & charts
- Research methodology
Need a Custom Version of This Report?
Tailor the scope, geography, or segments to your exact requirements.
- Custom geography or segment scope
- Direct access to our analyst team
Frequently Asked Questions
What is the current market size for the Premium Bottled Water Market, and what is its projected size in 2032?
At what Compound Annual Growth Rate is the Premium Bottled Water Market projected to grow between 2025 and 2032?
Which Premium Bottled Water Market segment held the largest share in 2024?
What are the primary factors fueling the growth of the Premium Bottled Water Market?
Who are the leading companies in the Premium Bottled Water Market?
Which region commanded the largest share of the Premium Bottled Water Market in 2024?
Table of Content
Chapter 1. Report Introduction
- 1.1 Report Description & Purpose
- 1.1.1 Report Title & Market Definition
- 1.1.2 Unique Selling Propositions (USP) & Key Differentiators
- 1.1.3 Value Proposition for Stakeholders
- 1.2 Research Objectives
- 1.2.1 Market Sizing Objectives (Volume & Revenue)
- 1.2.2 Segmentation Objectives
- 1.2.3 Competitive Intelligence Objectives
- 1.2.4 Forecast & Scenario Objectives
- 1.3 Report Scope
- 1.3.1 Premium Bottled Water Scope – Types & Subtypes Covered
- 1.3.2 Geographic Scope – Regions & Countries Covered
- 1.3.3 Historical Period, Base Year & Forecast Period (2024; forecast to 2032)
- 1.3.4 Inclusions & Exclusions
- 1.4 HS Code & Classification Framework
- 1.5 Currency, Units & Pricing Basis
- 1.6 Target Stakeholders
- 1.7 Limitations & Assumptions
Chapter 2. Executive Summary
- 2.1 Global Premium Bottled Water Market Snapshot
- 2.1.1 Market Size – Historical (2024) & Forecast (2024-2032) (2024: USD 22,170 Million → 2032: USD 37,414.01 Million)
- 2.1.2 Volume & Revenue – Global Totals
- 2.1.3 Key Market Highlights – Top Five Facts
- 2.2 Premium Bottled Water Market Segmentation Snapshot
- 2.2.1 Market Split by Region – 2024 vs. 2032
- 2.3 Competitive Snapshot
- 2.3.1 Top 10 Players by Revenue Share – 2024
- 2.3.2 Top 10 Players by Volume Share – 2024
- 2.3.3 Recent Strategic Developments (18-Month Summary)
- 2.4 Key Investment Highlights & Strategic Conclusions
Chapter 3. Premium Bottled Water Market Dynamics & Industry Analysis
- 3.1 Market Overview & Context
- 3.1.1 Premium Bottled Water Market Position in the Broader Automotive Value Chain
- 3.1.2 OEM vs. Replacement Market Dynamics
- 3.1.3 Market Maturity & Development Stage by Region
- 3.2 Premium Bottled Water Market Drivers
- 3.3 Premium Bottled Water Market Restraints & Challenges
- 3.4 Premium Bottled Water Market Opportunities
- 3.5 Porter's Five Forces Analysis
- 3.5.1 Threat of New Entrants
- 3.5.2 Bargaining Power of Suppliers
- 3.5.3 Bargaining Power of Buyers
- 3.5.4 Threat of Substitutes
- 3.5.5 Competitive Rivalry – Intensity Assessment
- 3.6 Premium Bottled Water Value Chain Analysis
- 3.6.1 Upstream – Raw Material/Input Suppliers
- 3.6.1.1 Raw Material/Input 1
- 3.6.1.2 Raw Material/Input 2
- 3.6.1.3 Raw Material/Input 3
- 3.6.2 Midstream – Production/Manufacturing/Service Delivery
- 3.6.2.1 Production/Process Overview
- 3.6.2.2 Key Facility Locations & Capacity by Manufacturer
- 3.6.3 Downstream – Distribution & End Consumer
- 3.6.3.1 Primary Channel – B2B/OEM
- 3.6.3.2 Secondary Channels – Dealer, Retail, Online, Direct
- 3.6.4 Value Chain Profitability Analysis
- 3.6.1 Upstream – Raw Material/Input Suppliers
- 3.7 PESTEL Analysis
- 3.7.1 Political Factors
- 3.7.2 Economic Factors
- 3.7.3 Social Factors
- 3.7.4 Technological Factors
- 3.7.5 Environmental Factors
- 3.7.6 Legal Factors
- 3.8 Premium Bottled Water Supply Chain Analysis
- 3.8.1 Raw Material/Input Supply Risk Assessment
- 3.8.2 Manufacturing Concentration Risk (Geographic Exposure)
- 3.8.3 Trade Disruption Impact Analysis
- 3.9 Regulatory & Policy Landscape
Note: The regulatory and policy landscape section covers regulations based on their applicability to the market, Premium Bottled Water category, geography, and scope of the study. Only regulatory frameworks with a material impact on operations, compliance, trade, sustainability, or market access are analyzed in detail.
Chapter 4. Key Investment Pockets & Opportunity Analysis
- 4.1 Premium Bottled Water Market Attractiveness Analysis
- 4.1.1 By Region – Investment Attractiveness Matrix (Volume × CAGR)
- 4.2 Absolute Revenue Growth Opportunity
- 4.2.1 By Region – Absolute USD Growth Through 2032
- 4.3 Incremental Volume Opportunity
- 4.3.1 By Region – Incremental Volume Through 2032
- 4.3.2 Segment – Incremental Volume
- 4.4 Emerging Submarket Opportunity Deep Dive (Subject to Applicability)
- 4.5 Emerging Market Opportunity Scorecards
- 4.5.1 United States
- 4.5.2 Europe
- 4.5.3 Asia
- 4.5.4 Middle East & Africa
Note: Emerging Market Opportunity Scorecards will be included based on relevance and strategic importance. Regions listed are indicative and may vary depending on data availability and market dynamics.
Chapter 5. Premium Bottled Water Import-Export Analysis & Trade Flows
- 5.1 Global Trade Overview
- 5.1.1 Global Export Value by Country (2024)
- 5.1.2 Global Export Volume by Country (2024)
- 5.1.3 Global Import Value by Country (2024)
- 5.1.4 Global Import Volume by Country (2024)
- 5.1.5 Net Trade Balance by Country (2024)
- 5.2 Export Analysis – Segment
- 5.2.1 Type 1 (HS Code)
- 5.2.2 Type 2 (HS Code)
- 5.2.3 Type 3 (HS Code)
- 5.2.4 Type 4 (HS Code)
- 5.2.5 Type 5 (HS Code)
- 5.3 Import Analysis – Segment
- 5.3.1 Type 1 (HS Code)
- 5.3.2 Type 2 (HS Code)
- 5.3.3 Type 3 (HS Code)
- 5.3.4 Type 4 (HS Code)
- 5.3.5 Type 5 (HS Code)
- 5.4 Average Unit Trade Prices
- 5.4.1 Average Export Price – Segment & Country
- 5.4.2 Average Import Price – Segment & Source Country
- 5.4.3 Price Trends (2024)
- 5.5 Key Trade Route Analysis
- 5.5.1 Trade Route 1
- 5.5.2 Trade Route 2
- 5.5.3 Trade Route 3
- 5.5.4 Trade Route 4
- 5.5.5 Trade Route 5
- 5.6 Trade Policy Impact Assessment
- 5.6.1 US Anti-Dumping & Section 301 Tariffs
- 5.6.2 EU Customs Union Impact
- 5.6.3 Major Free Trade Agreements
- 5.6.4 USMCA Rules of Origin
Note: Trade policy analysis will be included only where relevant to the Premium Bottled Water market.
Chapter 6. Competitive Landscape & Company Benchmarking
- 6.1 Premium Bottled Water Market Concentration & Structure
- 6.1.1 Herfindahl-Hirschman Index (HHI) – vs. 2024
- 6.1.2 Tier 1, Tier 2 & Tier 3 Market Structure
- 6.1.3 Global, Regional & Local Player Dynamics
- 6.2 Premium Bottled Water Market Share Analysis – 2024
- 6.2.1 Global Revenue Share by Company
- 6.2.2 Global Volume Share by Company
- 6.2.3 Regional Revenue Share
- 6.2.4 Market Share Evolution ( vs. 2024)
- 6.2.5 OEM Segment Share by Company
- 6.2.6 Replacement Segment Share by Company
- 6.3 Production/Delivery Capacity & Facility Analysis
- 6.3.1 Global Installed Capacity
- 6.3.2 Capacity Utilization Rates
- 6.3.3 Production/Output Volume
- 6.3.4 Facility Locations & Capacity Map
- 6.3.5 Planned Capacity Additions
- 6.4 Premium Bottled Water Competitive Benchmarking Matrix
- 6.4.1 Revenue, Volume, CAGR & Profitability Comparison
- 6.4.2 Channel Revenue Mix
- 6.4.3 Geographic Revenue Exposure
- 6.4.4 R&D Intensity
- 6.4.5 Sustainability Maturity
- 6.5 Strategic Developments in Premium Bottled Water (Last 24 Months)
- 6.5.1 Mergers, Acquisitions & Divestments
- 6.5.2 New Premium Bottled Water Launches
- 6.5.3 Facility Expansions
- 6.5.4 Strategic Alliances, Joint Ventures & Partnerships
- 6.5.5 Distribution Expansion & Market Entry
- 6.5.6 Sustainability & ESG Initiatives
- 6.6 Competitive Strategy Mapping
- 6.6.1 Leader, Challenger, Follower & Niche Classification
- 6.6.2 Pricing Strategy Comparison
- 6.6.3 Channel Strategy Matrix
Note: Strategic developments are included based on their materiality and the availability of reliable information.
Chapter 7. Global Premium Bottled Water Market – By Distribution Channel
- 7.1 Segment Overview
- 7.1.1 Volume & Revenue Split by Channel (2024 & 2032)
- 7.1.2 Channel Mix Evolution (2024-2032)
Chapter 8. Regional Market Analysis – Global Overview
- 8.1 Global Regional Overview
- 8.1.1 Regional Volume Share
- 8.1.2 Regional Revenue Share
- 8.1.3 Regional Volume by Region
- 8.1.4 Regional Revenue by Region
- 8.1.5 Regional Forecast Through 2032
- 8.2 Cross-Regional Segment Analysis
- 8.2.1 By Distribution Channel
- 8.2.2 By Brand/Price Tier
Chapter 9. North America Premium Bottled Water Market
- 9.1 United States
- 9.2 Canada
- 9.3 Mexico
Chapter 10. Europe Premium Bottled Water Market
- 10.1 Germany
- 10.2 France
- 10.3 Italy
- 10.4 United Kingdom
- 10.5 Spain
- 10.6 Poland
- 10.7 Russia
- 10.8 Netherlands
- 10.9 Belgium
- 10.10 Sweden
- 10.11 Denmark
- 10.12 Norway
- 10.13 Rest of Europe
Chapter 11. Asia Pacific Premium Bottled Water Market
- 11.1 China
- 11.2 India
- 11.3 Japan
- 11.4 South Korea
- 11.5 Thailand
- 11.6 Indonesia
- 11.7 Vietnam
- 11.8 Malaysia
- 11.9 Australia
- 11.10 Rest of Asia Pacific
Chapter 12. Latin America Premium Bottled Water Market
- 12.1 Brazil
- 12.2 Argentina
- 12.3 Colombia
- 12.4 Chile
- 12.5 Rest of Latin America
Chapter 13. Middle East Premium Bottled Water Market
- 13.1 Saudi Arabia
- 13.2 United Arab Emirates
- 13.3 Turkey
- 13.4 Israel
- 13.5 Iran
- 13.6 Rest of the Middle East
Chapter 14. Africa Premium Bottled Water Market
- 14.1 South Africa
- 14.2 Egypt
- 14.3 Nigeria
- 14.4 Morocco
- 14.5 Rest of Africa
Chapter 15. Premium Bottled Water Company Profiles
- 15.1 [Company 01]
- 15.1.1 Company Overview
- 15.1.2 Key Management Personnel
- 15.1.3 Products & Services Portfolio
- 15.1.4 Financial Performance
- 15.1.5 Key Market Focus & Geographic Presence
- 15.1.6 Recent Developments & Strategic Initiatives
Note: The company profile list is preliminary and may change based on research findings, market developments, data availability, and client requirements.
Chapter 16. Appendices
- Appendix A – List of Abbreviations & Acronyms
- Appendix B – Industry Classification Code Reference – Full Series
- Appendix C – Production & Capacity Data Tables
- Appendix D – End-Use & Demand Base Tables
- Appendix E – Consumption & Replacement Rate Assumptions
- Appendix F – ASP Reference Tables
- Appendix G – Manufacturing & Facility Database
- Appendix H – Import-Export Data Tables
- Appendix I – Regulatory Summary Tables
- Appendix J – Primary Research Participant List (Anonymized)
- Appendix K – Primary Research Questionnaire Framework
- Appendix L – Data Sources & Bibliography
- Appendix M – Market Size Divergence & Source Comparison
Chapter 17. Research Methodology
- 17.1 Research Framework & Philosophy
- 17.2 Secondary Research – Sources, Hierarchy & Data Extraction
- 17.3 Data Modeling – Bottom-Up & Top-Down Market Sizing
- 17.4 Primary Research – Stakeholder Framework, LOI & Sample Sizes
- 17.5 Forecast Methodology – Regression, Scenario & Sensitivity Analysis
- 17.6 Quality Control – Four-Layer Validation Framework
- 17.7 Limitations & Standard Assumptions
- 17.8 Disclaimer
