
Market Overview:
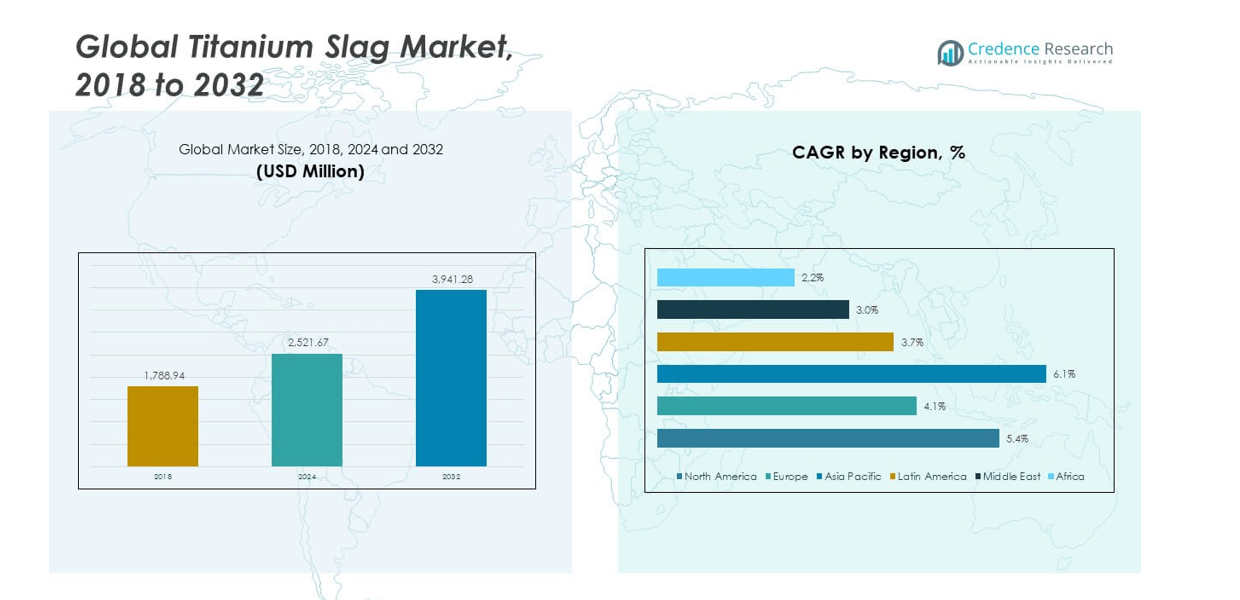
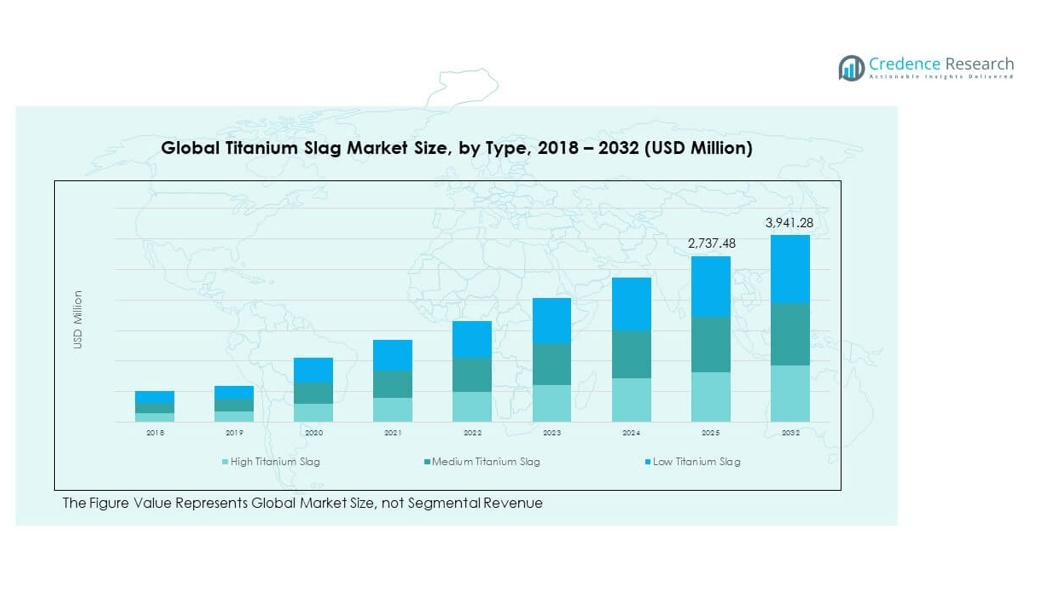
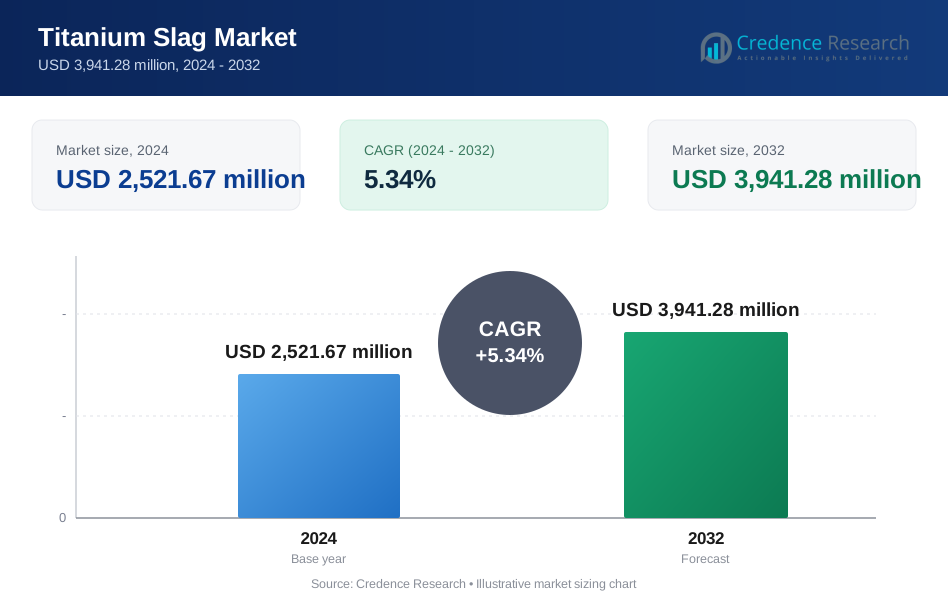
The Global Titanium Slag Market size was valued at USD 1,788.94 million in 2018 to USD 2,521.67 million in 2024 and is anticipated to reach USD 3,941.28 million by 2032, at a CAGR of 5.34% during the forecast period.
| REPORT ATTRIBUTE | DETAILS |
|---|---|
| Historical Period | 2020-2023 |
| Base Year | 2024 |
| Forecast Period | 2025-2032 |
| Titanium Slag Market Size 2024 | USD 2,521.67 million |
| Titanium Slag Market, CAGR | 5.34% |
| Titanium Slag Market Size 2032 | USD 3,941.28 million |
The Global Titanium Slag Market grows due to rising titanium dioxide pigment demand. Paints, coatings, plastics, and paper drive steady consumption. Infrastructure growth lifts construction coatings demand worldwide. Automotive production supports lightweight and corrosion-resistant material use. Aerospace programs increase titanium alloy requirements. Producers prefer slag for high TiO₂ content and stable quality. Cost control favors slag over natural rutile sources. Steelmaking slag recovery also supports supply security. Environmental rules encourage efficient ore processing routes.
Asia Pacific leads the Global Titanium Slag Market due to strong pigment production. China dominates through integrated titanium value chains and scale. Japan and South Korea support demand from electronics and automotive industries. Europe remains strong with aerospace and specialty pigment consumption. North America holds steady demand from construction and defense sectors. Emerging growth appears in India and Southeast Asia. Industrial expansion and infrastructure spending drive these regions. Local capacity additions improve regional supply balance.
Market Insights:
- The Global Titanium Slag Market was valued at USD 1,788.94 million in 2018, reached USD 2,521.67 million in 2024, and is projected to hit USD 3,941.28 million by 2032, growing at a CAGR of 5.34% due to steady pigment and alloy demand.
- Asia Pacific led with about 44.3% share in 2024, followed by North America at 29.3% and Europe at 17.6%, driven by large pigment capacity, strong industrial bases, and advanced manufacturing ecosystems.
- Asia Pacific also remains the fastest-growing region with a 44.3% share, supported by expanding pigment plants, integrated supply chains, and rising infrastructure coatings demand.
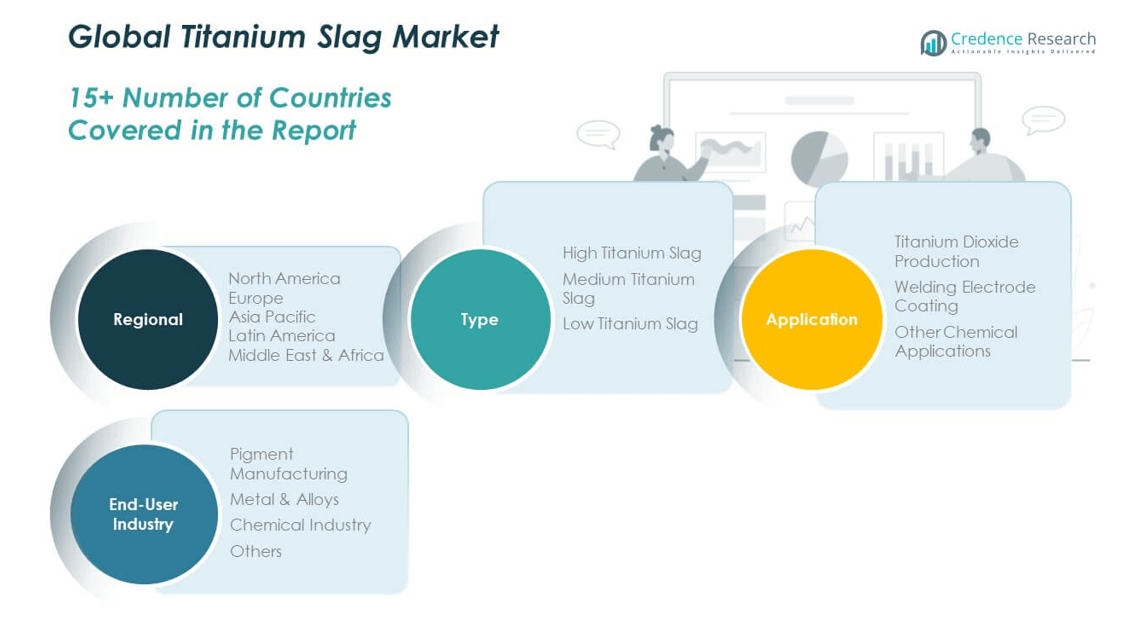
- By type, high titanium slag accounted for nearly 45% share, driven by premium TiO₂ yield and alloy applications, while medium titanium slag held around 35% due to balanced cost-performance use.
- Low titanium slag represented about 20% share, supported by price-sensitive chemical applications and steady baseline industrial consumption.
Market Drivers:
Rising Titanium Dioxide Pigment Demand Across Core Industries
The Global Titanium Slag Market benefits from strong pigment demand across coatings and plastics. Paint manufacturers rely on titanium dioxide for opacity and durability. Construction growth supports steady architectural coating consumption. Automotive refinishing increases pigment use in OEM and aftermarket coatings. Packaging applications require brightness and color stability. Paper producers value titanium dioxide for print quality. Slag-based feedstock ensures consistent TiO₂ yield. This demand sustains long-term raw material offtake.
- For instance, Tronox operates integrated feedstock and pigment assets, including its Hamilton, Mississippi facility with a capacity of approximately 240,000 tons per year, ensuring stable chloride-route pigment supply for coatings producers.
Expanding Steelmaking And Slag Valorization Practices
Steel producers adopt slag recovery to improve material efficiency. Titanium-rich slag gains value as a co-product of smelting. Integrated steel plants reduce waste through slag upgrading routes. Resource optimization supports stable slag supply. Environmental compliance encourages by-product utilization. The Global Titanium Slag Market benefits from circular production models. It aligns with industrial efficiency goals. This driver improves cost control across value chains.
- For instance, Tata Steel reports utilization of over 90% of process by-products across its integrated steel operations, including slag valorization for downstream industrial applications.
Growth In Aerospace And Advanced Alloy Manufacturing
Aerospace programs increase demand for titanium alloys. Aircraft structures require high strength-to-weight materials. Defense platforms also use titanium-intensive components. Alloy producers prefer high-grade slag inputs. Consistent chemistry supports precise alloy control. The Global Titanium Slag Market gains from this premium demand. It supports long-term supply contracts. Technology-intensive sectors reinforce demand stability.
Preference For Slag Over Natural Rutile Sources
Natural rutile availability faces geographic constraints. Titanium slag offers predictable quality and volume. Processors favor slag for scalable production planning. Cost volatility remains lower compared to rutile. Smelter investments improve slag purity levels. The Global Titanium Slag Market benefits from this substitution trend. It supports secure sourcing strategies. Producers gain flexibility across feedstock portfolios.
Market Trends:
Shift Toward High-Purity And Upgraded Slag Products
Producers invest in slag upgrading technologies. Customers demand tighter impurity control. High-purity slag supports premium pigment grades. Smelters enhance beneficiation and refining steps. The Global Titanium Slag Market reflects this quality shift. It raises entry barriers for low-grade suppliers. Technology adoption differentiates leading producers. Product consistency gains strategic importance.
- For instance, Iluka Resources operates synthetic rutile and slag upgrading facilities capable of producing feedstocks with TiO₂ content above 90%, supporting high-performance pigment production.
Regional Capacity Expansion Near End-Use Clusters
Manufacturers expand slag capacity near pigment plants. Proximity reduces logistics cost and lead times. Asia Pacific attracts most new investments. Integrated industrial zones support scale efficiency. The Global Titanium Slag Market aligns capacity with demand centers. It strengthens regional supply chains. Local sourcing improves resilience. Trade exposure declines through regionalization.
- For instance, Anhui Conch Cement operates a clinker and cement capacity exceeding 100 million tons annually, while neighboring producers like Anhui Annada Titanium Industry are strategically located in the same province to optimize logistics for the domestic pigment market
Long-Term Supply Agreements Between Smelters And Pigment Producers
Producers seek contract-based raw material security. Multi-year agreements stabilize pricing structures. Smelters benefit from predictable offtake volumes. The Global Titanium Slag Market shows deeper vertical coordination. It reduces spot market dependence. Strategic partnerships gain preference. Supply planning improves across cycles. Contract discipline shapes procurement behavior.
Technology Focus On Energy-Efficient Smelting Routes
Energy efficiency becomes a priority in slag production. Smelters upgrade furnaces and heat recovery systems. Lower energy intensity improves operating margins. Environmental scrutiny supports cleaner processes. The Global Titanium Slag Market reflects this operational shift. It supports compliance with emission norms. Process optimization gains strategic value. Technology leadership shapes competitiveness.
Market Challenges Analysis:
High Energy Intensity And Production Cost Pressures
Titanium slag production requires energy-intensive smelting. Power price volatility affects operating stability. Smelters face margin pressure during energy spikes. Capital-intensive furnaces raise fixed cost exposure. The Global Titanium Slag Market feels cost sensitivity. It limits rapid capacity expansion. Producers require long-term energy contracts. Cost control remains a persistent challenge.
Raw Material Quality Variability And Supply Constraints
Feedstock quality varies across ilmenite sources. Impurities affect slag yield and consistency. Smelters invest in blending and pre-treatment. Supply disruptions impact production schedules. The Global Titanium Slag Market faces sourcing complexity. It increases operational risk. Quality assurance adds processing cost. Reliable feedstock access remains critical.
Market Opportunities:
Growth In Emerging Pigment Manufacturing Economies
Emerging economies expand domestic pigment capacity. Local paint and plastic demand rises steadily. Governments support industrial self-sufficiency goals. The Global Titanium Slag Market gains new demand pockets. It supports regional supply agreements. Smelters benefit from early market entry. Infrastructure investment sustains long-term growth. Local partnerships improve market access.
Advancement In Slag Upgrading And Recovery Technologies
Technology improves titanium recovery rates from slag. Enhanced upgrading increases usable TiO₂ content. Producers unlock value from existing capacity. The Global Titanium Slag Market benefits from efficiency gains. It supports margin improvement without new mines. Innovation reduces waste generation. Process control enhances product reliability. Technology adoption creates competitive advantage.
Market Segmentation Analysis:
By Type
High titanium slag leads demand due to superior TiO₂ concentration and stable chemistry. Producers prefer this grade for premium pigment and alloy routes. Medium titanium slag serves balanced cost and performance needs across industrial users. Steel-linked producers favor this type for flexible processing. Low titanium slag supports price-sensitive applications with lower purity needs. Volume demand stays steady in basic chemical uses. The Global Titanium Slag Market reflects clear grade-based positioning. It allows suppliers to target varied quality requirements.
- For instance, Richards Bay Minerals produces multiple slag grades from a single smelting complex, enabling tailored supply for pigment producers and industrial chemical users.
By Application
Titanium dioxide production dominates application demand due to scale and consistency needs. Pigment plants require reliable slag quality for chloride and sulfate routes. Welding electrode coating uses slag for arc stability and flux performance. This segment values predictable mineral composition. Other chemical applications include catalysts and specialty compounds. These uses remain niche but stable. The Global Titanium Slag Market aligns output with application-specific standards. It supports diversified end-use exposure.
- For instance, Kenmare Resources supplies titanium slag from its Moma mine to global pigment producers, with annual ilmenite and slag shipments exceeding one million tons, supporting continuous TiO₂ plant operations.
By End-User Industry
Pigment manufacturing represents the largest end-user group due to sustained coatings demand. Producers rely on long-term slag supply contracts. Metal and alloys industries consume slag for titanium-rich feedstock. Aerospace and defense programs support this segment. Chemical industry demand remains moderate but consistent. Other industries include ceramics and specialty materials. The Global Titanium Slag Market balances these end-user needs. It reduces reliance on a single demand source.
Segmentation:
By Type- High Titanium Slag
- Medium Titanium Slag
- Low Titanium Slag
- Titanium Dioxide Production
- Welding Electrode Coating
- Other Chemical Applications
- Pigment Manufacturing
- Metal & Alloys
- Chemical Industry
- Others
- North America
- U.S.
- Canada
- Mexico
- Europe
- Germany
- France
- U.K.
- Italy
- Spain
- Rest of Europe
- Asia Pacific
- China
- Japan
- India
- South Korea
- South-east Asia
- Rest of Asia Pacific
- Latin America
- Brazil
- Argentina
- Rest of Latin America
- Middle East & Africa
- GCC Countries
- South Africa
- Rest of the Middle East and Africa
Regional Analysis:
North America
The North America Titanium Slag Market size was valued at USD 531.93 million in 2018 to USD 738.37 million in 2024 and is anticipated to reach USD 1,158.78 million by 2032, at a CAGR of 5.4% during the forecast period, accounting for nearly 29.3% market share in 2024. The Global Titanium Slag Market in North America benefits from strong pigment production capacity and advanced manufacturing. The United States drives demand through coatings, plastics, and construction materials. Aerospace and defense industries support consistent alloy-grade slag consumption. Producers emphasize quality control and supply security. Environmental regulations encourage efficient smelting practices. Long-term procurement contracts stabilize regional supply. Canada contributes through mineral availability and integrated processing. It maintains steady growth momentum.
Europe
The Europe Titanium Slag Market size was valued at USD 333.36 million in 2018 to USD 444.11 million in 2024 and is anticipated to reach USD 631.07 million by 2032, at a CAGR of 4.1% during the forecast period, representing about 17.6% market share in 2024. The Global Titanium Slag Market in Europe relies on advanced pigment technology and strict quality standards. Germany and France lead demand from coatings and chemical industries. Aerospace manufacturing supports specialty alloy applications. Sustainability policies shape sourcing and processing choices. Import dependence remains moderate across several countries. Producers focus on compliance and traceability. Industrial modernization supports stable consumption. It reflects mature market characteristics.
Asia Pacific
The Asia Pacific Titanium Slag Market size was valued at USD 764.49 million in 2018 to USD 1,118.31 million in 2024 and is anticipated to reach USD 1,856.81 million by 2032, at a CAGR of 6.1% during the forecast period, holding nearly 44.3% market share in 2024. The Global Titanium Slag Market shows its strongest expansion in this region. China dominates due to large pigment manufacturing capacity. Japan and South Korea support demand from automotive and electronics sectors. India records rising consumption from infrastructure coatings. Integrated supply chains improve cost efficiency. Export activity strengthens regional influence. Capacity expansion remains active. It acts as the primary growth engine.
Latin America
The Latin America Titanium Slag Market size was valued at USD 84.30 million in 2018 to USD 117.35 million in 2024 and is anticipated to reach USD 162.29 million by 2032, at a CAGR of 3.7% during the forecast period, accounting for nearly 4.7% market share in 2024. The Global Titanium Slag Market in Latin America grows at a moderate pace. Brazil anchors regional demand through pigment and chemical industries. Mining resources support feedstock availability. Industrial diversification improves application scope. Import reliance remains manageable. Infrastructure projects sustain coatings demand. Investment activity stays selective. It offers steady long-term potential.
Middle East
The Middle East Titanium Slag Market size was valued at USD 48.72 million in 2018 to USD 62.61 million in 2024 and is anticipated to reach USD 82.09 million by 2032, at a CAGR of 3.0% during the forecast period, representing about 2.5% market share in 2024. The Global Titanium Slag Market in the Middle East benefits from construction-driven coatings demand. GCC countries lead regional consumption. Industrial diversification supports chemical applications. Import dependence remains high across most markets. Energy availability supports processing feasibility. Infrastructure investment sustains demand. Market penetration progresses gradually. It reflects niche growth dynamics.
Africa
The Africa Titanium Slag Market size was valued at USD 26.13 million in 2018 to USD 40.92 million in 2024 and is anticipated to reach USD 50.24 million by 2032, at a CAGR of 2.2% during the forecast period, holding nearly 1.6% market share in 2024. The Global Titanium Slag Market in Africa relies on mineral resource strength. South Africa leads regional production and consumption. Export-oriented operations shape demand patterns. Local pigment manufacturing remains limited. Infrastructure gaps affect processing scale. Investment focuses on upstream mining assets. Industrial growth progresses slowly. It holds long-term strategic importance.
Key Player Analysis:
- Tronox Limited
- Iluka Resources Limited
- Timet Group (Titanium Metals Corporation)
- Kenmare Resources Plc
- Cristal Global
- LC Minerals
- Richards Bay Minerals
- Base Titanium Ltd
- Anhui Conch Titanium Slag Co., Ltd.
Competitive Analysis:
The Global Titanium Slag Market features a moderately consolidated competitive structure. Large producers operate integrated mining and smelting assets. This integration supports cost control and feedstock security. Leading players focus on long-term supply agreements with pigment producers. Product quality consistency remains a key competitive factor. Companies invest in slag upgrading and process optimization. Regional proximity to end users strengthens market positioning. Export capability influences global reach. It reflects competition based on scale, reliability, and technical expertise.
Recent Developments:
- Tronox Limited received significant support on December 9, 2025, when the Export-Import Bank of the United States (EXIM) and Export Finance Australia (EFA) announced conditional and non-binding Letters of Support/Interest for up to US$600 million in financing to advance Tronox's rare earth elements supply chain strategy. The funding is intended to support mine extensions, infrastructure development, and cracking and leaching capacity for rare earth production in Western Australia. Tronox has completed a pre-feasibility study and is advancing to a definitive feasibility study for a proposed cracking and leaching facility to produce mixed rare earth carbonate including both light and heavy rare earths. However, on March 17, 2025, Tronox announced a significant restructuring with the permanent closure of its titanium dioxide plant in Botlek, Netherlands, which had an annual capacity of 90,000 metric tons and employed approximately 240 people. The decision followed a strategic review of its asset footprint driven by competitive pressures from Chinese companies and global supply imbalances.
- Kenmare Resources Plc terminated acquisition discussions with an Oryx Global Partners-led consortium on June 19, 2025, after the consortium indicated it would only proceed at pricing substantially below its initial proposal. The consortium ceased engagement after a comprehensive due diligence process and accounting for its findings. Kenmare remains focused on its development projects, with the Wet Concentrator Plant A (WCP A) upgrade project advancing according to plan, though commissioning has experienced delays in Q4 2025, particularly concerning slimes management issues. The upgrade project, scheduled to transition mining to the Nataka ore zone (which comprises approximately 70% of Moma's resource base), is expected to secure long-term production for over 20 years with a capital expenditure estimate of $341 million. In November 2025, Kenmare downgraded its 2025 production guidance due to delays in the WCP A commissioning and new dredge installation.
Report Coverage:
The research report offers an in-depth analysis based on type, application, end-user industry, and regional segments. It details leading market players, providing an overview of their business, product offerings, investments, revenue streams, and key applications. Additionally, the report includes insights into the competitive environment, SWOT analysis, current market trends, as well as the primary drivers and constraints. Furthermore, it discusses various factors that have driven market expansion in recent years. The report also explores market dynamics, regulatory scenarios, and technological advancements that are shaping the industry. It assesses the impact of external factors and global economic changes on market growth. Lastly, it provides strategic recommendations for new entrants and established companies to navigate the complexities of the market.
Future Outlook:
- Demand remains linked to titanium dioxide pigment production growth.
- High-grade slag continues to gain preference across premium applications.
- Asia Pacific sustains its position as the main growth center.
- Integrated supply chains improve operational resilience.
- Technology upgrades enhance slag purity and recovery efficiency.
- Environmental compliance shapes processing choices.
- Long-term contracts stabilize procurement strategies.
- Aerospace alloy demand supports specialty grades.
- Regional capacity expansion reduces logistics dependence.
- Strategic partnerships strengthen global market presence.
Request a Free Sample
Fill in your details and we'll send you a free sample report.
- Sample data tables & charts
- Research methodology
Need a Custom Version of This Report?
Tailor the scope, geography, or segments to your exact requirements.
- Custom geography or segment scope
- Direct access to our analyst team
Frequently Asked Questions
What is the current size of the Titanium Slag Market?
At what Compound Annual Growth Rate is the Global Titanium Slag Market projected to grow between 2025 and 2032?
What factors are driving the growth of the Titanium Slag Market?
Which regions dominate the Titanium Slag Market?
How is the Titanium Slag Market responding to environmental regulations?
What industries contribute most to Titanium Slag consumption?
Table of Content
Chapter 1. Report Introduction
- 1.1 Report Description & Purpose
- 1.1.1 Report Title & Market Definition
- 1.1.2 Unique Selling Propositions (USP) & Key Differentiators
- 1.1.3 Value Proposition for Stakeholders
- 1.2 Research Objectives
- 1.2.1 Market Sizing Objectives (Volume & Revenue)
- 1.2.2 Segmentation Objectives
- 1.2.3 Competitive Intelligence Objectives
- 1.2.4 Forecast & Scenario Objectives
- 1.3 Report Scope
- 1.3.1 Titanium Slag Scope – Types & Subtypes Covered
- 1.3.2 Geographic Scope – Regions & Countries Covered
- 1.3.3 Historical Period, Base Year & Forecast Period (2024; forecast to 2032)
- 1.3.4 Inclusions & Exclusions
- 1.4 HS Code & Classification Framework
- 1.5 Currency, Units & Pricing Basis
- 1.6 Target Stakeholders
- 1.7 Limitations & Assumptions
Chapter 2. Executive Summary
- 2.1 Global Titanium Slag Market Snapshot
- 2.1.1 Market Size – Historical (2024) & Forecast (2024-2032) (2024: USD 2,521.67 million → 2032: USD 3,941.28 million)
- 2.1.2 Volume & Revenue – Global Totals
- 2.1.3 Key Market Highlights – Top Five Facts
- 2.2 Titanium Slag Market Segmentation Snapshot
- 2.2.1 Market Split by Region – 2024 vs. 2032
- 2.3 Competitive Snapshot
- 2.3.1 Top 10 Players by Revenue Share – 2024
- 2.3.2 Top 10 Players by Volume Share – 2024
- 2.3.3 Recent Strategic Developments (18-Month Summary)
- 2.4 Key Investment Highlights & Strategic Conclusions
Chapter 3. Titanium Slag Market Dynamics & Industry Analysis
- 3.1 Market Overview & Context
- 3.1.1 Titanium Slag Market Position in the Broader Automotive Value Chain
- 3.1.2 OEM vs. Replacement Market Dynamics
- 3.1.3 Market Maturity & Development Stage by Region
- 3.2 Titanium Slag Market Drivers
- 3.3 Titanium Slag Market Restraints & Challenges
- 3.4 Titanium Slag Market Opportunities
- 3.5 Porter's Five Forces Analysis
- 3.5.1 Threat of New Entrants
- 3.5.2 Bargaining Power of Suppliers
- 3.5.3 Bargaining Power of Buyers
- 3.5.4 Threat of Substitutes
- 3.5.5 Competitive Rivalry – Intensity Assessment
- 3.6 Titanium Slag Value Chain Analysis
- 3.6.1 Upstream – Raw Material/Input Suppliers
- 3.6.1.1 Raw Material/Input 1
- 3.6.1.2 Raw Material/Input 2
- 3.6.1.3 Raw Material/Input 3
- 3.6.2 Midstream – Production/Manufacturing/Service Delivery
- 3.6.2.1 Production/Process Overview
- 3.6.2.2 Key Facility Locations & Capacity by Manufacturer
- 3.6.3 Downstream – Distribution & End Consumer
- 3.6.3.1 Primary Channel – B2B/OEM
- 3.6.3.2 Secondary Channels – Dealer, Retail, Online, Direct
- 3.6.4 Value Chain Profitability Analysis
- 3.6.1 Upstream – Raw Material/Input Suppliers
- 3.7 PESTEL Analysis
- 3.7.1 Political Factors
- 3.7.2 Economic Factors
- 3.7.3 Social Factors
- 3.7.4 Technological Factors
- 3.7.5 Environmental Factors
- 3.7.6 Legal Factors
- 3.8 Titanium Slag Supply Chain Analysis
- 3.8.1 Raw Material/Input Supply Risk Assessment
- 3.8.2 Manufacturing Concentration Risk (Geographic Exposure)
- 3.8.3 Trade Disruption Impact Analysis
- 3.9 Regulatory & Policy Landscape
Note: The regulatory and policy landscape section covers regulations based on their applicability to the market, Titanium Slag category, geography, and scope of the study. Only regulatory frameworks with a material impact on operations, compliance, trade, sustainability, or market access are analyzed in detail.
Chapter 4. Key Investment Pockets & Opportunity Analysis
- 4.1 Titanium Slag Market Attractiveness Analysis
- 4.1.1 By Region – Investment Attractiveness Matrix (Volume × CAGR)
- 4.2 Absolute Revenue Growth Opportunity
- 4.2.1 By Region – Absolute USD Growth Through 2032
- 4.3 Incremental Volume Opportunity
- 4.3.1 By Region – Incremental Volume Through 2032
- 4.3.2 Segment – Incremental Volume
- 4.4 Emerging Submarket Opportunity Deep Dive (Subject to Applicability)
- 4.5 Emerging Market Opportunity Scorecards
- 4.5.1 United States
- 4.5.2 Europe
- 4.5.3 Asia
- 4.5.4 Middle East & Africa
Note: Emerging Market Opportunity Scorecards will be included based on relevance and strategic importance. Regions listed are indicative and may vary depending on data availability and market dynamics.
Chapter 5. Titanium Slag Import-Export Analysis & Trade Flows
- 5.1 Global Trade Overview
- 5.1.1 Global Export Value by Country (2024)
- 5.1.2 Global Export Volume by Country (2024)
- 5.1.3 Global Import Value by Country (2024)
- 5.1.4 Global Import Volume by Country (2024)
- 5.1.5 Net Trade Balance by Country (2024)
- 5.2 Export Analysis – Segment
- 5.2.1 Type 1 (HS Code)
- 5.2.2 Type 2 (HS Code)
- 5.2.3 Type 3 (HS Code)
- 5.2.4 Type 4 (HS Code)
- 5.2.5 Type 5 (HS Code)
- 5.3 Import Analysis – Segment
- 5.3.1 Type 1 (HS Code)
- 5.3.2 Type 2 (HS Code)
- 5.3.3 Type 3 (HS Code)
- 5.3.4 Type 4 (HS Code)
- 5.3.5 Type 5 (HS Code)
- 5.4 Average Unit Trade Prices
- 5.4.1 Average Export Price – Segment & Country
- 5.4.2 Average Import Price – Segment & Source Country
- 5.4.3 Price Trends (2024)
- 5.5 Key Trade Route Analysis
- 5.5.1 Trade Route 1
- 5.5.2 Trade Route 2
- 5.5.3 Trade Route 3
- 5.5.4 Trade Route 4
- 5.5.5 Trade Route 5
- 5.6 Trade Policy Impact Assessment
- 5.6.1 US Anti-Dumping & Section 301 Tariffs
- 5.6.2 EU Customs Union Impact
- 5.6.3 Major Free Trade Agreements
- 5.6.4 USMCA Rules of Origin
Note: Trade policy analysis will be included only where relevant to the Titanium Slag market.
Chapter 6. Competitive Landscape & Company Benchmarking
- 6.1 Titanium Slag Market Concentration & Structure
- 6.1.1 Herfindahl-Hirschman Index (HHI) – vs. 2024
- 6.1.2 Tier 1, Tier 2 & Tier 3 Market Structure
- 6.1.3 Global, Regional & Local Player Dynamics
- 6.2 Titanium Slag Market Share Analysis – 2024
- 6.2.1 Global Revenue Share by Company
- 6.2.2 Global Volume Share by Company
- 6.2.3 Regional Revenue Share
- 6.2.4 Market Share Evolution ( vs. 2024)
- 6.2.5 OEM Segment Share by Company
- 6.2.6 Replacement Segment Share by Company
- 6.3 Production/Delivery Capacity & Facility Analysis
- 6.3.1 Global Installed Capacity
- 6.3.2 Capacity Utilization Rates
- 6.3.3 Production/Output Volume
- 6.3.4 Facility Locations & Capacity Map
- 6.3.5 Planned Capacity Additions
- 6.4 Titanium Slag Competitive Benchmarking Matrix
- 6.4.1 Revenue, Volume, CAGR & Profitability Comparison
- 6.4.2 Channel Revenue Mix
- 6.4.3 Geographic Revenue Exposure
- 6.4.4 R&D Intensity
- 6.4.5 Sustainability Maturity
- 6.5 Strategic Developments in Titanium Slag (Last 24 Months)
- 6.5.1 Mergers, Acquisitions & Divestments
- 6.5.2 New Titanium Slag Launches
- 6.5.3 Facility Expansions
- 6.5.4 Strategic Alliances, Joint Ventures & Partnerships
- 6.5.5 Distribution Expansion & Market Entry
- 6.5.6 Sustainability & ESG Initiatives
- 6.6 Competitive Strategy Mapping
- 6.6.1 Leader, Challenger, Follower & Niche Classification
- 6.6.2 Pricing Strategy Comparison
- 6.6.3 Channel Strategy Matrix
Note: Strategic developments are included based on their materiality and the availability of reliable information.
Chapter 7. Global Titanium Slag Market – By Distribution Channel
- 7.1 Segment Overview
- 7.1.1 Volume & Revenue Split by Channel (2024 & 2032)
- 7.1.2 Channel Mix Evolution (2024-2032)
Chapter 8. Regional Market Analysis – Global Overview
- 8.1 Global Regional Overview
- 8.1.1 Regional Volume Share
- 8.1.2 Regional Revenue Share
- 8.1.3 Regional Volume by Region
- 8.1.4 Regional Revenue by Region
- 8.1.5 Regional Forecast Through 2032
- 8.2 Cross-Regional Segment Analysis
- 8.2.1 By Distribution Channel
- 8.2.2 By Brand/Price Tier
Chapter 9. North America Titanium Slag Market
- 9.1 United States
- 9.2 Canada
- 9.3 Mexico
Chapter 10. Europe Titanium Slag Market
- 10.1 Germany
- 10.2 France
- 10.3 Italy
- 10.4 United Kingdom
- 10.5 Spain
- 10.6 Poland
- 10.7 Russia
- 10.8 Netherlands
- 10.9 Belgium
- 10.10 Sweden
- 10.11 Denmark
- 10.12 Norway
- 10.13 Rest of Europe
Chapter 11. Asia Pacific Titanium Slag Market
- 11.1 China
- 11.2 India
- 11.3 Japan
- 11.4 South Korea
- 11.5 Thailand
- 11.6 Indonesia
- 11.7 Vietnam
- 11.8 Malaysia
- 11.9 Australia
- 11.10 Rest of Asia Pacific
Chapter 12. Latin America Titanium Slag Market
- 12.1 Brazil
- 12.2 Argentina
- 12.3 Colombia
- 12.4 Chile
- 12.5 Rest of Latin America
Chapter 13. Middle East Titanium Slag Market
- 13.1 Saudi Arabia
- 13.2 United Arab Emirates
- 13.3 Turkey
- 13.4 Israel
- 13.5 Iran
- 13.6 Rest of the Middle East
Chapter 14. Africa Titanium Slag Market
- 14.1 South Africa
- 14.2 Egypt
- 14.3 Nigeria
- 14.4 Morocco
- 14.5 Rest of Africa
Chapter 15. Titanium Slag Company Profiles
- 15.1 [Company 01]
- 15.1.1 Company Overview
- 15.1.2 Key Management Personnel
- 15.1.3 Products & Services Portfolio
- 15.1.4 Financial Performance
- 15.1.5 Key Market Focus & Geographic Presence
- 15.1.6 Recent Developments & Strategic Initiatives
Note: The company profile list is preliminary and may change based on research findings, market developments, data availability, and client requirements.
Chapter 16. Appendices
- Appendix A – List of Abbreviations & Acronyms
- Appendix B – Industry Classification Code Reference – Full Series
- Appendix C – Production & Capacity Data Tables
- Appendix D – End-Use & Demand Base Tables
- Appendix E – Consumption & Replacement Rate Assumptions
- Appendix F – ASP Reference Tables
- Appendix G – Manufacturing & Facility Database
- Appendix H – Import-Export Data Tables
- Appendix I – Regulatory Summary Tables
- Appendix J – Primary Research Participant List (Anonymized)
- Appendix K – Primary Research Questionnaire Framework
- Appendix L – Data Sources & Bibliography
- Appendix M – Market Size Divergence & Source Comparison
Chapter 17. Research Methodology
- 17.1 Research Framework & Philosophy
- 17.2 Secondary Research – Sources, Hierarchy & Data Extraction
- 17.3 Data Modeling – Bottom-Up & Top-Down Market Sizing
- 17.4 Primary Research – Stakeholder Framework, LOI & Sample Sizes
- 17.5 Forecast Methodology – Regression, Scenario & Sensitivity Analysis
- 17.6 Quality Control – Four-Layer Validation Framework
- 17.7 Limitations & Standard Assumptions
- 17.8 Disclaimer
