Market Overview:
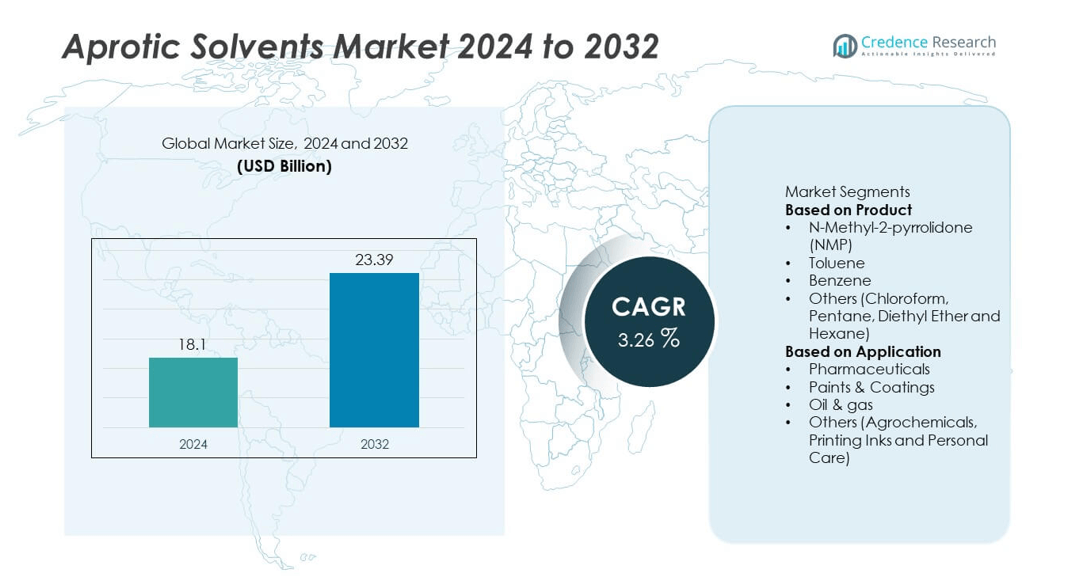
The global Aprotic Solvents Market was valued at USD 18.1 billion in 2024 and is projected to reach USD 23.39 billion by 2032, growing at a CAGR of 3.26% during the forecast period.
| REPORT ATTRIBUTE |
DETAILS |
| Historical Period |
2020-2023 |
| Base Year |
2024 |
| Forecast Period |
2025-2032 |
| Aprotic Solvents Market Size 2024 |
USD 18.1 billion |
| Aprotic Solvents Market, CAGR |
3.26% |
| Aprotic Solvents Market Size 2032 |
USD 23.39 billion |
The global Aprotic Solvents market is led by key players including BASF SE, Eastman Chemical Company, Ashland Global Holdings Inc., LyondellBasell Industries N.V., Mitsubishi Chemical Corporation, INEOS Group Holdings S.A., DuPont de Nemours, Inc., Shell Chemicals, Shandong Ruixing Chemical Co., Ltd., and Kureha Corporation. These companies dominate the market through strong production capabilities, advanced R&D, and a wide product portfolio across industrial, pharmaceutical, and coatings applications. Asia-Pacific led the market with a 29.7% share in 2024, driven by large-scale chemical manufacturing and battery production. North America followed with 32.4%, supported by advanced pharmaceutical and energy sectors, while Europe, holding 28.1%, continues to expand through sustainable and bio-based solvent development.
Market Insights
- The global Aprotic Solvents market was valued at USD 18.1 billion in 2024 and is projected to reach USD 23.39 billion by 2032, growing at a CAGR of 3.26% during 2025–2032.
- Increasing demand from pharmaceuticals, paints, and coatings industries is driving growth, supported by rising applications in chemical synthesis and extraction processes.
- The market is witnessing trends toward eco-friendly, low-toxicity, and bio-based solvents as regulatory standards tighten globally.
- Leading companies such as BASF SE, Eastman Chemical Company, LyondellBasell Industries, and Mitsubishi Chemical Corporation dominate through innovation and product diversification across multiple industrial sectors.
- Asia-Pacific held a 29.7% share, North America accounted for 32.4%, and Europe captured 28.1%, while the N-Methyl-2-pyrrolidone (NMP) segment led by product with a 41.7% share, driven by strong demand from electronics and battery manufacturing industries.
Access crucial information at unmatched prices!
Request your sample report today & start making informed decisions powered by Credence Research Inc.!
Download Sample
Market Segmentation Analysis:
By Product
The N-Methyl-2-pyrrolidone (NMP) segment dominated the aprotic solvents market with a 41.7% share in 2024. Its strong solvency power, high chemical stability, and wide use in electronics and pharmaceutical formulations drive its dominance. NMP is widely adopted in lithium-ion battery production and polymer processing due to its ability to dissolve diverse compounds effectively. Growing demand for electric vehicles and advanced electronics continues to boost its consumption. Meanwhile, toluene and benzene also hold notable shares, primarily in paints, coatings, and petrochemical applications, owing to their cost efficiency and easy availability.
- For instance, BASF SE expanded its biomass-balanced portfolio for selected chemical intermediates, including butanediol, tetrahydrofuran, and polytetrahydrofuran, in 2024 to cover global facilities. This expansion allows the company to offer certified, sustainable products that contribute to reduced carbon footprints through certified feedstock substitution.
By Application
The paints and coatings segment held the largest share of 36.4% in the aprotic solvents market in 2024. Its leadership is attributed to the extensive use of aprotic solvents as carriers and diluents in industrial and decorative coatings. Their fast evaporation rate and strong solvency enable uniform coating formation and pigment dispersion. The pharmaceuticals segment follows closely, driven by the role of aprotic solvents in drug synthesis and formulation. Expanding oil and gas activities further contribute to market demand due to their use in extraction and refining processes.
- For instance, Eastman Chemical enhanced its Kingsport molecular recycling facility to process 110,000 metric tons of hard-to-recycle polyester plastic waste annually, which is converted back into new, high-quality polyesters.
Key Growth Drivers
Rising Demand from Pharmaceutical and Chemical Industries
The growing use of aprotic solvents in pharmaceutical formulations and chemical synthesis is a key growth driver. These solvents offer high polarity, stability, and compatibility with active ingredients, enabling efficient drug production. Pharmaceutical manufacturers increasingly rely on N-Methyl-2-pyrrolidone (NMP) and dimethyl sulfoxide (DMSO) for controlled reactions and purification processes. Expanding pharmaceutical R&D and generic drug production globally continues to drive consistent demand for aprotic solvents across laboratories and industrial-scale facilities.
- For instance, Mitsubishi Chemical expanded its γ-butyrolactone output by 2,000 tons per year, bringing its capacity to 20,000 tons, to meet demand for downstream NMP used in lithium-ion batteries and semiconductor cleaning.
Expansion of Paints and Coatings Sector
Rapid growth in the paints and coatings industry significantly boosts the aprotic solvents market. These solvents are crucial for achieving smooth surface finishes, uniform dispersion, and stable formulations in decorative and industrial coatings. The rising construction and automotive production activities in emerging economies further strengthen demand. Manufacturers are also focusing on low-VOC aprotic solvents to meet environmental standards, supporting sustainable growth while maintaining performance in coating applications.
- For instance, LyondellBasell acquired German company APK AG to advance its solvent-based “Newcycling” recycling technology in Europe, which addresses hard-to-recycle flexible plastic waste, and has invested in other advanced recycling projects.
Technological Advancements and Industrial Applications
Technological improvements in solvent recovery, formulation, and chemical processing are driving market expansion. Aprotic solvents are increasingly used in high-performance applications, including electronics, batteries, and polymers, due to their superior solvency and stability. Advancements in lithium-ion battery manufacturing have enhanced NMP’s adoption as a key component in electrode production. Additionally, growing focus on industrial efficiency and material innovation supports continuous product development in high-purity aprotic solvents for specialized applications.
Key Trends & Opportunities
Shift Toward Environmentally Safer Alternatives
The market is witnessing a strong trend toward bio-based and low-toxicity aprotic solvents. Growing environmental concerns and strict emission regulations are prompting companies to develop greener alternatives to traditional products like benzene and toluene. These eco-friendly solvents reduce health hazards while maintaining high solvency and performance. Increasing investments in green chemistry research and regulatory support for sustainable manufacturing are expected to create new opportunities for innovation and market differentiation.
- For instance, INEOS Group upgraded its Marl plant with a new cumene facility that uses new technology and heat integration to reduce its carbon footprint by 50% per tonne of product.
Rising Demand from Lithium-Ion Battery Production
The rapid growth of electric vehicles and energy storage systems has created significant opportunities for aprotic solvents, especially NMP and DMSO. These solvents are widely used as electrolytes and binder carriers in battery electrode manufacturing. The shift toward high-capacity, durable batteries for EVs and portable electronics will continue driving demand. Expanding production capacity by major battery manufacturers globally further reinforces the importance of aprotic solvents in the clean energy supply chain.
- For instance, Kureha Corporation is adding a new 8,000 tons annually PVDF binder production line at Iwaki, bringing its total capacity there to 14,000 tons, to meet growing demand from EV cell producers. The company is also developing new binder grades for LFP batteries.
Growing Use in Oil and Gas Processing
The oil and gas sector increasingly uses aprotic solvents for extraction, purification, and refining processes. Their superior thermal stability and non-reactive nature enhance operational efficiency in separation and desulfurization applications. Expanding offshore exploration and rising demand for refined products in developing economies create growth opportunities. The use of aprotic solvents in lubricant formulations and corrosion control adds further value to this segment’s long-term market potential.
Key Challenges
Environmental and Health Concerns
Toxicity and environmental impact pose major challenges for the aprotic solvents market. Solvents such as benzene and toluene are classified as hazardous due to their carcinogenic properties and volatile emissions. Regulatory frameworks like REACH and EPA restrictions are forcing manufacturers to phase out or reformulate high-risk solvents. Compliance costs, coupled with the need for safer alternatives, increase production expenses and may restrain growth in highly regulated regions such as Europe and North America.
Fluctuating Raw Material Prices and Supply Chain Constraints
The volatility in crude oil prices directly affects the production cost of petrochemical-based aprotic solvents. Supply chain disruptions, geopolitical tensions, and fluctuating availability of feedstocks like toluene and benzene impact market stability. These challenges raise operational costs for manufacturers and limit profit margins. Furthermore, dependence on limited suppliers for high-purity solvent grades adds uncertainty, particularly in industries with stringent quality requirements such as pharmaceuticals and electronics.
Regional Analysis
North America
North America held a 32.4% share of the global aprotic solvents market in 2024, driven by strong demand from the pharmaceutical, coatings, and oil and gas sectors. The United States leads the region’s growth due to its well-established chemical manufacturing base and expanding use of NMP and DMSO in drug formulation and battery production. Stringent environmental regulations are encouraging innovation in low-toxicity and high-performance solvents. The presence of major industry players and growing R&D investments in green chemistry continue to support market expansion across both industrial and laboratory applications in this region.
Europe
Europe accounted for a 28.1% share of the aprotic solvents market in 2024. Growth is driven by the region’s strong industrial base in chemicals, pharmaceuticals, and paints and coatings. Germany, France, and the United Kingdom lead consumption due to robust production of specialty chemicals and automotive coatings. Strict environmental laws under REACH are promoting a gradual shift toward bio-based and low-VOC solvent formulations. The region’s ongoing focus on sustainability, combined with rising demand for advanced materials, supports steady adoption of eco-friendly aprotic solvents in diverse end-use industries.
Asia-Pacific
Asia-Pacific captured a 29.7% share of the global aprotic solvents market in 2024 and is expected to grow fastest through 2032. Rapid industrialization, expanding construction activities, and the growth of the pharmaceutical and electronics sectors drive regional demand. China, India, Japan, and South Korea are major consumers due to large-scale production of paints, polymers, and lithium-ion batteries. The region’s cost-effective manufacturing capabilities and strong chemical production infrastructure support large-scale supply. Growing investment in renewable energy and electric mobility further strengthens market prospects for NMP and DMSO in this region.
Latin America
Latin America accounted for a 5.4% share of the global aprotic solvents market in 2024. The region’s growth is supported by increasing demand from the oil and gas and construction industries, particularly in Brazil and Mexico. Rising investments in paints and coatings production and the gradual adoption of advanced solvents in pharmaceutical manufacturing also contribute to expansion. However, limited regulatory standardization and slower technological adoption present mild challenges. Ongoing industrial development and efforts to improve chemical production capacity are expected to sustain steady market growth over the forecast period.
Middle East & Africa
The Middle East & Africa region held a 4.4% share of the global aprotic solvents market in 2024. Demand is driven by the oil and gas sector, where aprotic solvents are used in refining and extraction processes. The United Arab Emirates and Saudi Arabia lead adoption, supported by expanding petrochemical and construction activities. Growing healthcare investment and infrastructure development are also fueling consumption. Although the market is smaller compared to other regions, increasing focus on industrial diversification and green chemistry initiatives is expected to enhance the region’s future market potential.
Market Segmentations:
By Product
- N-Methyl-2-pyrrolidone (NMP)
- Toluene
- Benzene
- Others (Chloroform, Pentane, Diethyl Ether and Hexane)
By Application
- Pharmaceuticals
- Paints & Coatings
- Oil & gas
- Others (Agrochemicals, Printing Inks and Personal Care)
By Geography
- North America
- Europe
- Germany
- France
- U.K.
- Italy
- Spain
- Rest of Europe
- Asia Pacific
- China
- Japan
- India
- South Korea
- South-east Asia
- Rest of Asia Pacific
- Latin America
- Brazil
- Argentina
- Rest of Latin America
- Middle East & Africa
- GCC Countries
- South Africa
- Rest of the Middle East and Africa
Competitive Landscape
The competitive landscape of the aprotic solvents market is defined by the strong presence of key players such as BASF SE, Eastman Chemical Company, Ashland Global Holdings Inc., LyondellBasell Industries N.V., Mitsubishi Chemical Corporation, INEOS Group Holdings S.A., DuPont de Nemours, Inc., Shell Chemicals, Shandong Ruixing Chemical Co., Ltd., and Kureha Corporation. These companies compete through product innovation, expansion of production capacities, and sustainable chemistry initiatives. Leading manufacturers are focusing on developing high-purity, low-toxicity solvents to meet strict environmental regulations and evolving end-user needs. Strategic mergers, acquisitions, and collaborations are common as firms strengthen global distribution networks and diversify application portfolios in pharmaceuticals, coatings, and electronics. Growing emphasis on eco-friendly formulations and solvent recovery technologies is driving technological advancement and intensifying competition across the global aprotic solvents industry.
Shape Your Report to Specific Countries or Regions & Enjoy 30% Off!
Key Player Analysis
- BASF SE
- Eastman Chemical Company
- Ashland Global Holdings Inc.
- LyondellBasell Industries N.V.
- Mitsubishi Chemical Corporation
- INEOS Group Holdings S.A.
- DuPont de Nemours, Inc.
- Shell Chemicals
- Shandong Ruixing Chemical Co., Ltd.
- Kureha Corporation
Recent Developments
- In July 2025, LyondellBasell Industries N.V. strengthened its position in sustainable chemicals by announcing joint development projects for new bio-based and recyclable solutions.
- In April 2025, Eastman also implemented a price increase for solvents, aligning with trends for higher value-added, compliant solutions in the aprotic solvents market.
- In 2024, DuPont de Nemours, Inc. highlighted significant progress in sustainable innovation with a focus on safer and more compliant solvent solutions for the chemical and electronics sectors, aiming to deliver enhanced environmental and operational outcomes as reflected in their 2025 sustainability strategy.
- In 2024, Kureha Corporation focused research and development on new grades of high-performance polyvinylidene fluoride (PVDF) and other specialty fluoropolymers for lithium-ion battery and electronics applications, with sample evaluation and prototyping underway for next-generation aprotic solvent and binder solutions targeted at automotive energy storage
Report Coverage
The research report offers an in-depth analysis based on Product, Application and Geography. It details leading market players, providing an overview of their business, product offerings, investments, revenue streams, and key applications. Additionally, the report includes insights into the competitive environment, SWOT analysis, current market trends, as well as the primary drivers and constraints. Furthermore, it discusses various factors that have driven market expansion in recent years. The report also explores market dynamics, regulatory scenarios, and technological advancements that are shaping the industry. It assesses the impact of external factors and global economic changes on market growth. Lastly, it provides strategic recommendations for new entrants and established companies to navigate the complexities of the market.
Future Outlook
- Demand for high-purity aprotic solvents will increase with the growth of the pharmaceutical sector.
- Adoption of eco-friendly and bio-based solvents will accelerate due to stricter environmental regulations.
- Expansion of electric vehicle production will boost the use of NMP in lithium-ion batteries.
- Technological advancements in solvent recovery will enhance sustainability and cost efficiency.
- Rising R&D investments will drive innovation in low-toxicity solvent formulations.
- Asia-Pacific will continue to lead global production and consumption due to rapid industrialization.
- The paints and coatings industry will remain a key consumer segment for aprotic solvents.
- Strategic collaborations and capacity expansions will strengthen the competitive landscape.
- Regulatory pressures in Europe and North America will encourage cleaner manufacturing practices.
- Increasing oil and gas exploration activities will sustain demand for aprotic solvents in extraction and refining applications.



