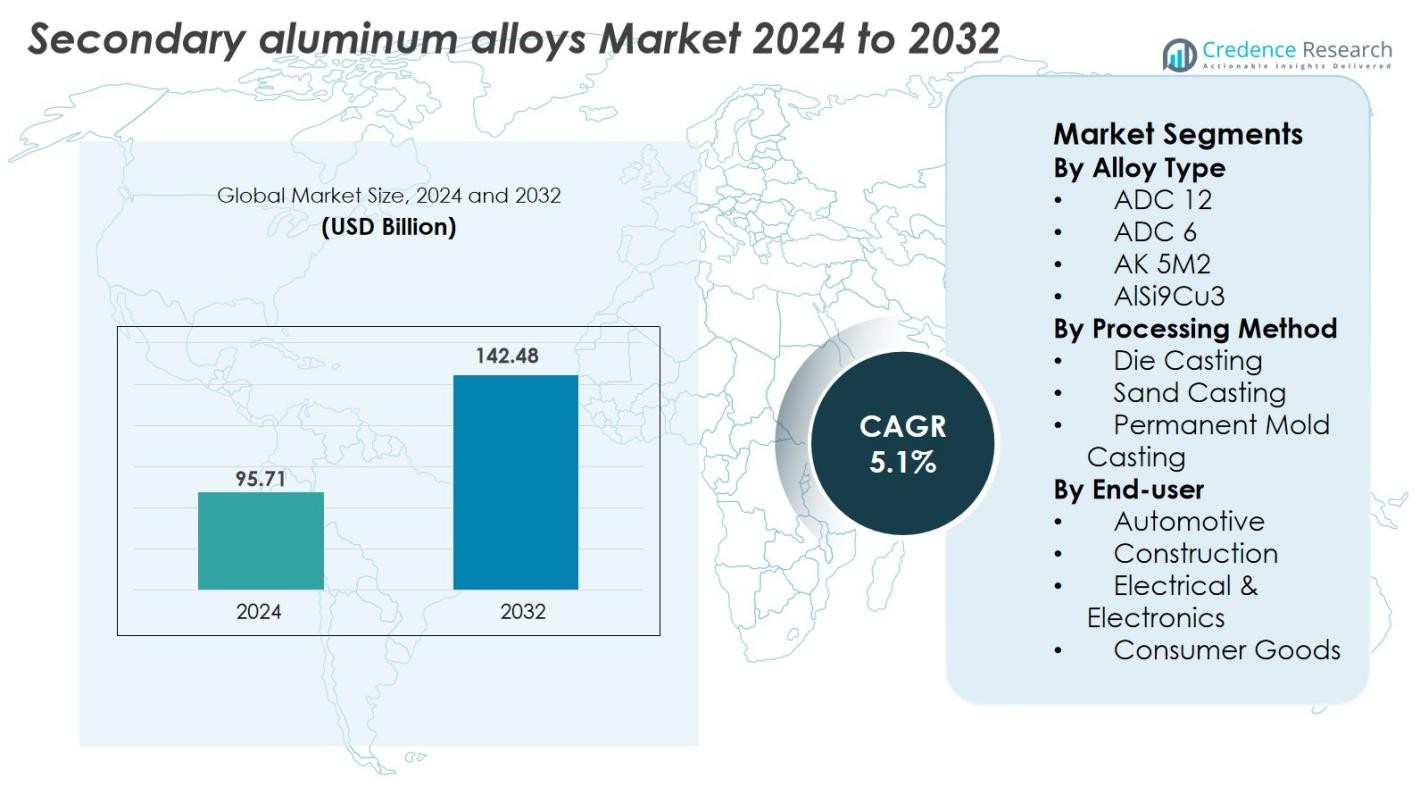
Home » Chemicals » Secondary Aluminum Alloys Market

Secondary Aluminum Alloys Market By Alloy Types (Wrought Alloys, Case Alloys) By Strength Types (Low Strength, High Strength, Ultra-High Strength Aluminum Alloys)-Growth, Future Prospects & Competitive Analysis, 2016 – 2030

Price: $4999

Published: | Report ID: 19172 | Report Format : PDF

Key Highlights of the Report

The global secondary aluminum alloy market is segmented by Alloy Type, Strength Type, Application Type, and region. The wrought alloy segment is the most popular segment amongst the alloy type, while the case Alloy is the fastest-growing segment. High-strength alloys hold the dominant position among the strongest type and ultra-high-strength aluminum alloy is the fastest-growing segment among the strongest type. The automotive segment holds the largest revenue share by application segment, with Europe leading the market growth.

The global secondary aluminum alloys market has been driven by several factors including the growing awareness of the environment. Additionally, a trend for increasing the use of secondary aluminum in the automotive industry. however, the low availability and availability and quality of scrap aluminum are restraining the market growth over the forecast period.

Nonetheless, the global secondary aluminum alloys market offers significant growth opportunities, increasing demand for sustainable materials. Additionally, the increasing production of primary aluminum across the globe is also expected to drive market growth.

Design Element 2

Access crucial information at unmatched prices!

Request your free sample report today & start making informed decisions powered by Credence Research!

Download Free Sample
CTA Design Element 3

Market Overview

The global secondary aluminum alloy market has witnessed steady growth in recent years and is expected to grow at a CAGR of 3.90% between 2023 and 2030. The market was valued at USD 41.5 billion in 2022 and is expected to reach USD 54.24 billion in 2030.

What Are the Main Drivers of The Global Secondary Aluminum Alloys Market?

Several factors, including the increasing awareness about the environment on the disposal of aluminum drive the global secondary aluminum alloy market.

What Are the Major Challenges Faced by The Global Secondary Aluminum Alloys Market?

The global secondary aluminum alloy market also faces several challenges, including lower availability and low quality of aluminum scrap. Secondary aluminum alloys are produced by recycling scrap aluminum. The availability and quality of scrap aluminum can affect the production capacity and the quality of the secondary alloys.

What Are the Growth Opportunities in The Global Secondary Aluminum Alloys Market?

The global Secondary Aluminum Alloys market offers significant growth opportunities as the demand for sustainable materials is increasing across the globe.

Executive Summary

Overview of the Global Secondary Aluminum Alloys Market

The global secondary aluminum alloy market has been rapidly growing in recent years. The global shift towards sustainability and environmental consciousness is driving the growth of the secondary aluminum alloy market.

Market Definition

The secondary aluminum alloy market refers to the market for aluminum alloys produced through scrap aluminum recycling and re-melting. Secondary aluminum alloys are made by melting down and processing various forms of aluminum scrap, such as used beverage cans, automotive parts, and industrial scrap. These alloys are then used in various industries, including automotive, aerospace, construction, packaging, and consumer goods. Secondary aluminum alloys are seen as a more sustainable alternative to primary aluminum, as their production consumes less energy and generates fewer emissions.

Market Insights

  • The global demand for secondary aluminum alloys was valued at USD 41.5 Billion in 2022 and is expected to reach USD 54.24 Billion in 2030, growing at a CAGR of 3.90% between 2023 and 2030.
  • Wrought alloys is the leading segment and held the largest share in terms of value in 2022, and it exhibits the fastest CAGR during the forecast period.
  • High-strength aluminum alloys hold the leading market share in 2022.
  • Ultra-high strength aluminum alloy holds the largest CAGR in terms of value and it is the fastest-growing sub-segment by strength type.
  • Automotive hold the largest market share in term of value segment among the application type over the forecast period.
  • Whereas building and construction hold the fastest growing CAGR over the forecast period.
  • Europe is fuelling the growth of the Secondary Aluminum Alloys industry with nearly a two-fifth share in 2022, while North America and Asia Pacific collectively accounted for just nearly under 55% share in 2022. Asia-pacific held over 22% share in 2022.
  • The infrastructure and construction industries are major consumers of aluminum alloys. Secondary aluminum alloys can find opportunities in applications such as building facades, windows, doors, and structural components. With urbanization and infrastructure development taking place globally, there is potential for increased demand for secondary aluminum alloys in these sectors.

Secondary aluminum alloys can offer cost advantages over primary aluminum, especially when the prices of primary aluminum are high. Recycling scrap aluminum requires less energy and avoids the costs associated with primary aluminum production, making secondary aluminum alloys economically attractive to manufacturers.

Segmentation by Alloy Type

  • Wrought alloy type is the leading segment and held the highest share in value in 2022.
  • The case alloy likely exhibits the fastest CAGR during the forecast period.

Segmentation by Strength Type

  • High strength is the leading segment and largest revenue share in 2022
  • Ultra-high strength aluminum alloys it is expected to hold the fastest CAGR during the forecast period.

Segmentation by Application Type

  • The automotive application segment governs the demand for the global secondary aluminum alloys industry, holding a massive share, and is also expected to grow at a rapid CAGR.
  • The building and construction application segment contributes the rest to the demand for corn ingredients.

Segmentation by Region

  • Europe was fuelling the growth of the secondary aluminum alloys industry with a nearly two-fifths share in 2022.
  • North America and Asia-pacific collectively account for nearly under 55% share in 2022, with Asia-pacific holding over 22% share in the same year.
  • The rest of the world, including Latin America, The Middle East, and Africa, contributes the remainder to the demand for secondary aluminum alloys.

The primary driver of the secondary aluminum alloy market is the growing awareness about aluminum. As societies and industries become more conscious of the environmental impact of their activities, there is an increasing emphasis on sustainable practices, recycling, and the use of recycled materials. This shift in mindset has created a favorable environment for the expansion of the secondary aluminum alloy market.

In Germany, the country has implemented stringent environmental regulations and policies that prioritize recycling and the use of recycled materials. The German government encourages the adoption of secondary aluminum alloys through waste management laws, recycling targets, and financial incentives. These supportive measures create a favorable environment for the growth of the secondary aluminum alloy market in the country.

In the U.S., the automotive and transportation industries in the US are significant consumers of aluminum alloys. Secondary aluminum alloys provide lightweight, high-strength solutions for various automotive components, including engine parts, wheels, and body panels. With the focus on fuel efficiency, emissions reduction, and electric vehicles, the demand for lightweight materials like secondary aluminum alloys has increased in the US automotive industry. The increasing production of automobiles across the country is driving the growth of the global secondary aluminum alloy market over the forecast period. For instance, according to the report by the Bureau of Transportation Statistics in January 2022, the production of passenger cars in the U.S. accounted for 8,818 thousand units in 2020 which increased to 9,157 thousand units in 2021.

Overall, the secondary aluminum alloy market is experiencing substantial growth due to the combination of supportive government policies, the automotive and construction sectors’ demand, a well-developed recycling infrastructure, and consumer consciousness about the environment contributes to the increasing demand for secondary aluminum alloys in Germany. As sustainability continues to be a priority in the country’s industrial practices, the growth of the secondary aluminum alloy market is expected to continue in the future.

Growing Awareness About the Environment

The use of secondary aluminum alloys is considered a sustainable material choice compared to primary aluminum. Secondary aluminum alloys are produced by recycling and re-melting scrap aluminum, which reduces the need for primary aluminum extraction and processing. By utilizing recycled materials, the secondary aluminum alloy market helps conserve natural resources, reduce energy consumption, and minimize greenhouse gas emissions associated with primary aluminum production

The concept of the circular economy, which aims to minimize waste and keep resources in a continuous loop of use and recycling, aligns with the production of secondary aluminum alloys. Recycling aluminum scrap into secondary alloys exemplifies the principles of the circular economy by extending the lifespan of the material and minimizing waste generation. The growing recognition of the circular economy’s benefits has led to increased demand for recycled materials like secondary aluminum alloys.

Secondary Aluminum Alloys Market

Increasing Focus on Recycling of Aluminum

The increasing focus on the recycling of aluminum is a significant driver for the growth of the secondary aluminum alloy market. The recognition of the environmental and economic benefits associated with aluminum recycling has led to a shift in mindset towards sustainable practices and resource efficiency. There is a growing global awareness of the environmental impact of industrial activities, including primary aluminum production. Aluminum recycling offers a more sustainable alternative by reducing energy consumption, greenhouse gas emissions, and the need for primary aluminum extraction. As a result, industries and consumers are prioritizing the use of recycled aluminum and driving the demand for secondary aluminum alloys.

Lower Availability and Quality of Secondary Aluminum Scrap

Secondary aluminum alloys are produced by recycling scrap aluminum. The availability and quality of scrap aluminum can affect the production capacity and the quality of the secondary alloys. Insufficient supply or poor-quality scrap aluminum can limit the growth of the market.

The energy-intensive nature of aluminum recycling and production can make energy costs a significant factor in the profitability of secondary aluminum alloy producers. Fluctuations in energy prices or high energy costs in certain regions can impact the economic viability of secondary aluminum production, thus hindering market growth.

Increasing Demand for Sustainable Material

The global shift towards sustainability and environmental consciousness presents a significant opportunity for the secondary aluminum alloy market. Secondary aluminum production involves recycling and reusing aluminum scrap, reducing energy consumption and greenhouse gas emissions compared to primary aluminum production. As the demand for sustainable materials continues to rise, secondary aluminum alloys can gain traction as an eco-friendly alternative to primary aluminum. As the automotive industry continues to explore light weighting solutions to improve fuel efficiency and reduce emissions, secondary aluminum alloys can offer cost-effective and sustainable alternatives to traditional materials

Competitive Landscape

Key Players

The global secondary aluminum alloy market is highly competitive, with the presence of several key players. Some of the major players in the market and their market share are as follows:

These companies focus on product innovation, expanding their strength types, mergers, and acquisitions to stay ahead in the market.

The major players in the global secondary aluminum alloys market constantly strive to stay ahead by introducing new products and innovations.

In March 2023, The RONAL GROUP, a manufacturer of light alloys wheel announced that it has the goal of a 50% reduction in its CO2 emissions in manufacturing by 2030, and of completely CO2-neutral production of all its wheels by 2050. The German plant in Landau is taking a leading role here, producing the first light-alloy wheels made of 100% secondary aluminum for the new all-electric MINI Cooper SE Convertible.

In November 2021, Companhia Brasileira de Alumínio (CBA), an aluminum producer inked an agreement to acquire 80% of Alux do Brasil, located in Nova Odessa-SP, in a transaction worth R$ 110 million, with a preference to buy the remaining 20% ​​from the third year after accomplishment of the transaction. Alux do Brasil stands among the largest producers of secondary aluminum alloys in Brazil and holds accounts of the major players in the automotive segment as its customers.

Shape Your Report to Specific Countries or Regions & Enjoy 30% Off!

Summary of Key Findings

  • The increasing demand for sustainable alloy products across the globe has spurred the market for secondary aluminum alloy market. Industries such as automotive, aerospace, and construction have shown an increasing demand for lightweight and sustainable materials. Secondary aluminum alloys provide the desired characteristics of durability,strength, and corrosion resistance, making them suitable for various applications in these industries. Which will further be expected to drive market growth.
  • Market segmented by alloy type, strength type, application type, and region.
  • Wrought alloys are the most popular segment in the Alloy Type.
  • High strength holds the dominant position in the strength type segment.
  • Ultra-high strength aluminum alloy among the strength type holds the highest CAGR over the forecast period.
  • Among the application types automotive application holds the highest market share across the globe.
  • Building & construction holds the fastest-growing segment across the globe over the forecast period.
  • Europe is leading market growth; the market is highly competitive with key players including Century Metal Recycling Limited, Kawashima Co., Ltd., Daiki Aluminum Industry Co., Ltd., Allocco Recycling, Ltd., Superior Aluminum Alloys, LLC, Metal Exchange Corporation, and others.

Future Outlook

  • Positive outlook for the global Secondary Aluminum Alloys market with significant growth potential in the Europe region
  • The rapid growth in the demand for sustainable materials across the globe is driving the market growth for car charging Applications
  • Challenges low availability and quality of secondary aluminum alloy can be a barrier for some EV owners. As the market expands, efforts are needed to develop cost-effective solutions without compromising safety and quality. Manufacturers must strike a balance between affordability and functionality to cater to a wide range of customers.

Segmentation

  • By Alloy Types
    • Wrought Alloys
    • Case Alloys
  • By Strength Types
    • Low Strength
    • High Strength
    • Ultra-High Strength Aluminum Alloys
  • By Application Type
    • Building & Construction
    • Automotive
    • Aluminum Cans
    • Others
  • By Region
    • North America
      • The US.
      • Canada
      • Mexico
    • Europe
      • Germany
      • France
      • The U.K.
      • Italy
      • Spain
      • Rest of Europe
    • Asia Pacific
      • China
      • Japan
      • India
      • South Korea
      • South-east Asia
      • Rest of Asia Pacific
    • Latin America
      • Brazil
      • Argentina
      • Rest of Latin America
    • Middle East & Africa
      • GCC Countries
      • South Africa
      • Rest of the Middle East and Africa

1. Preface
1.1. Report Description
1.1.1. Purpose of the Report
1.1.2. Target Audience
1.1.3. USP and Key Offerings
1.2. Research Scope
1.3. Research Methodology
1.3.1. Phase I – Secondary Research
1.3.2. Phase II – Data Modelling
1.3.2.1. Company Share Analysis Model
1.3.2.2. Revenue Based Modelling
1.3.3. Phase III – Primary Research
1.3.4. Research Limitations
1.3.5. Assumptions
1.4. Market Introduction
1.5. Market Research Scope

2. Executive Summary
2.1. Market Snapshot: Global Secondary Aluminum Alloy Market
2.2. Global Secondary Aluminum Alloy Market, By Alloy Type
2.3. Global Secondary Aluminum Alloy Market, By Strength
2.4. Global Secondary Aluminum Alloy Market, By Application
2.5. Global Secondary Aluminum Alloy Market, By Region

3. Market Dynamics & Factors Analysis
3.1. Introduction
3.1.1. Global Secondary Aluminum Alloy Market Value, 2017-2030, (US$ Bn)
3.1.2. Y-o-Y Growth Trend Analysis
3.2. Market Dynamics
3.2.1. Market Drivers
3.2.1.1. Driver 1
3.2.1.2. Driver 2
3.2.1.3. Driver 3
3.2.2. Market Restraints
3.2.2.1. Restraint 1
3.2.2.2. Restraint 2
3.2.3. Market Opportunities
3.2.3.1. Opportunity 1
3.2.3.2. Opportunity 2
3.2.4. Major Industry Challenges
3.2.4.1. Challenge 1
3.2.4.2. Challenge 2
3.3. Growth and Development Patterns
3.4. Investment Feasibility Analysis
3.5. Market Opportunity Analysis
3.5.1. Alloy Type
3.5.2. Strength
3.5.3. Application
3.5.4. Geography

4. Premium Insights
4.1. STAR (Situation, Task, Action, Results) Analysis
4.2. Porter’s Five Forces Analysis
4.2.1. Threat of New Entrants
4.2.2. Bargaining Power of Buyers/Consumers
4.2.3. Bargaining Power of Suppliers
4.2.4. Threat of Substitute Alloy Types
4.2.5. Intensity of Competitive Rivalry
4.3. Key Market Trends
4.3.1. Demand Side Trends
4.3.2. Supply Side Trends
4.4. Value Chain Analysis
4.5. Technology Analysis
4.6. Analysis and Recommendations
4.7. Marketing Strategy Analysis
4.7.1. Direct Marketing
4.7.2. Indirect Marketing
4.7.3. Marketing Channel Development Trend

5. Market Positioning of Key Players, 2022
5.1. Company market share of key players, 2022
5.2. Competitive Benchmarking
5.3. Market Positioning of Key Vendors
5.4. Geographical Presence Analysis
5.5. Major Strategies Adopted by Key Players
5.5.1. Key Strategies Analysis
5.5.2. Mergers and Acquisitions
5.5.3. Partnerships
5.5.4. Product Launch
5.5.5. Geographical Expansion
5.5.6. Others

6. Economic Impact Analysis
6.1. Recession Impact
6.1.1. North America
6.1.2. Europe
6.1.3. Asia Pacific
6.1.4. Latin America
6.1.5. Middle East and Africa
6.2. Ukraine-Russia War Impact
6.2.1. North America
6.2.2. Europe
6.2.3. Asia Pacific
6.2.4. Latin America
6.2.5. Middle East and Africa
6.3. COVID-19 Impact Analysis
6.3.1. North America
6.3.2. Europe
6.3.3. Asia Pacific
6.3.4. Latin America
6.3.5. Middle East and Africa

7. Global Secondary Aluminum Alloy Market, By Alloy Type
7.1. Global Secondary Aluminum Alloy Market Overview, by Alloy Type
7.1.1. Global Secondary Aluminum Alloy Market Revenue Share, By Alloy Type, 2022 Vs 2030 (in %)
7.2. Wrought Alloys
7.2.1. Global Secondary Aluminum Alloy Market, By Region, 2017-2030 (US$ Bn)
7.3. Case Alloys
7.3.1. Global Secondary Aluminum Alloy Market, By Region, 2017-2030 (US$ Bn)

8. Global Secondary Aluminum Alloy Market, By Strength
8.1. Global Secondary Aluminum Alloy Market Overview, by Strength
8.1.1. Global Secondary Aluminum Alloy Market Revenue Share, By Strength, 2022 Vs 2030 (in %)
8.2. Low Strength
8.2.1. Global Secondary Aluminum Alloy Market, By Region, 2017-2030 (US$ Bn)
8.3. High Strength
8.3.1. Global Secondary Aluminum Alloy Market, By Region, 2017-2030 (US$ Bn)
8.4. Ultra-High Strength Aluminum Alloy
8.4.1. Global Secondary Aluminum Alloy Market, By Region, 2017-2030 (US$ Bn)

9. Global Secondary Aluminum Alloy Market, By Application
9.1. Global Secondary Aluminum Alloy Market Overview, By Application
9.1.1. Global Secondary Aluminum Alloy Market Revenue Share, By Application, 2022 Vs 2030 (in %)
9.2. Building & Construction
9.2.1. Global Secondary Aluminum Alloy Market, By Region, 2017-2030 (US$ Bn)
9.3. Automotive
9.3.1. Global Secondary Aluminum Alloy Market, By Region, 2017-2030 (US$ Bn)
9.4. Aluminum Cans
9.4.1. Global Secondary Aluminum Alloy Market, By Region, 2017-2030 (US$ Bn)
9.5. Others
9.5.1. Global Secondary Aluminum Alloy Market, By Region, 2017-2030 (US$ Bn)

10. Global Secondary Aluminum Alloy Market, By Region
10.1. Global Secondary Aluminum Alloy Market Overview, by Region
10.1.1. Global Secondary Aluminum Alloy Market, By Region, 2022 vs 2030 (in%)
10.2. Alloy Type
10.2.1. Global Secondary Aluminum Alloy Market, By Alloy Type, 2017-2030 (US$ Bn)
10.3. Strength
10.3.1. Global Secondary Aluminum Alloy Market, By Strength, 2017-2030 (US$ Bn)
10.4. Application
10.4.1. Global Secondary Aluminum Alloy Market, By Application, 2017-2030 (US$ Bn)

11. North America Secondary Aluminum Alloy Market Analysis
11.1. North America Secondary Aluminum Alloy Market, by Alloy Type, 2017-2030(US$ Bn)
11.1.1. Overview
11.1.2. SRC Analysis
11.2. North America Secondary Aluminum Alloy Market, by Strength, 2017-2030(US$ Bn)
11.2.1. Overview
11.2.2. SRC Analysis
11.3. North America Secondary Aluminum Alloy Market, By Application, 2017-2030(US$ Bn)
11.3.1. Overview
11.3.2. SRC Analysis
11.4. North America Secondary Aluminum Alloy Market, by Country, 2017-2030 (US$ Bn)
11.4.1. North America Secondary Aluminum Alloy Market, by Country, 2022 Vs 2030 (in%)
11.4.2. U.S.
11.4.2.1. U.S. Secondary Aluminum Alloy Market Estimates and Forecast, 2017-2030 (US$ Bn)
11.4.2.2. U.S. Secondary Aluminum Alloy, By Alloy Type, 2017-2030 (US$ Bn)
11.4.2.3. U.S. Secondary Aluminum Alloy, By Strength, 2017-2030 (US$ Bn)
11.4.2.4. U.S. Secondary Aluminum Alloy, By Application, 2017-2030 (US$ Bn)
11.4.3. Canada
11.4.3.1. Canada Secondary Aluminum Alloy Market Estimates and Forecast, 2017-2030 (US$ Bn)
11.4.3.2. Canada Secondary Aluminum Alloy, By Alloy Type, 2017-2030 (US$ Bn)
11.4.3.3. Canada Secondary Aluminum Alloy, By Strength Type, 2017-2030 (US$ Bn)
11.4.3.4. Canada Secondary Aluminum Alloy, By Application, 2017-2030 (US$ Bn)
11.4.4. Mexico
11.4.4.1. Mexico Secondary Aluminum Alloy Market Estimates and Forecast, 2017-2030 (US$ Bn)
11.4.4.2. Mexico Secondary Aluminum Alloy, By Alloy Type, 2017-2030 (US$ Bn)
11.4.4.3. Mexico Secondary Aluminum Alloy, By Strength, 2017-2030 (US$ Bn)
11.4.4.4. Mexico Secondary Aluminum Alloy, By Application, 2017-2030 (US$ Bn)

12. Europe Secondary Aluminum Alloy Market Analysis
12.1. Europe Secondary Aluminum Alloy Market, by Alloy Type, 2017-2030(US$ Bn)
12.1.1. Overview
12.1.2. SRC Analysis
12.2. Europe Secondary Aluminum Alloy Market, by Strength, 2017-2030(US$ Bn)
12.2.1. Overview
12.2.2. SRC Analysis
12.3. Europe Secondary Aluminum Alloy Market, By Application, 2017-2030(US$ Bn)
12.3.1. Overview
12.3.2. SRC Analysis
12.4. Europe Secondary Aluminum Alloy Market, by Country, 2017-2030 (US$ Bn)
12.4.1. Europe Secondary Aluminum Alloy Market, by Country, 2022 Vs 2030 (in%)
12.4.2. Germany
12.4.2.1. Germany Secondary Aluminum Alloy Market Estimates and Forecast, 2017-2030 (US$ Bn)
12.4.2.2. Germany Secondary Aluminum Alloy, By Alloy Type, 2017-2030 (US$ Bn)
12.4.2.3. Germany Secondary Aluminum Alloy, By Strength, 2017-2030 (US$ Bn)
12.4.2.4. Germany Secondary Aluminum Alloy, By Application, 2017-2030 (US$ Bn)
12.4.3. France
12.4.3.1. France Secondary Aluminum Alloy Market Estimates and Forecast, 2017-2030 (US$ Bn)
12.4.3.2. France Secondary Aluminum Alloy, By Alloy Type, 2017-2030 (US$ Bn)
12.4.3.3. France Secondary Aluminum Alloy, By Strength, 2017-2030 (US$ Bn)
12.4.3.4. France Secondary Aluminum Alloy, By Application, 2017-2030 (US$ Bn)
12.4.4. UK
12.4.4.1. UK Secondary Aluminum Alloy Market Estimates and Forecast, 2017-2030 (US$ Bn)
12.4.4.2. UK Secondary Aluminum Alloy, By Alloy Type, 2017-2030 (US$ Bn)
12.4.4.3. UK Secondary Aluminum Alloy, By Strength, 2017-2030 (US$ Bn)
12.4.4.4. UK Secondary Aluminum Alloy, By Application, 2017-2030 (US$ Bn)
12.4.5. Italy
12.4.5.1. Italy Secondary Aluminum Alloy Market Estimates and Forecast, 2017-2030 (US$ Bn)
12.4.5.2. Italy Secondary Aluminum Alloy, By Alloy Type, 2017-2030 (US$ Bn)
12.4.5.3. Italy Secondary Aluminum Alloy, By Strength, 2017-2030 (US$ Bn)
12.4.5.4. Italy Secondary Aluminum Alloy, By Application, 2017-2030 (US$ Bn)
12.4.6. Spain
12.4.6.1. Spain Secondary Aluminum Alloy Market Estimates and Forecast, 2017-2030 (US$ Bn)
12.4.6.2. Spain Secondary Aluminum Alloy, By Alloy Type, 2017-2030 (US$ Bn)
12.4.6.3. Spain Secondary Aluminum Alloy, By Strength, 2017-2030 (US$ Bn)
12.4.6.4. Spain Secondary Aluminum Alloy, By Application, 2017-2030 (US$ Bn)
12.4.7. Rest of Europe
12.4.7.1. Rest of Europe Secondary Aluminum Alloy Market Estimates and Forecast, 2017-2030 (US$ Bn)
12.4.7.2. Rest of Europe Secondary Aluminum Alloy, By Alloy Type, 2017-2030 (US$ Bn)
12.4.7.3. Rest of Europe Secondary Aluminum Alloy, By Strength, 2017-2030 (US$ Bn)
12.4.7.4. Rest of Europe Secondary Aluminum Alloy, By Application, 2017-2030 (US$ Bn)

13. Asia Pacific Secondary Aluminum Alloy Market Analysis
13.1. Asia Pacific Secondary Aluminum Alloy Market, by Alloy Type, 2017-2030(US$ Bn)
13.1.1. Overview
13.1.2. SRC Analysis
13.2. Asia Pacific Secondary Aluminum Alloy Market, by Strength, 2017-2030(US$ Bn)
13.2.1. Overview
13.2.2. SRC Analysis
13.3. Asia Pacific Secondary Aluminum Alloy Market, By Application, 2017-2030(US$ Bn)
13.3.1. Overview
13.3.2. SRC Analysis
13.4. Asia Pacific Secondary Aluminum Alloy Market, by Country, 2017-2030 (US$ Bn)
13.4.1. Asia Pacific Secondary Aluminum Alloy Market, by Country, 2022 Vs 2030 (in%)
13.4.2. China
13.4.2.1. China Secondary Aluminum Alloy Market Estimates and Forecast, 2017-2030 (US$ Bn)
13.4.2.2. China Secondary Aluminum Alloy, By Alloy Type, 2017-2030 (US$ Bn)
13.4.2.3. China Secondary Aluminum Alloy, By Strength, 2017-2030 (US$ Bn)
13.4.2.4. China Secondary Aluminum Alloy, By Application, 2017-2030 (US$ Bn)
13.4.3. Japan
13.4.3.1. Japan Secondary Aluminum Alloy Market Estimates and Forecast, 2017-2030 (US$ Bn)
13.4.3.2. Japan Secondary Aluminum Alloy, By Alloy Type, 2017-2030 (US$ Bn)
13.4.3.3. Japan Secondary Aluminum Alloy, By Strength, 2017-2030 (US$ Bn)
13.4.3.4. Japan Secondary Aluminum Alloy, By Application, 2017-2030 (US$ Bn)
13.4.4. India
13.4.4.1. India Secondary Aluminum Alloy Market Estimates and Forecast, 2017-2030 (US$ Bn)
13.4.4.2. India Secondary Aluminum Alloy, By Alloy Type, 2017-2030 (US$ Bn)
13.4.4.3. India Secondary Aluminum Alloy, By Strength, 2017-2030 (US$ Bn)
13.4.4.4. India Secondary Aluminum Alloy, By Application, 2017-2030 (US$ Bn)
13.4.5. South Korea
13.4.5.1. South Korea Secondary Aluminum Alloy Market Estimates and Forecast, 2017-2030 (US$ Bn)
13.4.5.2. South Korea Secondary Aluminum Alloy, By Alloy Type, 2017-2030 (US$ Bn)
13.4.5.3. South Korea Secondary Aluminum Alloy, By Strength, 2017-2030 (US$ Bn)
13.4.5.4. South Korea Secondary Aluminum Alloy, By Application, 2017-2030 (US$ Bn)
13.4.6. South-East Asia
13.4.6.1. South-East Asia Secondary Aluminum Alloy Market Estimates and Forecast, 2017-2030 (US$ Bn)
13.4.6.2. South-East Asia Secondary Aluminum Alloy, By Alloy Type, 2017-2030 (US$ Bn)
13.4.6.3. South-East Asia Secondary Aluminum Alloy, By Strength, 2017-2030 (US$ Bn)
13.4.6.4. South-East Asia Secondary Aluminum Alloy, By Application, 2017-2030 (US$ Bn)
13.4.7. Rest of Asia Pacific
13.4.7.1. Rest of Asia Pacific Secondary Aluminum Alloy Market Estimates and Forecast, 2017-2030 (US$ Bn)
13.4.7.2. Rest of Asia Pacific Secondary Aluminum Alloy, By Alloy Type, 2017-2030 (US$ Bn)
13.4.7.3. Rest of Asia Pacific Secondary Aluminum Alloy, By Strength, 2017-2030 (US$ Bn)
13.4.7.4. Rest of Asia Pacific Secondary Aluminum Alloy, By Application, 2017-2030 (US$ Bn)

14. Latin America Secondary Aluminum Alloy Market Analysis
14.1. Latin America Secondary Aluminum Alloy Market, by Alloy Type, 2017-2030(US$ Bn)
14.1.1. Overview
14.1.2. SRC Analysis
14.2. Latin America Secondary Aluminum Alloy Market, by Strength, 2017-2030(US$ Bn)
14.2.1. Overview
14.2.2. SRC Analysis
14.3. Latin America Secondary Aluminum Alloy Market, By Application, 2017-2030(US$ Bn)
14.3.1. Overview
14.3.2. SRC Analysis
14.4. Latin America Secondary Aluminum Alloy Market, by Country, 2017-2030 (US$ Bn)
14.4.1. Latin America Secondary Aluminum Alloy Market, by Country, 2022 Vs 2030 (in%)
14.4.2. Brazil
14.4.2.1. Brazil Secondary Aluminum Alloy Market Estimates and Forecast, 2017-2030 (US$ Bn)
14.4.2.2. Brazil Secondary Aluminum Alloy, By Alloy Type, 2017-2030 (US$ Bn)
14.4.2.3. Brazil Secondary Aluminum Alloy, By Strength, 2017-2030 (US$ Bn)
14.4.2.4. Brazil Secondary Aluminum Alloy, By Application, 2017-2030 (US$ Bn)
14.4.3. Argentina
14.4.3.1. Argentina Secondary Aluminum Alloy Market Estimates and Forecast, 2017-2030 (US$ Bn)
14.4.3.2. Argentina Secondary Aluminum Alloy, By Alloy Type, 2017-2030 (US$ Bn)
14.4.3.3. Argentina Secondary Aluminum Alloy, By Strength, 2017-2030 (US$ Bn)
14.4.3.4. Argentina Secondary Aluminum Alloy, By Application, 2017-2030 (US$ Bn)
14.4.4. Rest of Latin America
14.4.4.1. Rest of Latin America Secondary Aluminum Alloy Market Estimates and Forecast, 2017-2030 (US$ Bn)
14.4.4.2. Rest of Latin America Secondary Aluminum Alloy, By Alloy Type, 2017-2030 (US$ Bn)
14.4.4.3. Rest of Latin America Secondary Aluminum Alloy, By Strength, 2017-2030 (US$ Bn)
14.4.4.4. Rest of Latin America Secondary Aluminum Alloy, By Application, 2017-2030 (US$ Bn)

15. Middle East and Africa Secondary Aluminum Alloy Market Analysis
15.1. Middle East and Africa Secondary Aluminum Alloy Market, by Alloy Type, 2017-2030(US$ Bn)
15.1.1. Overview
15.1.2. SRC Analysis
15.2. Middle East and Africa Secondary Aluminum Alloy Market, by Strength, 2017-2030(US$ Bn)
15.2.1. Overview
15.2.2. SRC Analysis
15.3. Middle East and Africa Secondary Aluminum Alloy Market, By Application, 2017-2030(US$ Bn)
15.3.1. Overview
15.3.2. SRC Analysis
15.4. Middle East and Africa Secondary Aluminum Alloy Market, by Country, 2017-2030 (US$ Bn)
15.4.1. Middle East and Africa Secondary Aluminum Alloy Market, by Country, 2022 Vs 2030 (in%)
15.4.2. GCC Countries
15.4.2.1. GCC Countries Secondary Aluminum Alloy Market Estimates and Forecast, 2017-2030 (US$ Bn)
15.4.2.2. GCC Countries Secondary Aluminum Alloy, By Alloy Type, 2017-2030 (US$ Bn)
15.4.2.3. GCC Countries Secondary Aluminum Alloy, By Strength, 2017-2030 (US$ Bn)
15.4.2.4. GCC Countries Secondary Aluminum Alloy, By Application, 2017-2030 (US$ Bn)
15.4.3. South Africa
15.4.3.1. South Africa Secondary Aluminum Alloy Market Estimates and Forecast, 2017-2030 (US$ Bn)
15.4.3.2. South Africa Secondary Aluminum Alloy, By Alloy Type, 2017-2030 (US$ Bn)
15.4.3.3. South Africa Secondary Aluminum Alloy, By Strength, 2017-2030 (US$ Bn)
15.4.3.4. South Africa Secondary Aluminum Alloy, By Application, 2017-2030 (US$ Bn)
15.4.4. Rest of Middle East and Africa
15.4.4.1. Rest of Middle East and Africa Secondary Aluminum Alloy Market Estimates and Forecast, 2017-2030 (US$ Bn)
15.4.4.2. Rest of Middle East and Africa Secondary Aluminum Alloy, By Alloy Type, 2017-2030 (US$ Bn)
15.4.4.3. Rest of Middle East and Africa Secondary Aluminum Alloy, By Strength, 2017-2030 (US$ Bn)
15.4.4.4. Rest of Middle East and Africa Secondary Aluminum Alloy, By Application, 2017-2030 (US$ Bn)

16. Company Profiles
16.1. Robert Boash GmbH
16.1.1. Company Overview
16.1.2. Product /Services Portfolio
16.1.3. Geographical Presence
16.1.4. Financial Summary
16.1.4.1. Market Revenue and Net Profit (2019-2022)
16.1.4.2. Business Segment Revenue Analysis
16.1.4.3. Geographical Revenue Analysis
16.2. Conagra Brands, Inc.
16.3. ChargePoint, Inc.
16.4. Shanghai Zencar Industry Co. Ltd
16.5. Pod Point
16.6. Eaton Corporation plc
16.7. Siemens AG
16.8. ABB Group
16.9. Schneider Electric
16.10. Tesla Inc.
16.11. Delphi Automotive
16.12. Signet Electronic Systems
16.13. Aptiv PLC

List of Figures
FIG. 1 Global Secondary Aluminum Alloy Market: Research Methodology
FIG. 2 Market Size Estimation – Top Down & Bottom up Approach
FIG. 3 Global Secondary Aluminum Alloy Market Segmentation
FIG. 4 Global Secondary Aluminum Alloy Market, by Alloy Type, 2022 (US$ Bn)
FIG. 5 Global Secondary Aluminum Alloy Market, by Strength, 2022 (US$ Bn)
FIG. 6 Global Secondary Aluminum Alloy Market, By Application, 2022 (US$ Bn)
FIG. 7 Global Secondary Aluminum Alloy Market, by Geography, 2022 (US$ Bn)
FIG. 8 Attractive Investment Proposition, by Alloy Type, 2022
FIG. 9 Attractive Investment Proposition, by Strength, 2022
FIG. 10 Attractive Investment Proposition, By Application, 2022
FIG. 11 Attractive Investment Proposition, by Geography, 2022
FIG. 12 Global Market Share Analysis of Key Secondary Aluminum Alloy Market Manufacturers, 2022
FIG. 13 Global Market Positioning of Key Secondary Aluminum Alloy Market Manufacturers, 2022
FIG. 14 Global Secondary Aluminum Alloy Market Value Contribution, By Alloy Type, 2022 & 2030 (Value %)
FIG. 15 Global Secondary Aluminum Alloy Market, by Wrought Alloys, Value, 2017-2030 (US$ Bn)
FIG. 16 Global Secondary Aluminum Alloy Market, by Case Alloys, Value, 2017-2030 (US$ Bn)
FIG. 17 Global Secondary Aluminum Alloy Market Value Contribution, By Strength, 2022 & 2030 (Value %)
FIG. 18 Global Secondary Aluminum Alloy Market, by Low Strength, Value, 2017-2030 (US$ Bn)
FIG. 19 Global Secondary Aluminum Alloy Market, by High Strength, Value, 2017-2030 (US$ Bn)
FIG. 20 Global Secondary Aluminum Alloy Market, by Ultra-High Strength Aluminum Alloy, Value, 2017-2030 (US$ Bn)
FIG. 21 Global Secondary Aluminum Alloy Market Value Contribution, By Application, 2022 & 2030 (Value %)
FIG. 22 Global Secondary Aluminum Alloy Market, by Building & Construction, Value, 2017-2030 (US$ Bn)
FIG. 23 Global Secondary Aluminum Alloy Market, by Automotive, Value, 2017-2030 (US$ Bn)
FIG. 24 Global Secondary Aluminum Alloy Market, by Aluminum Cans, Value, 2017-2030 (US$ Bn)
FIG. 25 Global Secondary Aluminum Alloy Market, by Others, Value, 2017-2030 (US$ Bn)
FIG. 26 Global Secondary Aluminum Alloy Market, by Aftermarket, 2017-2030 (US$ Bn)
FIG. 27 North America Secondary Aluminum Alloy Market, 2017-2030 (US$ Bn)
FIG. 28 U.S. Secondary Aluminum Alloy Market, 2017-2030 (US$ Bn)
FIG. 29 Canada Secondary Aluminum Alloy Market, 2017-2030 (US$ Bn)
FIG. 30 Europe Secondary Aluminum Alloy Market, 2017-2030 (US$ Bn)
FIG. 31 Germany Secondary Aluminum Alloy Market, 2017-2030 (US$ Bn)
FIG. 32 France Secondary Aluminum Alloy Market, 2017-2030 (US$ Bn)
FIG. 33 U.K. Secondary Aluminum Alloy Market, 2017-2030 (US$ Bn)
FIG. 34 Italy Secondary Aluminum Alloy Market, 2017-2030 (US$ Bn)
FIG. 35 Spain Secondary Aluminum Alloy Market, 2017-2030 (US$ Bn)
FIG. 36 Rest of Europe Secondary Aluminum Alloy Market, 2017-2030 (US$ Bn)
FIG. 37 Asia Pacific Secondary Aluminum Alloy Market, 2017-2030 (US$ Bn)
FIG. 38 China Secondary Aluminum Alloy Market, 2017-2030 (US$ Bn)
FIG. 39 Japan Secondary Aluminum Alloy Market, 2017-2030 (US$ Bn)
FIG. 40 India Secondary Aluminum Alloy Market, 2017-2030 (US$ Bn)
FIG. 41 South Korea Secondary Aluminum Alloy Market, 2017-2030 (US$ Bn)
FIG. 42 South-East Asia Secondary Aluminum Alloy Market, 2017-2030 (US$ Bn)
FIG. 43 Rest of Asia Pacific Secondary Aluminum Alloy Market, 2017-2030 (US$ Bn)
FIG. 44 Latin America Secondary Aluminum Alloy Market, 2017-2030 (US$ Bn)
FIG. 45 Brazil Secondary Aluminum Alloy Market, 2017-2030 (US$ Bn)
FIG. 46 Mexico Secondary Aluminum Alloy Market, 2017-2030 (US$ Bn)
FIG. 47 Rest of Latin America Secondary Aluminum Alloy Market, 2017-2030 (US$ Bn)
FIG. 48 Middle East & Africa Secondary Aluminum Alloy Market, 2017-2030 (US$ Bn)
FIG. 49 GCC Countries Secondary Aluminum Alloy Market, 2017-2030 (US$ Bn)
FIG. 50 South Africa Secondary Aluminum Alloy Market, 2017-2030 (US$ Bn)
FIG. 51 Rest of Middle East and Africa Secondary Aluminum Alloy Market, 2017-2030 (US$ Bn)

List of Tables
TABLE 1 Market Snapshot: Global Secondary Aluminum Alloy Market
TABLE 2 Global Secondary Aluminum Alloy Market: Market Drivers Impact Analysis
TABLE 3 Global Secondary Aluminum Alloy Market: Market Restraints Impact Analysis
TABLE 4 Global Secondary Aluminum Alloy Market, by Competitive Benchmarking, 2022
TABLE 5 Global Secondary Aluminum Alloy Market, by Geographical Presence Analysis, 2022
TABLE 6 Global Secondary Aluminum Alloy Market, by Key Strategies Analysis, 2022
TABLE 7 Global Secondary Aluminum Alloy Market, by Wrought Alloys, By Region, 2017-2022 (US$ Bn)
TABLE 8 Global Secondary Aluminum Alloy Market, by Wrought Alloys, By Region, 2023-2030 (US$ Bn)
TABLE 9 Global Secondary Aluminum Alloy Market, by Case Alloys, By Region, 2017-2022 (US$ Bn)
TABLE 10 Global Secondary Aluminum Alloy Market, by Case Alloys, By Region, 2023-2030 (US$ Bn)
TABLE 11 Global Secondary Aluminum Alloy Market, by Low Strength, By Region, 2017-2022 (US$ Bn)
TABLE 12 Global Secondary Aluminum Alloy Market, by Low Strength, By Region, 2023-2030 (US$ Bn)
TABLE 13 Global Secondary Aluminum Alloy Market, by High Strength, By Region, 2017-2022 (US$ Bn)
TABLE 14 Global Secondary Aluminum Alloy Market, by High Strength, By Region, 2023-2030 (US$ Bn)
TABLE 15 Global Secondary Aluminum Alloy Market, by Ultra-High Strength Aluminum Alloy, By Region, 2017-2022 (US$ Bn)
TABLE 16 Global Secondary Aluminum Alloy Market, by Ultra-High Strength Aluminum Alloy, By Region, 2023-2030 (US$ Bn)
TABLE 17 Global Secondary Aluminum Alloy Market, by Building & Construction, By Region, 2017-2022 (US$ Bn)
TABLE 18 Global Secondary Aluminum Alloy Market, by Building & Construction, By Region, 2023-2030 (US$ Bn)
TABLE 19 Global Secondary Aluminum Alloy Market, by Automotive, By Region, 2017-2022 (US$ Bn)
TABLE 20 Global Secondary Aluminum Alloy Market, by Automotive, By Region, 2023-2030 (US$ Bn)
TABLE 21 Global Secondary Aluminum Alloy Market, by Aluminum Cans, By Region, 2017-2022 (US$ Bn)
TABLE 22 Global Secondary Aluminum Alloy Market, by Aluminum Cans, By Region, 2023-2030 (US$ Bn)
TABLE 23 Global Secondary Aluminum Alloy Market, by Others, By Region, 2017-2022 (US$ Bn)
TABLE 24 Global Secondary Aluminum Alloy Market, by Others, By Region, 2023-2030 (US$ Bn)
TABLE 25 Global Secondary Aluminum Alloy Market, by Aftermarket, By Region, 2017-2022 (US$ Bn)
TABLE 26 Global Secondary Aluminum Alloy Market, by Aftermarket, By Region, 2023-2030 (US$ Bn)
TABLE 27 Global Secondary Aluminum Alloy Market, by Alloy Type, 2017-2022 (US$ Bn)
TABLE 28 Global Secondary Aluminum Alloy Market, by Strength, 2023-2030 (US$ Bn)
TABLE 29 Global Secondary Aluminum Alloy Market, By Application, 2023-2030 (US$ Bn)
TABLE 30 Global Secondary Aluminum Alloy Market, by Region, 2017-2022 (US$ Bn)
TABLE 31 Global Secondary Aluminum Alloy Market, by Region, 2023-2030 (US$ Bn)
TABLE 32 North America Secondary Aluminum Alloy Market, by Alloy Type, 2017-2022 (US$ Bn)
TABLE 33 North America Secondary Aluminum Alloy Market, by Alloy Type, 2023-2030 (US$ Bn)
TABLE 34 North America Secondary Aluminum Alloy Market, by Strength, 2017-2022 (US$ Bn)
TABLE 35 North America Secondary Aluminum Alloy Market, by Strength, 2023-2030 (US$ Bn)
TABLE 36 North America Secondary Aluminum Alloy Market, By Application, 2017-2022 (US$ Bn)
TABLE 37 North America Secondary Aluminum Alloy Market, By Application, 2023-2030 (US$ Bn)
TABLE 38 North America Secondary Aluminum Alloy Market, by Country, 2017-2022 (US$ Bn)
TABLE 39 North America Secondary Aluminum Alloy Market, by Country, 2023-2030 (US$ Bn)
TABLE 40 United States Secondary Aluminum Alloy Market, by Alloy Type, 2017-2022 (US$ Bn)
TABLE 41 United States Secondary Aluminum Alloy Market, by Alloy Type, 2023-2030 (US$ Bn)
TABLE 42 United States Secondary Aluminum Alloy Market, by Strength, 2017-2022 (US$ Bn)
TABLE 43 United States Secondary Aluminum Alloy Market, by Strength, 2023-2030 (US$ Bn)
TABLE 44 United States Secondary Aluminum Alloy Market, By Application, 2017-2022 (US$ Bn)
TABLE 45 United States Secondary Aluminum Alloy Market, By Application, 2023-2030 (US$ Bn)
TABLE 46 Canada Secondary Aluminum Alloy Market, by Alloy Type, 2017-2022 (US$ Bn)
TABLE 47 Canada Secondary Aluminum Alloy Market, by Alloy Type, 2023-2030 (US$ Bn)
TABLE 48 Canada Secondary Aluminum Alloy Market, by Strength, 2017-2022 (US$ Bn)
TABLE 49 Canada Secondary Aluminum Alloy Market, by Strength, 2023-2030 (US$ Bn)
TABLE 50 Canada Secondary Aluminum Alloy Market, By Application, 2017-2022 (US$ Bn)
TABLE 51 Canada Secondary Aluminum Alloy Market, By Application, 2023-2030 (US$ Bn)
TABLE 52 Mexico Secondary Aluminum Alloy Market, by Alloy Type, 2017-2022 (US$ Bn)
TABLE 53 Mexico Secondary Aluminum Alloy Market, by Alloy Type, 2023-2030 (US$ Bn)
TABLE 54 Mexico Secondary Aluminum Alloy Market, by Strength, 2017-2022 (US$ Bn)
TABLE 55 Mexico Secondary Aluminum Alloy Market, by Strength, 2023-2030 (US$ Bn)
TABLE 56 Mexico Secondary Aluminum Alloy Market, By Application, 2017-2022 (US$ Bn)
TABLE 57 Mexico Secondary Aluminum Alloy Market, By Application, 2023-2030 (US$ Bn)
TABLE 58 Europe Secondary Aluminum Alloy Market, by Alloy Type, 2017-2022 (US$ Bn)
TABLE 59 Europe Secondary Aluminum Alloy Market, by Alloy Type, 2023-2030 (US$ Bn)
TABLE 60 Europe Secondary Aluminum Alloy Market, by Strength, 2017-2022 (US$ Bn)
TABLE 61 Europe Secondary Aluminum Alloy Market, by Strength, 2023-2030 (US$ Bn)
TABLE 62 Europe Secondary Aluminum Alloy Market, By Application, 2017-2022 (US$ Bn)
TABLE 63 Europe Secondary Aluminum Alloy Market, By Application, 2023-2030 (US$ Bn)
TABLE 64 Europe Secondary Aluminum Alloy Market, by Country, 2017-2022 (US$ Bn)
TABLE 65 Europe Secondary Aluminum Alloy Market, by Country, 2023-2030 (US$ Bn)
TABLE 66 Germany Secondary Aluminum Alloy Market, by Alloy Type, 2017-2022 (US$ Bn)
TABLE 67 Germany Secondary Aluminum Alloy Market, by Alloy Type, 2023-2030 (US$ Bn)
TABLE 68 Germany Secondary Aluminum Alloy Market, by Strength, 2017-2022 (US$ Bn)
TABLE 69 Germany Secondary Aluminum Alloy Market, by Strength, 2023-2030 (US$ Bn)
TABLE 70 Germany Secondary Aluminum Alloy Market, By Application, 2017-2022 (US$ Bn)
TABLE 71 Germany Secondary Aluminum Alloy Market, By Application, 2023-2030 (US$ Bn)
TABLE 72 France Secondary Aluminum Alloy Market, by Alloy Type, 2017-2022 (US$ Bn)
TABLE 73 France Secondary Aluminum Alloy Market, by Alloy Type, 2023-2030 (US$ Bn)
TABLE 74 France Secondary Aluminum Alloy Market, by Strength, 2017-2022 (US$ Bn)
TABLE 75 France Secondary Aluminum Alloy Market, by Strength, 2023-2030 (US$ Bn)
TABLE 76 France Secondary Aluminum Alloy Market, By Application, 2017-2022 (US$ Bn)
TABLE 77 France Secondary Aluminum Alloy Market, By Application, 2023-2030 (US$ Bn)
TABLE 78 United Kingdom Secondary Aluminum Alloy Market, by Alloy Type, 2017-2022 (US$ Bn)
TABLE 79 United Kingdom Secondary Aluminum Alloy Market, by Alloy Type, 2023-2030 (US$ Bn)
TABLE 80 United Kingdom Secondary Aluminum Alloy Market, by Strength, 2017-2022 (US$ Bn)
TABLE 81 United Kingdom Secondary Aluminum Alloy Market, by Strength, 2023-2030 (US$ Bn)
TABLE 82 United Kingdom Secondary Aluminum Alloy Market, By Application, 2017-2022 (US$ Bn)
TABLE 83 United Kingdom Secondary Aluminum Alloy Market, By Application, 2023-2030 (US$ Bn)
TABLE 84 Italy Secondary Aluminum Alloy Market, by Alloy Type, 2017-2022 (US$ Bn)
TABLE 85 Italy Secondary Aluminum Alloy Market, by Alloy Type, 2023-2030 (US$ Bn)
TABLE 86 Italy Secondary Aluminum Alloy Market, by Strength, 2017-2022 (US$ Bn)
TABLE 87 Italy Secondary Aluminum Alloy Market, by Strength, 2023-2030 (US$ Bn)
TABLE 88 Italy Secondary Aluminum Alloy Market, By Application, 2017-2022 (US$ Bn)
TABLE 89 Italy Secondary Aluminum Alloy Market, By Application, 2023-2030 (US$ Bn)
TABLE 90 Spain Secondary Aluminum Alloy Market, by Alloy Type, 2017-2022 (US$ Bn)
TABLE 91 Spain Secondary Aluminum Alloy Market, by Alloy Type, 2023-2030 (US$ Bn)
TABLE 92 Spain Secondary Aluminum Alloy Market, by Strength, 2017-2022 (US$ Bn)
TABLE 93 Spain Secondary Aluminum Alloy Market, by Strength, 2023-2030 (US$ Bn)
TABLE 94 Spain Secondary Aluminum Alloy Market, By Application, 2017-2022 (US$ Bn)
TABLE 95 Spain Secondary Aluminum Alloy Market, By Application, 2023-2030 (US$ Bn)
TABLE 96 Rest of Europe Secondary Aluminum Alloy Market, by Alloy Type, 2017-2022 (US$ Bn)
TABLE 97 Rest of Europe Secondary Aluminum Alloy Market, by Alloy Type, 2023-2030 (US$ Bn)
TABLE 98 Rest of Europe Secondary Aluminum Alloy Market, by Strength, 2017-2022 (US$ Bn)
TABLE 99 Rest of Europe Secondary Aluminum Alloy Market, by Strength, 2023-2030 (US$ Bn)
TABLE 100 Rest of Europe Secondary Aluminum Alloy Market, By Application, 2017-2022 (US$ Bn)
TABLE 101 Rest of Europe Secondary Aluminum Alloy Market, By Application, 2023-2030 (US$ Bn)
TABLE 102 Asia Pacific Secondary Aluminum Alloy Market, by Alloy Type, 2017-2022 (US$ Bn)
TABLE 103 Asia Pacific Secondary Aluminum Alloy Market, by Strength, 2023-2030 (US$ Bn)
TABLE 104 Asia Pacific Secondary Aluminum Alloy Market, by Strength, 2017-2022 (US$ Bn)
TABLE 105 Asia Pacific Secondary Aluminum Alloy Market, by Strength, 2023-2030 (US$ Bn)
TABLE 106 Asia Pacific Secondary Aluminum Alloy Market, By Application, 2017-2022 (US$ Bn)
TABLE 107 Asia Pacific Secondary Aluminum Alloy Market, By Application, 2023-2030 (US$ Bn)
TABLE 108 Asia Pacific Secondary Aluminum Alloy Market, by Country, 2017-2022 (US$ Bn)
TABLE 109 Asia Pacific Secondary Aluminum Alloy Market, by Country, 2023-2030 (US$ Bn)
TABLE 110 China Secondary Aluminum Alloy Market, by Alloy Type, 2017-2022 (US$ Bn)
TABLE 111 China Secondary Aluminum Alloy Market, by Alloy Type, 2023-2030 (US$ Bn)
TABLE 112 China Secondary Aluminum Alloy Market, by Strength, 2017-2022 (US$ Bn)
TABLE 113 China Secondary Aluminum Alloy Market, by Strength, 2023-2030 (US$ Bn)
TABLE 114 China Secondary Aluminum Alloy Market, By Application, 2017-2022 (US$ Bn)
TABLE 115 China Secondary Aluminum Alloy Market, By Application, 2023-2030 (US$ Bn)
TABLE 116 Japan Secondary Aluminum Alloy Market, by Alloy Type, 2017-2022 (US$ Bn)
TABLE 117 Japan Secondary Aluminum Alloy Market, by Alloy Type, 2023-2030 (US$ Bn)
TABLE 118 Japan Secondary Aluminum Alloy Market, by Strength, 2017-2022 (US$ Bn)
TABLE 119 Japan Secondary Aluminum Alloy Market, by Strength, 2023-2030 (US$ Bn)
TABLE 120 Japan Secondary Aluminum Alloy Market, By Application, 2017-2022 (US$ Bn)
TABLE 121 Japan Secondary Aluminum Alloy Market, By Application, 2023-2030 (US$ Bn)
TABLE 122 India Secondary Aluminum Alloy Market, by Alloy Type, 2017-2022 (US$ Bn)
TABLE 123 India Secondary Aluminum Alloy Market, by Alloy Type, 2023-2030 (US$ Bn)
TABLE 124 India Secondary Aluminum Alloy Market, by Strength, 2017-2022 (US$ Bn)
TABLE 125 India Secondary Aluminum Alloy Market, by Strength, 2023-2030 (US$ Bn)
TABLE 126 India Secondary Aluminum Alloy Market, By Application, 2017-2022 (US$ Bn)
TABLE 127 India Secondary Aluminum Alloy Market, By Application, 2023-2030 (US$ Bn)
TABLE 128 South Korea Secondary Aluminum Alloy Market, by Alloy Type, 2017-2022 (US$ Bn)
TABLE 129 South Korea Secondary Aluminum Alloy Market, by Alloy Type, 2023-2030 (US$ Bn)
TABLE 130 South Korea Secondary Aluminum Alloy Market, by Strength, 2017-2022 (US$ Bn)
TABLE 131 South Korea Secondary Aluminum Alloy Market, by Strength, 2023-2030 (US$ Bn)
TABLE 132 South Korea Secondary Aluminum Alloy Market, By Application, 2017-2022 (US$ Bn)
TABLE 133 South Korea Secondary Aluminum Alloy Market, By Application, 2023-2030 (US$ Bn)
TABLE 134 South-East Asia Secondary Aluminum Alloy Market, by Alloy Type, 2017-2022 (US$ Bn)
TABLE 135 South-East Asia Secondary Aluminum Alloy Market, by Alloy Type, 2023-2030 (US$ Bn)
TABLE 136 South-East Asia Secondary Aluminum Alloy Market, by Strength, 2017-2022 (US$ Bn)
TABLE 137 South-East Asia Secondary Aluminum Alloy Market, by Strength, 2023-2030 (US$ Bn)
TABLE 138 South-East Asia Secondary Aluminum Alloy Market, By Application, 2017-2022 (US$ Bn)
TABLE 139 South-East Asia Secondary Aluminum Alloy Market, By Application, 2023-2030 (US$ Bn)
TABLE 140 Rest of Asia Pacific Secondary Aluminum Alloy Market, by Alloy Type, 2017-2022 (US$ Bn)
TABLE 141 Rest of Asia Pacific Secondary Aluminum Alloy Market, by Alloy Type, 2023-2030 (US$ Bn)
TABLE 142 Rest of Asia Pacific Secondary Aluminum Alloy Market, by Strength, 2017-2022 (US$ Bn)
TABLE 143 Rest of Asia Pacific Secondary Aluminum Alloy Market, by Strength, 2023-2030 (US$ Bn)
TABLE 144 Rest of Asia Pacific Secondary Aluminum Alloy Market, By Application, 2017-2022 (US$ Bn)
TABLE 145 Rest of Asia Pacific Secondary Aluminum Alloy Market, By Application, 2023-2030 (US$ Bn)
TABLE 146 Latin America Secondary Aluminum Alloy Market, by Alloy Type, 2017-2022 (US$ Bn)
TABLE 147 Latin America Secondary Aluminum Alloy Market, by Alloy Type, 2023-2030 (US$ Bn)
TABLE 148 Latin America Secondary Aluminum Alloy Market, by Strength, 2017-2022 (US$ Bn)
TABLE 149 Latin America Secondary Aluminum Alloy Market, by Strength, 2023-2030 (US$ Bn)
TABLE 150 Latin America Secondary Aluminum Alloy Market, By Application, 2017-2022 (US$ Bn)
TABLE 151 Latin America Secondary Aluminum Alloy Market, By Application, 2023-2030 (US$ Bn)
TABLE 152 Latin America Secondary Aluminum Alloy Market, by Country, 2017-2022 (US$ Bn)
TABLE 153 Latin America Secondary Aluminum Alloy Market, by Country, 2023-2030 (US$ Bn)
TABLE 154 Brazil Secondary Aluminum Alloy Market, by Alloy Type, 2017-2022 (US$ Bn)
TABLE 155 Brazil Secondary Aluminum Alloy Market, by Alloy Type, 2023-2030 (US$ Bn)
TABLE 156 Brazil Secondary Aluminum Alloy Market, by Strength, 2017-2022 (US$ Bn)
TABLE 157 Brazil Secondary Aluminum Alloy Market, by Strength, 2023-2030 (US$ Bn)
TABLE 158 Brazil Secondary Aluminum Alloy Market, By Application, 2017-2022 (US$ Bn)
TABLE 159 Brazil Secondary Aluminum Alloy Market, By Application, 2023-2030 (US$ Bn)
TABLE 160 Argentina Secondary Aluminum Alloy Market, by Alloy Type, 2017-2022 (US$ Bn)
TABLE 161 Argentina Secondary Aluminum Alloy Market, by Alloy Type, 2023-2030 (US$ Bn)
TABLE 162 Argentina Secondary Aluminum Alloy Market, by Strength, 2017-2022 (US$ Bn)
TABLE 163 Argentina Secondary Aluminum Alloy Market, by Strength, 2023-2030 (US$ Bn)
TABLE 164 Argentina Secondary Aluminum Alloy Market, By Application, 2017-2022 (US$ Bn)
TABLE 165 Argentina Secondary Aluminum Alloy Market, By Application, 2023-2030 (US$ Bn)
TABLE 166 Rest of Latin America Secondary Aluminum Alloy Market, by Alloy Type, 2017-2022 (US$ Bn)
TABLE 167 Rest of Latin America Secondary Aluminum Alloy Market, by Alloy Type, 2023-2030 (US$ Bn)
TABLE 168 Rest of Latin America Secondary Aluminum Alloy Market, by Strength, 2017-2022 (US$ Bn)
TABLE 169 Rest of Latin America Secondary Aluminum Alloy Market, by Strength, 2023-2030 (US$ Bn)
TABLE 170 Rest of Latin America Secondary Aluminum Alloy Market, By Application, 2017-2022 (US$ Bn)
TABLE 171 Rest of Latin America Secondary Aluminum Alloy Market, By Application, 2023-2030 (US$ Bn)
TABLE 172 Middle East and Africa Secondary Aluminum Alloy Market, by Alloy Type, 2017-2022 (US$ Bn)
TABLE 173 Middle East and Africa Secondary Aluminum Alloy Market, by Alloy Type, 2023-2030 (US$ Bn)
TABLE 174 Middle East and Africa Secondary Aluminum Alloy Market, by Strength, 2017-2022 (US$ Bn)
TABLE 175 Middle East and Africa Secondary Aluminum Alloy Market, by Strength, 2023-2030 (US$ Bn)
TABLE 176 Middle East and Africa Secondary Aluminum Alloy Market, By Application, 2017-2022 (US$ Bn)
TABLE 177 Middle East and Africa Secondary Aluminum Alloy Market, By Application, 2023-2030 (US$ Bn)
TABLE 178 Middle East and Africa Secondary Aluminum Alloy Market, by Country, 2017-2022 (US$ Bn)
TABLE 179 Middle East and Africa Secondary Aluminum Alloy Market, by Country, 2023-2030 (US$ Bn)
TABLE 180 GCC Countries Secondary Aluminum Alloy Market, by Alloy Type, 2017-2022 (US$ Bn)
TABLE 181 GCC Countries Secondary Aluminum Alloy Market, by Alloy Type, 2023-2030 (US$ Bn)
TABLE 182 GCC Countries Secondary Aluminum Alloy Market, by Strength, 2017-2022 (US$ Bn)
TABLE 183 GCC Countries Secondary Aluminum Alloy Market, by Strength, 2023-2030 (US$ Bn)
TABLE 184 GCC Countries Secondary Aluminum Alloy Market, By Application, 2017-2022 (US$ Bn)
TABLE 185 GCC Countries Secondary Aluminum Alloy Market, By Application, 2023-2030 (US$ Bn)
TABLE 186 South Africa Secondary Aluminum Alloy Market, by Alloy Type, 2017-2022 (US$ Bn)
TABLE 187 South Africa Secondary Aluminum Alloy Market, by Alloy Type, 2023-2030 (US$ Bn)
TABLE 188 South Africa Secondary Aluminum Alloy Market, by Strength, 2017-2022 (US$ Bn)
TABLE 189 South Africa Secondary Aluminum Alloy Market, by Strength, 2023-2030 (US$ Bn)
TABLE 190 South Africa Secondary Aluminum Alloy Market, By Application, 2017-2022 (US$ Bn)
TABLE 191 South Africa Secondary Aluminum Alloy Market, By Application, 2023-2030 (US$ Bn)
TABLE 192 Rest of Middle East and Africa Secondary Aluminum Alloy Market, by Alloy Type, 2017-2022 (US$ Bn)
TABLE 193 Rest of Middle East and Africa Secondary Aluminum Alloy Market, by Alloy Type, 2023-2030 (US$ Bn)
TABLE 194 Rest of Middle East and Africa Secondary Aluminum Alloy Market, by Strength, 2017-2022 (US$ Bn)
TABLE 195 Rest of Middle East and Africa Secondary Aluminum Alloy Market, by Strength, 2023-2030 (US$ Bn)
TABLE 196 Rest of Middle East and Africa Secondary Aluminum Alloy Market, By Application, 2017-2022 (US$ Bn)
TABLE 197 Rest of Middle East and Africa Secondary Aluminum Alloy Market, By Application, 2023-2030 (US$ Bn)


Frequently Asked Questions

What is the current size of the global secondary aluminum alloy market?

The global Secondary Aluminum Alloys market was valued at USD 41.5 Billion in 2022.

What is the expected growth rate of the secondary aluminum alloy market between 2023 and 2030?

The Secondary Aluminum Alloys market is expected to grow at a CAGR of 3.90 % between 2023 and 2030, reaching USD 54.24 Billion in 2030.

Which alloy segment is leading the market share in terms of alloy type?

Wrought is the leading segment by alloy type, holding around half of the share in value in 2022.

Which strength type segment governs the demand for Secondary Aluminum Alloys in the world?

The high-strength segment governs the demand for secondary aluminum alloys worldwide, holding a massive share in 2022.

Which segment is expected to post the highest CAGR during the forecast period?

The ultra-high strength aluminum alloy segment is expected to post the highest CAGR during the forecast period.

Which region is fuelling the growth of the secondary aluminum alloy industry?

Europe is fuelling the growth of the secondary aluminum alloys industry, with a nearly two-fifth share in 2022.

Who are the major players in the global Secondary Aluminum Alloys market?

The top players include Century Metal Recycling Limited, Kawashima Co., Ltd., Daiki Aluminum Industry Co., Ltd., Allocco Recycling, Ltd., Superior Aluminum Alloys, LLC, Metal Exchange Corporation, and others

What is the major market driver of the secondary aluminum alloy industry?

The rapid growth of environmental awareness across the globe is the major market driver.

What are the major market restraints of the secondary aluminum alloy industry?

low availability and quality of secondary aluminum alloys are restraints of the secondary aluminum alloys industry.

What are the major market opportunities of the Secondary Aluminum Alloys industry?

Increasing demand for sustainable materials is an opportunity for the Secondary Aluminum Alloys industry.

Powder Coating Market

Published:
Report ID: 10783

Masterbatch Market

Published:
Report ID: 37059

Polycrystalline CVD Diamond Market

Published:
Report ID: 37009

Middle East and Africa Masterbatch Market

Published:
Report ID: 36966

Ferrous Slag Market

Published:
Report ID: 6261

Surfactants Market

Published:
Report ID: 10221

Graphite Market

Published:
Report ID: 6554

Saudi Arabia Plastic Products Market

Published:
Report ID: 36905

Copper Oxychloride Market

Published:
Report ID: 12415

India Oilfield Services Market

Published:
Report ID: 36781

Collagen Market

Published:
Report ID: 36725

Isostearic Acid Market

Published:
Report ID: 7580

Purchase Options

$2999
Delivery Format: Excel.
$4999
Designed for the individual purchaser.
$6999
Users located at a single corporate site or regional office.
$7999
Allowed for unlimited sharing globally within one company.
Smallform of Sample request

Have a question?

User Profile

Don’t settle for less – trust Mitul to help you find the best solution.

Report delivery within 24 to 48 hours

– Other Info –

What people say?-

User Review

I am very impressed with the information in this report. The author clearly did their research when they came up with this product and it has already given me a lot of ideas.

Jana Schmidt
CEDAR CX Technologies

– Connect with us –

Phone

+91 6232 49 3207


support

24/7 Research Support


sales@credenceresearch.com

– Research Methodology –

Going beyond the basics: advanced techniques in research methodology

– Trusted By –

Pepshi, LG, Nestle
Motorola, Honeywell, Johnson and johnson
LG Chem, SIEMENS, Pfizer
Unilever, Samsonite, QIAGEN