
Quick answer
A camel dairy plant collects, tests and pasteurizes camel milk, then sells packed liquid, fermented products and spray-dried powder. This overview models a greenfield plant taking 10,000 liters a day, with estimated CapEx of USD 3–9 million, excluding any herd. Gross margin after milk, packaging and direct conversion is estimated at 22–35%, with payback at 5–9 years, because secure milk supply and premium pricing decide the outcome.
Attractive only where a contracted milk shed and premium or export buyers are secured first, since scarce milk and a steep price gap with cow milk are the main risks.
Camel Dairy plant: key highlights
| Parameter | Indicative value | Note |
|---|---|---|
| Plant capacity | 10,000 liters of milk a day | 3 million liters a year at nameplate; 2.1 million liters at 70% utilization |
| Total CapEx | USD 3–9 million | Greenfield plant with a small dryer; excludes herd and USD 1–2 million working capital |
| Raw material share of operating cost | 58–66% | Delivered raw camel milk; packaging is next |
| Gross margin | 22–35% | After milk, packaging and direct conversion |
| Payback period | 5–9 years | Includes 18 months of ramp-up; depends on milk cost and pricing |
| IRR | Available in report | Post-tax, 10-year model |
| Break-even | Available in report | Capacity utilization basis |
Ranges assume 10,000 liters a day, 300 days, 70% utilization, purchased milk, no herd, 2026 prices, and 65% of milk sold packed and 35% dried at 8 liters per kg. Delivered milk at USD 1.80–2.50 per liter, packed product at USD 3–4.50 per liter and powder at USD 30–45 per kg are assumed. Tenge at an assumed 425 per USD for 2021. The full report can be customized to any country or region.
What is camel dairy?
Camel dairy covers milk from dromedary and Bactrian camels and the products made from it, including pasteurized and flavored milk, fermented drinks, ice cream, chocolate and powder. A review in Food Production, Processing and Nutrition puts average composition at about 3.8% fat and 3.35% protein. The milk has no beta-lactoglobulin and little kappa-casein, a protein profile that gives it a different processing behavior from cow milk.
The Harmonized System has no camel-specific code, so products fall under general dairy headings by form and fat level. Plain liquid milk at this fat level falls under 0401.20, covering 1–6% fat. Unsweetened powder usually falls under 0402.21, yogurt under 0403.20 and cheese under heading 0406. Customs data therefore cannot isolate camel milk.
Buyers include urban consumers in camel-rearing countries, expatriate and specialty shoppers, online health retailers, and makers of chocolate, nutrition products and cosmetics that use powder as an ingredient. Fresh milk is costly to ship, so most international plans rest on powder and value-added goods. This overview models a plant selling chilled products at home and powder further afield.
Camel dairy market overview and global demand
With camel milk hidden inside general dairy customs codes, physical indicators give the firmest view. Researchers Bernard Faye and Gaukhar Konuspayeva estimated 2022 output at 4.12 million tonnes, which they consider an underestimate, or about 0.44% of world milk. They expect 6–8% annual growth over the next decade, while warning the sector remains fragile. A key detail for investors is that pastoralists consume about 75% of African output and 60% of Saudi output themselves, so recorded production overstates what a plant can buy.
Commercial volumes are far smaller and concentrated. UAE officials cited more than 7,000 tonnes of pasteurized camel milk a year in February 2026. Camelicious reports about 3 million liters a year from a herd of 7,000, and Saudi Arabia's Sawani launched a site in August 2025 able to yield about 500,000 liters a month.
UAE officials cited about USD 1.37 billion for 2024, while press reports quote projections many times larger, so this overview adopts no market value. Adjacent specialty milks offer scale only. Credence Research puts global goat dairy demand at about USD 15.6 billion in 2025, derived from its USD 14.73 billion for 2024 and a 5.61% CAGR, and the much smaller donkey milk niche at USD 27.56 million for 2024.
In a decision reported in February 2026, the Codex Alimentarius Commission approved a UAE proposal for a first international standard on pasteurized camel milk. Officials said the gap had limited trade and allowed fraud, including camel powder mixed with bovine powder.
Camel dairy manufacturing process
The modeled plant buys raw milk through collection points, sells chilled products locally and dries the balance. Standard dairy equipment does most of the work, but camel milk's protein structure changes several settings and limits the product list.
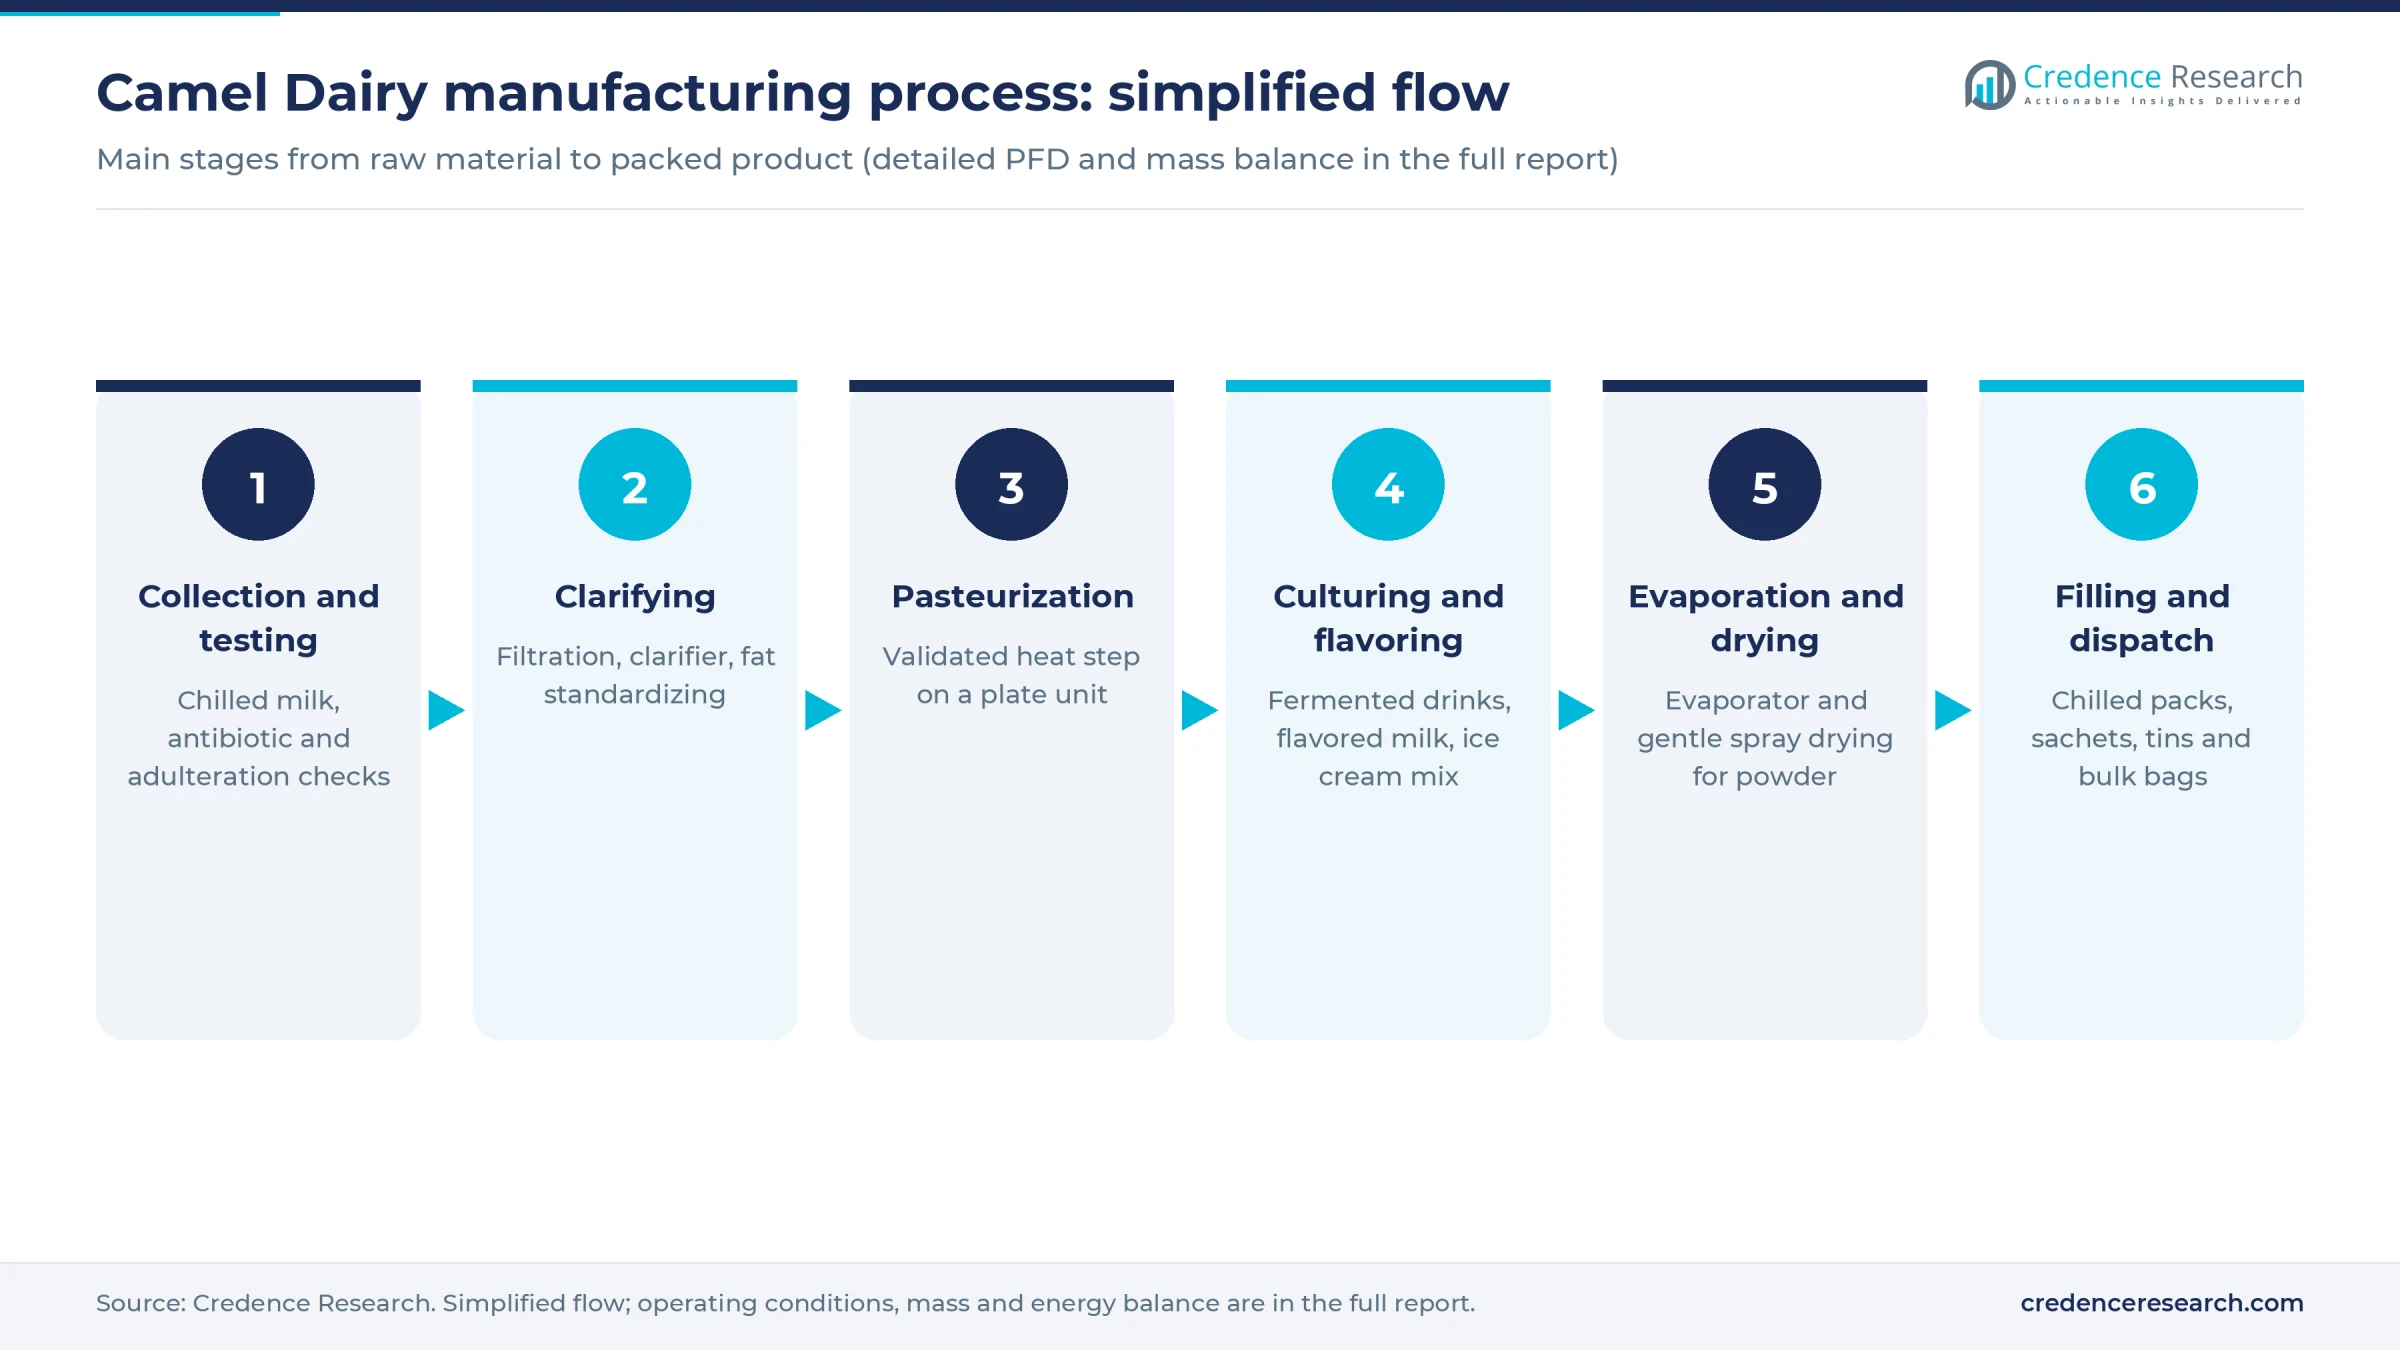
- Collection and testing. Milk reaches the plant chilled, usually in small lots from many suppliers. Each lot is checked for temperature, acidity, antibiotics and microbial load, and periodic species tests guard against cow milk adulteration.
- Clarifying and standardizing. Filters and a centrifugal clarifier remove sediment. Fat globules are small, which makes separation and butter making harder than with cow milk, and churning needs roughly 20–25 C rather than 8–12 C.
- Pasteurization. A plate pasteurizer delivers the validated kill step. It is the critical control point, because raw camel milk carries the same pathogen concerns as other raw milks, plus zoonotic disease sensitivity tied to dromedaries.
- Culturing and flavoring. Portions go to fermented drinks, flavored milk or ice cream mix. Cheese is the hard product. Low kappa-casein and large micelles give a weak curd, so plants need suitable coagulants and accept lower yields.
- Evaporation and spray drying. A falling-film evaporator and spray dryer convert surplus milk to powder at gentle temperatures, since the milk has low thermal stability during drying.
- Filling and dispatch. Chilled bottles and cartons go to cold storage, while powder goes into sachets, tins or lined bulk bags.
The same review judged conventional UHT unsuitable because proteins settle out, and found that pH adjustment or phosphate addition reduces sedimentation. Commercial long-life camel milk is sold, but a new plant should prove stability in trials before buying a line. Exact parameters and utility balances are in the full report.
Camel dairy plant setup cost
This overview models a greenfield plant taking 10,000 liters of camel milk a day, or 3 million liters a year over 300 days. That equals Camelicious's reported annual volume, so this is large for the sector. At 70% utilization, it buys about 2.1 million liters, packs 65% as liquid and dries the rest into about 90 tonnes of powder. Estimated CapEx is USD 3–9 million, excluding a herd and working capital.
Three disclosed plants frame the range. Ethiopia's Khelif Milk Processing Industry was reported in 2021 at about USD 1.6 million for 16,000 liters a day, without a dryer. Scaled with a standard capacity exponent of 0.65, that gives about USD 1.2 million, which is a stripped-down floor. Kazakhstan's Daulet-Beket put 1 billion tenge, about USD 2.4 million at an assumed rate, into a 30-tonne-a-month powder plant, near 10,000 liters a day at the model's assumed yield. An assumed 20–30% for cost escalation brings it to about USD 3 million, the low end here. Oman's Al Murooj Dairy, a mixed cow, camel and juice complex with 12,000 liters a day of camel capacity, is listed at about USD 45.5 million for 120,000 liters a day of total output. Scaled on that total output, it gives about USD 9 million, the high end and a guide to a full Gulf-standard build.
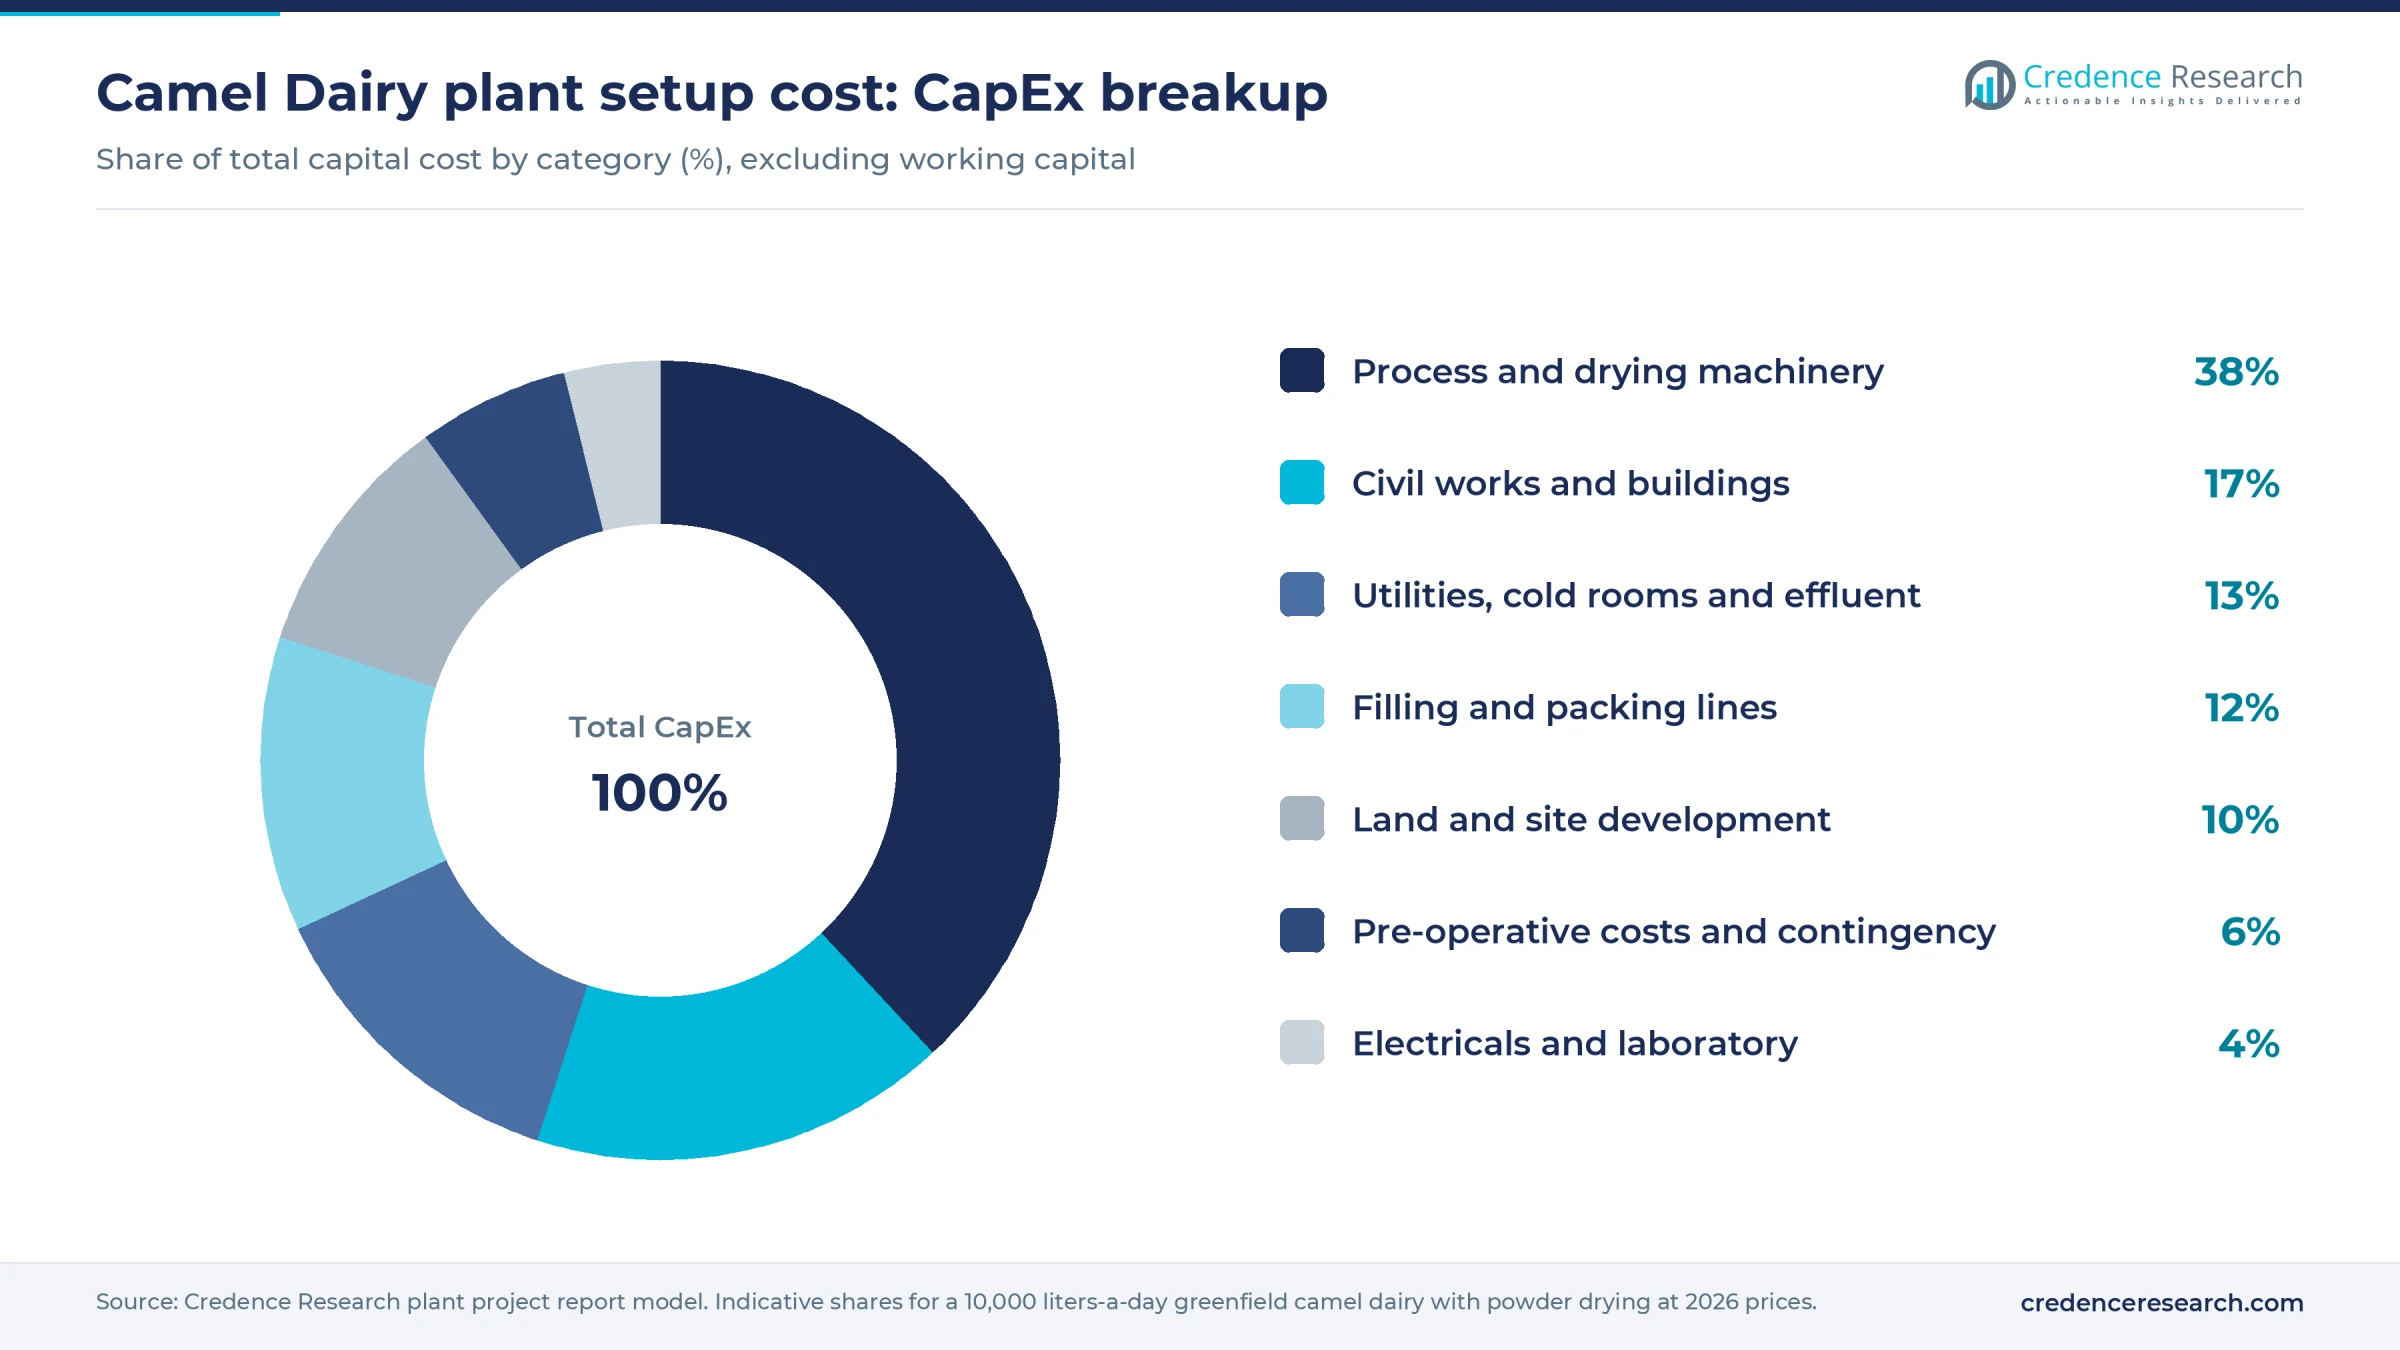
Worked example, land and site development. The plant needs an assumed 10,000–15,000 square meters. At an assumed USD 20–60 per square meter in an Asian, African or Gulf industrial zone, the plot costs about USD 200,000–900,000, and at an assumed USD 30–80 at a U.S. or EU site, about USD 300,000–1.2 million. Site works add an assumed USD 100,000–200,000, so this row runs about 10–16% of CapEx.
Powder stock and export receivables tie up an estimated USD 1–2 million in working capital.
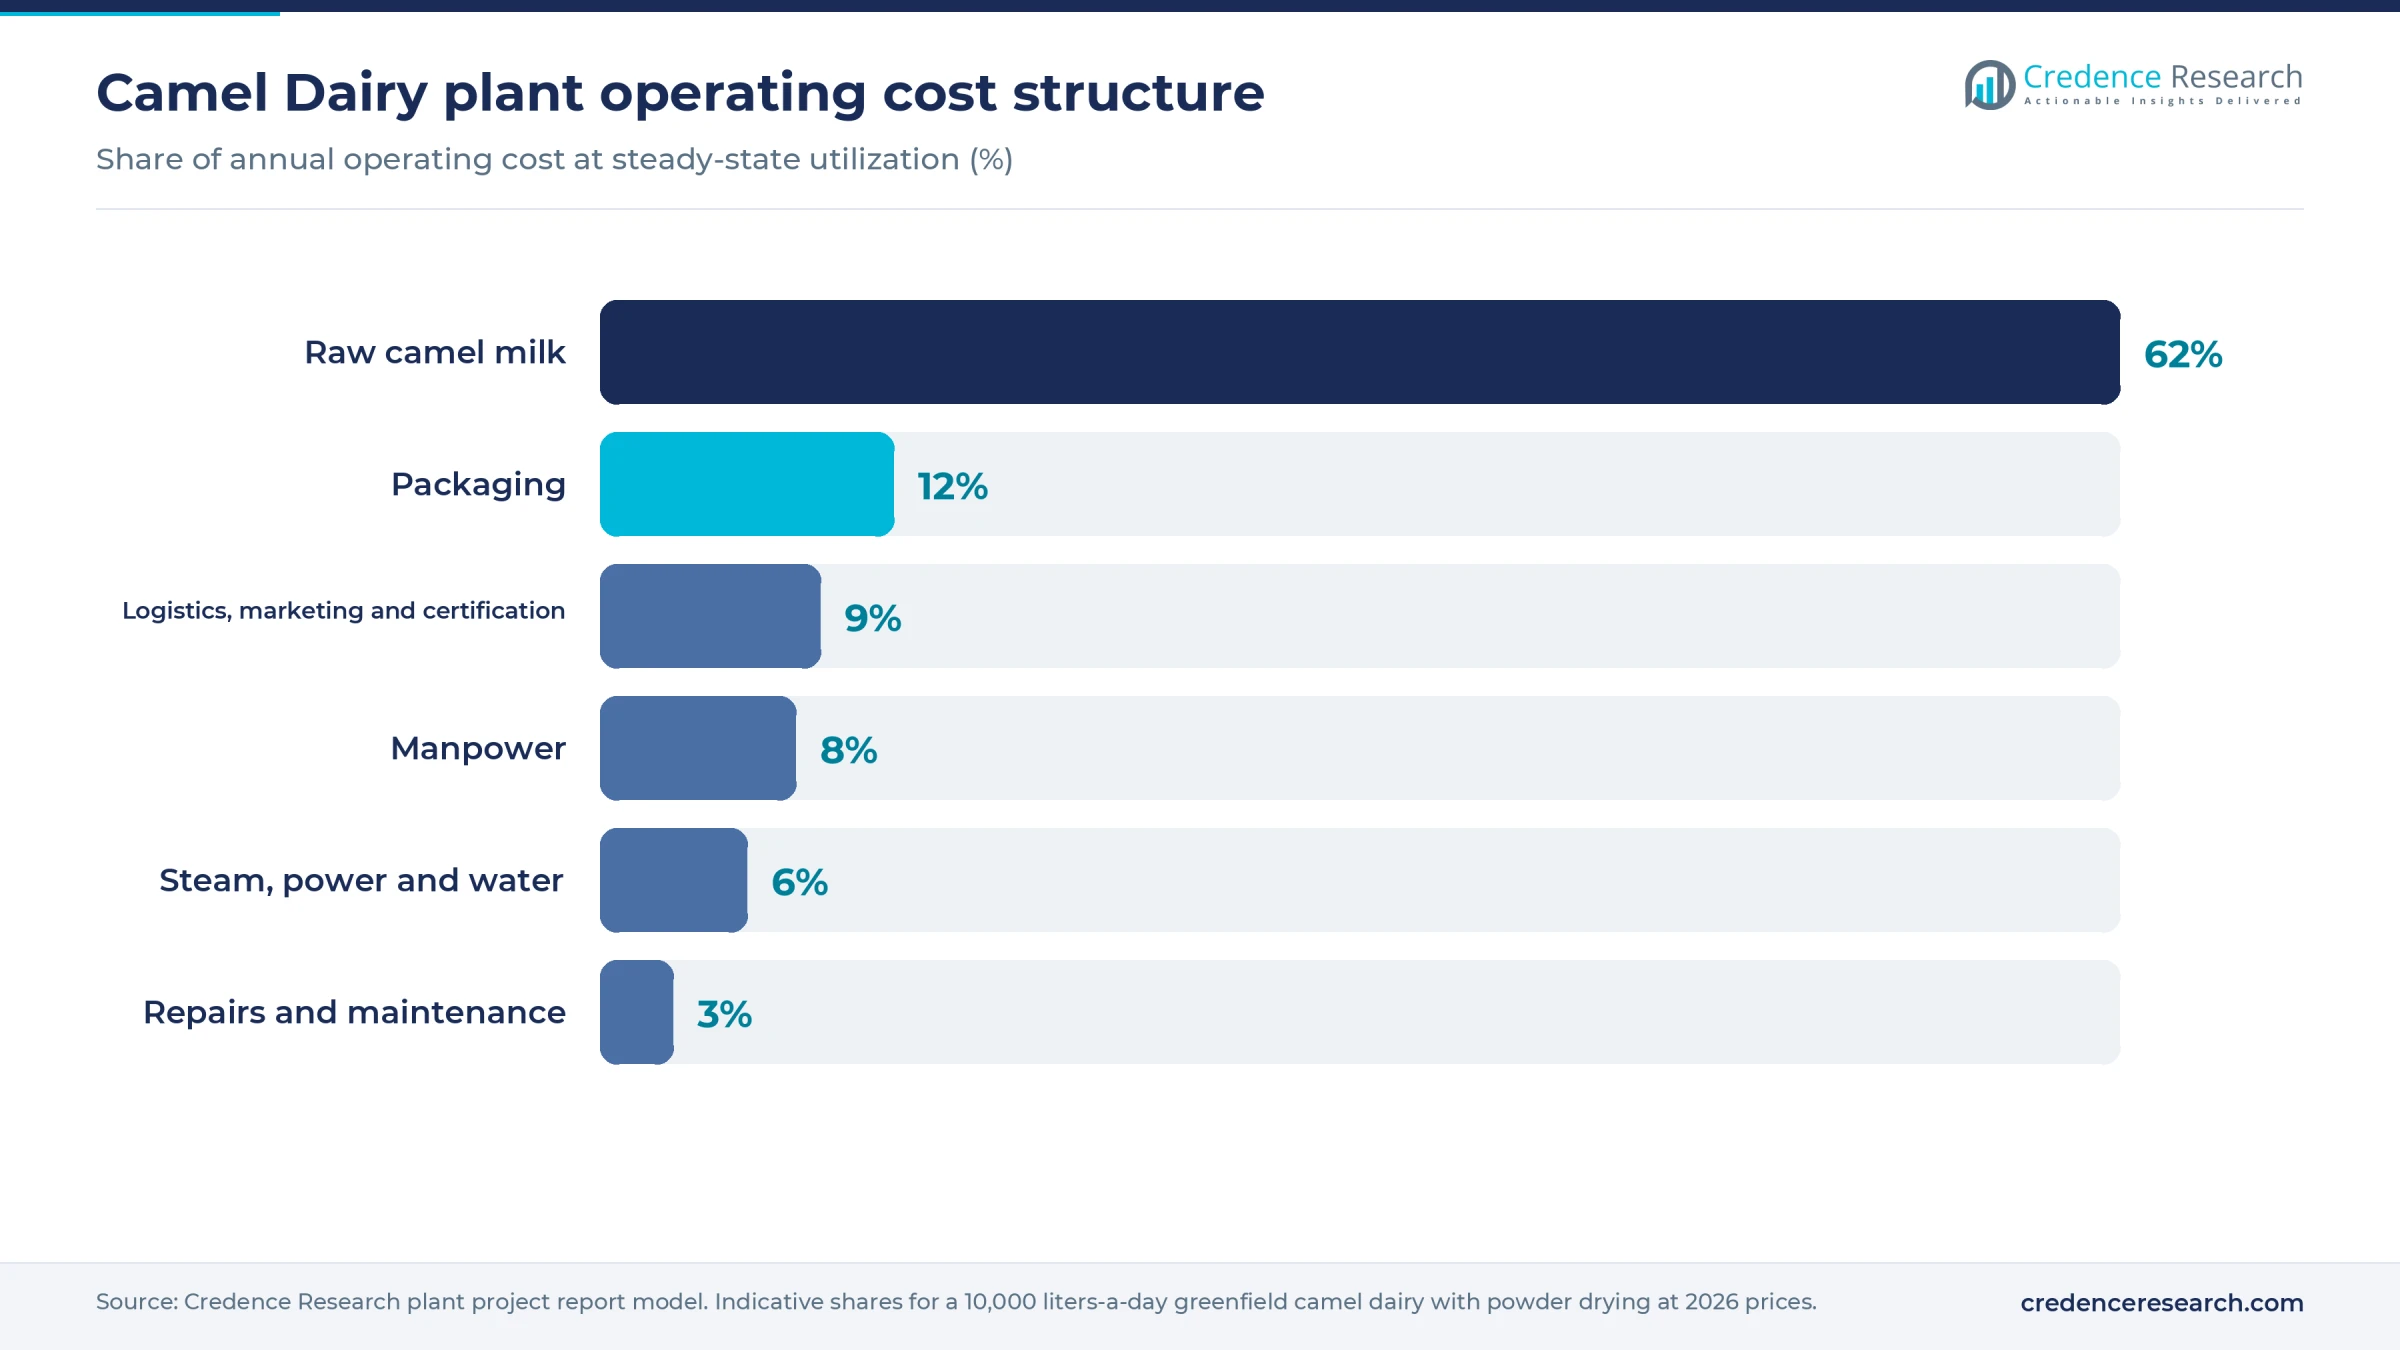
Milk dominates running costs. The full report can be customized to any country or region, and line-item budgets remain there.
Machinery and raw materials for a camel dairy plant
Core machinery includes insulated collection tanks, milk reception and testing equipment, a clarifier, separator, plate pasteurizer, culture and mixing tanks, and bottle or carton fillers. The drying block adds an evaporator, spray dryer and powder packing, along with dairy testing and adulteration screening in the laboratory. Utilities cover a boiler, chilled water, clean-in-place skids, cold rooms and an effluent plant.
Milk is the constraint, not machinery. The FAO considers 5 liters a day a decent yield, so a plant buying 7,000 liters a day needs about 1,400 lactating camels. With 21.3% of a herd lactating on average, that implies a herd of more than 6,500. A 2021 report from Ethiopia had herders selling about 14 liters a day each, which would mean some 490 regular sellers and a heavy collection network. Yields also swing with the season and lactation stage.
Pastoral supply comes from Somalia, Kenya, Ethiopia, Mauritania, Pakistan and India's Rajasthan and Gujarat. Organized or intensive supply is concentrated in Saudi Arabia, the UAE, Kazakhstan and China's Xinjiang, with smaller farms in Australia and the United States. Raw milk reached about USD 0.90 per liter in Ethiopia in 2021 and about USD 1.70–2.10 at Kazakh collection points in 2024, at an assumed 475 tenge per dollar. This model assumes USD 1.80–2.50 delivered, including chilling and haulage.
Camel dairy business profit margin and ROI
Estimated gross margin is 22–35%, after milk, packaging and direct conversion. Pricing is the core of the case. A 2023 review cites retail camel milk at about USD 7 per liter in India, USD 15 in Australia, USD 19 in Singapore and USD 38 in the United States. Sampled 2025 UAE export transactions, a thin data set, show USD 2.75–5.65 per kilogram for shipments. Kazakh powder samples from December 2025 to February 2026 ranged from about USD 36 to USD 64 per kilogram, on small volumes. The model therefore assumes well below retail, at USD 3–4.50 per liter ex-factory for packed product and USD 30–45 per kilogram for powder.
On those prices, annual sales are about USD 7–10 million, and gross profit is about USD 1.7–3.3 million. Overheads weigh heavily, because a premium brand needs marketing, quality staff and export certification. After an assumed USD 0.9–1.4 million of overhead and tax, cash profit is about USD 0.7–1.7 million a year.
Payback is an estimated 5–9 years, including about 18 months of ramp-up. As a cross-check, Al Murooj lists an 8-year payback for its mixed plant. The band excludes working capital and is not a limit: the cheapest build at the highest profit is near 3.3 years, and the costliest at the lowest profit near 14.4. Low selling prices paired with the highest milk cost erase gross margin, and a plant that runs short of milk cannot spread its fixed costs.
Each USD 0.20 per liter rise in delivered milk takes about 5 percentage points from gross margin unless prices follow.
| Metric | Value |
|---|---|
| IRR | Available in report |
| NPV | Available in report |
| ROI | Available in report |
| DSCR | Available in report |
How to start a camel dairy business, licenses and approvals
A camel dairy needs approvals in six areas: business and tax registration; land use, zoning and building permits; an environmental permit covering dairy wastewater and boiler emissions; occupational safety and pressure equipment approvals; dairy establishment licensing with product registration and a HACCP-based plan; and customs and veterinary export clearance. Market access comes first, because it depends on the origin country as well as the plant.
| Market | Food product and market access | Environment, safety and trade |
|---|---|---|
| United Arab Emirates | Food establishment permit from ADAFSA in Abu Dhabi or Dubai Municipality's Food Safety Department; product registration in the ZAD system under the Ministry of Climate Change and Environment; Ministry of Industry and Advanced Technology standards | Emirate-level environmental and building approvals; the climate ministry coordinates EU residue reporting |
| European Union | Establishment approval under Regulation (EC) No 853/2004 for EU plants. Imports need a listed origin: Annex XVIII of Regulation (EU) 2021/404 lists Abu Dhabi and Dubai specifically for Camelidae dairy products given foot-and-mouth risk treatment, with a veterinary certificate. Regulation (EU) 2022/2293 lists the UAE for residue control on camel milk only | National environmental permit, with this plant below the Industrial Emissions Directive's 200-tonne daily milk threshold |
| United States | FDA food facility registration; 21 CFR 1240.61 requires pasteurization for interstate sale of packaged milk, which FDA applied to camel milk in a 2016 warning letter; the Pasteurized Milk Ordinance names camels as hooved mammals; state milk agency permits | NPDES or pretreatment permit; state air permit; OSHA standards; importers follow FDA foreign supplier rules and USDA APHIS origin conditions |
Disease-related marketing can trigger drug rules. Retail buyers commonly expect FSSC 22000 or BRCGS, plus halal certification. The full report lists the steps for a chosen country.
Key camel dairy manufacturers and recent developments
Gulf producers lead the organized segment, among them Emirates Industry for Camel Milk and Products, maker of Camelicious, Al Ain Farms in the UAE and Saudi Arabia's Sawani, owner of the Noug brand. Regional makers include Daulet-Beket and Golden Camel Group in Kazakhstan, Khelif Milk Processing Industry in Ethiopia, Al Murooj Dairy in Oman, Amul and Aadvik in India, and Good Earth Dairy in Australia. Plants that dry milk also compete with cow-based whole milk powder in cost-driven ingredient uses.
- October 2026. Al Ain Farms said it would take Camelait global, shipping powder to Germany and China from about 2 million liters of annual output, with a planned China manufacturing partner and a Khalifa University research tie-up.
- October 2026. Pakistan's Punjab province agreed to provide four acres in the Faisalabad Special Economic Zone for ELC Biotechnology's camel milk powder plant, which targets Saudi and other Middle East buyers. The company expects machinery within six months.
- July 2026. Camelicious launched a camel milk with real honey and no added sugar, extending its push into value-added products.
What's inside the Camel Dairy project report PDF
The report runs to 21 chapters. Open a chapter to see its sections.
1. Preface
2. Scope and Methodology
- 2.1 Objectives of the Study
- 2.2 Stakeholders
- 2.3 Research Methodology
- 2.4 Data Sources and Key Assumptions
3. Executive Summary
- 3.1 Market Snapshot
- 3.2 Project at a Glance (Capacity, CapEx, OpEx)
- 3.3 Key Financial Indicators (IRR, NPV, Payback, Break-even)
- 3.4 Feasibility Verdict
4. Product Overview
- 4.1 Camel Dairy Definition and Properties
- 4.2 Grades and Specifications (BIS / ISO / ASTM)
- 4.3 HS Code and Classification
- 4.4 Key Applications
- 4.5 Substitutes
5. Global Camel Dairy Market
- 5.1 Market Overview
- 5.2 Historical and Current Market Performance (Volume and Value)
- 5.3 Market Breakup by Grade / Type
- 5.4 Market Breakup by End-Use Industry
- 5.5 Market Breakup by Region
- 5.6 Market Drivers, Restraints and Trends
- 5.7 Value Chain Analysis
- 5.8 Market Forecast
6. Target Country Camel Dairy Market Analysis
- 6.1 Demand and Supply Analysis
- 6.2 Installed Capacity vs Demand Gap
- 6.3 Import Dependence
- 6.4 Demand Forecast by End-Use
7. Trade Analysis
- 7.1 Imports by Volume, Value and Country
- 7.2 Exports by Volume, Value and Country
- 7.3 Trade Balance and Opportunities
8. Price Analysis
- 8.1 Historical Camel Dairy Price Trends by Region
- 8.2 Raw Material / Feedstock Price Trends and Linkage
- 8.3 Price Forecast
- 8.4 Margins Across the Value Chain
9. Competitive Landscape
- 9.1 Market Structure
- 9.2 Key Players and Installed Capacities
- 9.3 Profiles of Key Players
- 9.4 Recent Developments (Expansions, M&A, New Plants)
10. Manufacturing Process and Technology
- 10.1 Comparison of Technology Routes
- 10.2 Selected Route and Process Flow Diagram
- 10.3 Unit Operations Involved
- 10.4 Chemical Reactions Involved
- 10.5 Mass Balance and Raw Material Requirements
- 10.6 Energy Balance
- 10.7 Quality Assurance Criteria and Technical Tests
- 10.8 By-products and Waste Handling
- 10.9 Technology Licensors / Providers
11. Project Details, Requirements and Costs
- 11.1 Land, Location and Site Development
- 11.1.1 Site Selection Criteria
- 11.1.2 Location Analysis
- 11.1.3 Land Requirement and Costs
- 11.1.4 Site Development Costs
- 11.2 Plant Layout
- 11.2.1 Layout Principles
- 11.2.2 Proposed Layout
- 11.2.3 Factors Influencing Layout
- 11.3 Civil Works and Buildings
- 11.4 Plant Machinery
- 11.4.1 Machinery Requirements and Specifications
- 11.4.2 Machinery Costs
- 11.4.3 Machinery Suppliers
- 11.5 Raw Materials
- 11.5.1 Requirements per Tonne of Output
- 11.5.2 Procurement and Sourcing
- 11.5.3 Costs
- 11.5.4 Suppliers
- 11.6 Packaging
- 11.6.1 Packaging Requirements
- 11.6.2 Packaging Costs
- 11.6.3 Packaging Suppliers
- 11.7 Storage and Material Handling
- 11.8 Transportation Requirements and Costs
- 11.9 Utilities
- 11.9.1 Power Requirements and Costs
- 11.9.2 Water Requirements and Costs
- 11.9.3 Steam, Fuel and Other Utilities
- 11.10 Manpower Requirements and Wages
12. Environment, Health, Safety and Sustainability
- 12.1 Effluent and Emissions Management
- 12.2 Hazard Classification and Safety Measures
- 12.3 Carbon Footprint
- 12.4 Green / Low-Carbon Process Options
13. Regulatory Procedures, Approvals and Certifications
- 13.1 Licences and Registrations
- 13.2 Environmental Clearances
- 13.3 Product Certifications (BIS, REACH, etc.)
- 13.4 Approval Timeline
14. Project Implementation Schedule
15. Project Economics
- 15.1 Capital Cost of the Project
- 15.2 Techno-Economic Parameters
- 15.3 Capacity Utilization and Ramp-up
- 15.4 Product Pricing and Margins
- 15.5 Income Projections
- 15.6 Expenditure Projections
- 15.7 Working Capital Requirement
- 15.8 Taxation
- 15.9 Depreciation
16. Financial Analysis
- 16.1 Projected Profit and Loss Account
- 16.2 Projected Cash Flow Statement
- 16.3 Projected Balance Sheet
- 16.4 Liquidity Analysis
- 16.5 Profitability Analysis (Payback, NPV, IRR, ROI)
- 16.6 Break-even Analysis
- 16.7 Debt Service Coverage Ratio (DSCR)
- 16.8 Sensitivity Analysis
- 16.9 Scenario and Uncertainty Analysis
17. Funding and Incentives
- 17.1 Means of Finance and Debt-Equity Structure
- 17.2 Loans and Financial Assistance
- 17.3 Government Schemes and Subsidies (PLI, State Policies)
18. Risk Assessment
- 18.1 Key Success Factors
- 18.2 Key Risk Factors
- 18.3 Risk Mitigation
19. Strategic Recommendations
20. Case Study of a Successful Venture
21. Appendix
- 21.1 Detailed Assumptions
- 21.2 Abbreviations
- 21.3 List of Tables and Figures
- 21.4 Sources
This page vs. the full report
| Data point | On this page (free) | In the full report |
|---|---|---|
| Total CapEx | One rounded range at one capacity | Exact figure at three capacities with a line-item breakup |
| CapEx breakup | Category shares (%) only | Cost, quantity and supplier for every machine |
| Operating cost | Share of raw materials, utilities and labor | Per-unit cost sheet with each input price and consumption |
| Profitability | Gross margin range and payback band | Exact IRR, NPV, ROI, break-even and DSCR |
| Financial statements | List of what is included | 10-year P&L, cash flow, balance sheet and Excel model |
| Sensitivity | One directional line | Full sensitivity and scenario tables |
| Process | Simplified flow diagram | Detailed process flow, mass and energy balance, operating conditions |
| Machinery | Names of the main machines | Specifications, capacity, cost and supplier list |
| Market | Headline size, growth and India demand trend | Segment, region, trade and price forecast tables |
| Suppliers and buyers | Supplier types and sourcing hubs | Named suppliers and buyers |
Camel Dairy project report: FAQs
How much does a camel dairy processing plant cost?
What is the gross margin of a camel dairy business?
How long is the payback on a camel milk plant?
What is the HS code for camel milk?
How many camels does a 10,000-liter plant need?
Can camel milk be exported to the European Union?
Why not simply make UHT camel milk?

About the analyst
Priyanka Mor, Senior Consultant
Senior Consultant at Credence Research Inc directing strategic market advisory, cross-border commercial due diligence and enterprise intelligence frameworks for global B2B clients. Combines quantitative modeling with executive advisory, translating macroeconomic variables and supply chain data into go-to-market blueprints, M&A screenings and competitive war-gaming strategies.
Related market research
- Goat Dairy Market Size, Share and Global Industry Report 2032
- Donkey Milk Market Size, Growth, Share and Forecast 2032
- Whole Milk Powder Market Size, Share, Trends and Forecast 2032
- Dairy Testing Services Market Size, Share and Growth Report 2032
- Dairy Starter Culture Market Size, Share and Growth Report 2032
- Dairy Ingredients Market Size, Growth, Share and Forecast 2032
More plant project reports
- Bread Manufacturing Plant Project Report (DPR) 2026
- Chocolate Manufacturing Plant Project Report (DPR) 2026
- Cheese Manufacturing Plant Project Report (DPR) 2026
- Vinegar Manufacturing Plant Project Report (DPR) 2026
- Onion Powder Manufacturing Plant Project Report (DPR) 2026
- Tea Processing Plant Project Report (DPR) 2026