
Quick answer
Generic injectables are off-patent sterile drugs filled into vials, ampoules or syringes and sold mainly to hospitals. A greenfield plant filling 30 million liquid vials and ampoules a year needs an estimated USD 35–50 million of CapEx at an Asian site and USD 60–150 million in the U.S. or EU. Gross margin is about 45–70% before fixed costs, and simple payback is about 3–10 years from commercial launch, once product approvals are in hand.
Viable for a sponsor with a funded product pipeline and the quality culture to pass sterile GMP inspections, but slow to pay back because approvals take years and prices on older molecules are thin.
Generic Injectables plant: key highlights
| Parameter | Indicative value | Note |
|---|---|---|
| Plant capacity | 30 million filled units per year | Liquid vials and ampoules of 1–20 mL on two lines, two shifts, about 300 days |
| Total CapEx | USD 35–150 million | USD 35–50 million at an Asian industrial park, USD 60–150 million at a U.S. or EU site |
| Raw material share of operating cost | 35–50% | Active ingredient, excipients and glass, stoppers and seals; higher share where labor is cheap |
| Gross margin | 45–70% | Price less materials, utilities, quality testing and freight, before fixed costs; prices assumed |
| Payback period | 3–10 years | From commercial launch at 80% utilization, simple pre-tax basis; about 5 years at base prices |
| IRR | Available in report | Post-tax, 10-year model |
| Break-even | Available in report | Capacity utilization basis |
Ranges assume 30 million liquid vials and ampoules a year, 80% sold, two lines and two shifts, an Asian industrial park or a U.S. or EU site, and 2026 prices. CapEx is scaled from disclosed U.S. and Indian plants with assumed escalation, rupees at an assumed 65 (2017) per USD. Average selling prices of USD 1.20 and USD 2.50 per unit, land rates and fixed costs are assumed. Lyophilization is excluded. Customizable to any country or region.
What are generic injectables?
Generic injectables are sterile medicines given by injection or infusion that copy an off-patent reference drug in active ingredient, strength, dosage form and route. Hospitals use them every day in anesthesia, intensive care, emergency medicine, oncology and infection control, with familiar examples such as antibiotics, heparin, local anesthetics, antiemetics and neuromuscular blockers.
The main formats are liquid solutions in glass vials or ampoules, lyophilized powders reconstituted before use, ready-to-use prefilled syringes, and large-volume infusion bags. Products are either terminally sterilized in their final container, which is the preferred route, or made by aseptic processing when heat would damage the drug. Every batch must be sterile, low in bacterial endotoxin and essentially free of visible particles, which is why the plant matters more than the chemistry.
Finished doses fall under Harmonized System heading 3004. Most generic injectables sit in subheading 3004.90, other medicaments in measured doses, while penicillin products use 3004.10 and other antibiotics 3004.20. Bulk drug not yet put up in doses goes under heading 3003.
Generic injectables market overview and global demand
The global market is worth about USD 115.4 billion in 2025, based on Credence Research's global generic injectables study of USD 104.15 billion for 2024 and a 10.80% CAGR, which points to USD 250.43 billion by 2032. It overlaps with the wider sterile injectables category, which also covers branded and biologic products.
Demand growth comes from three separate sources. Patent expiries keep moving injectable molecules into generic competition, aging populations raise surgery, cancer and critical care volumes, and hospital buyers in Asia, Latin America and Africa expand formularies as public insurance spreads. Complex products such as long-acting suspensions and peptides add higher-value niches.
Trade data show where finished-dose supply sits. UN Comtrade shows reported exports of HS 3004.90 of about USD 365 billion in 2024, led by Germany, Switzerland, the United States, Italy, Slovenia and Ireland, while the United States was by far the largest importer at about USD 79 billion. Those flows include tablets and branded drugs, but they show the scale of finished-dose trade that injectables move within. India and China supply much of the active ingredient base and a growing share of finished generic vials.
Supply security is the defining market issue. ASHP, the U.S. health-system pharmacists' body, counted 225 active drug shortages in the third quarter of 2026, down from a record 323 in early 2024, with generic chemotherapy agents among the worst affected. Low prices, few producers per molecule and sterile-quality failures explain much of that fragility. Buyers are hospitals, group purchasing organizations, public tenders, distributors and brand companies that outsource generic filling.
Generic injectables manufacturing process
The reference plant fills liquid products into vials and ampoules. Where the drug tolerates heat, filled units are terminally sterilized, and otherwise the solution is sterile filtered and filled aseptically. Lyophilization, prefilled syringes and cytotoxic containment are options that add cost and are modeled separately in the report.
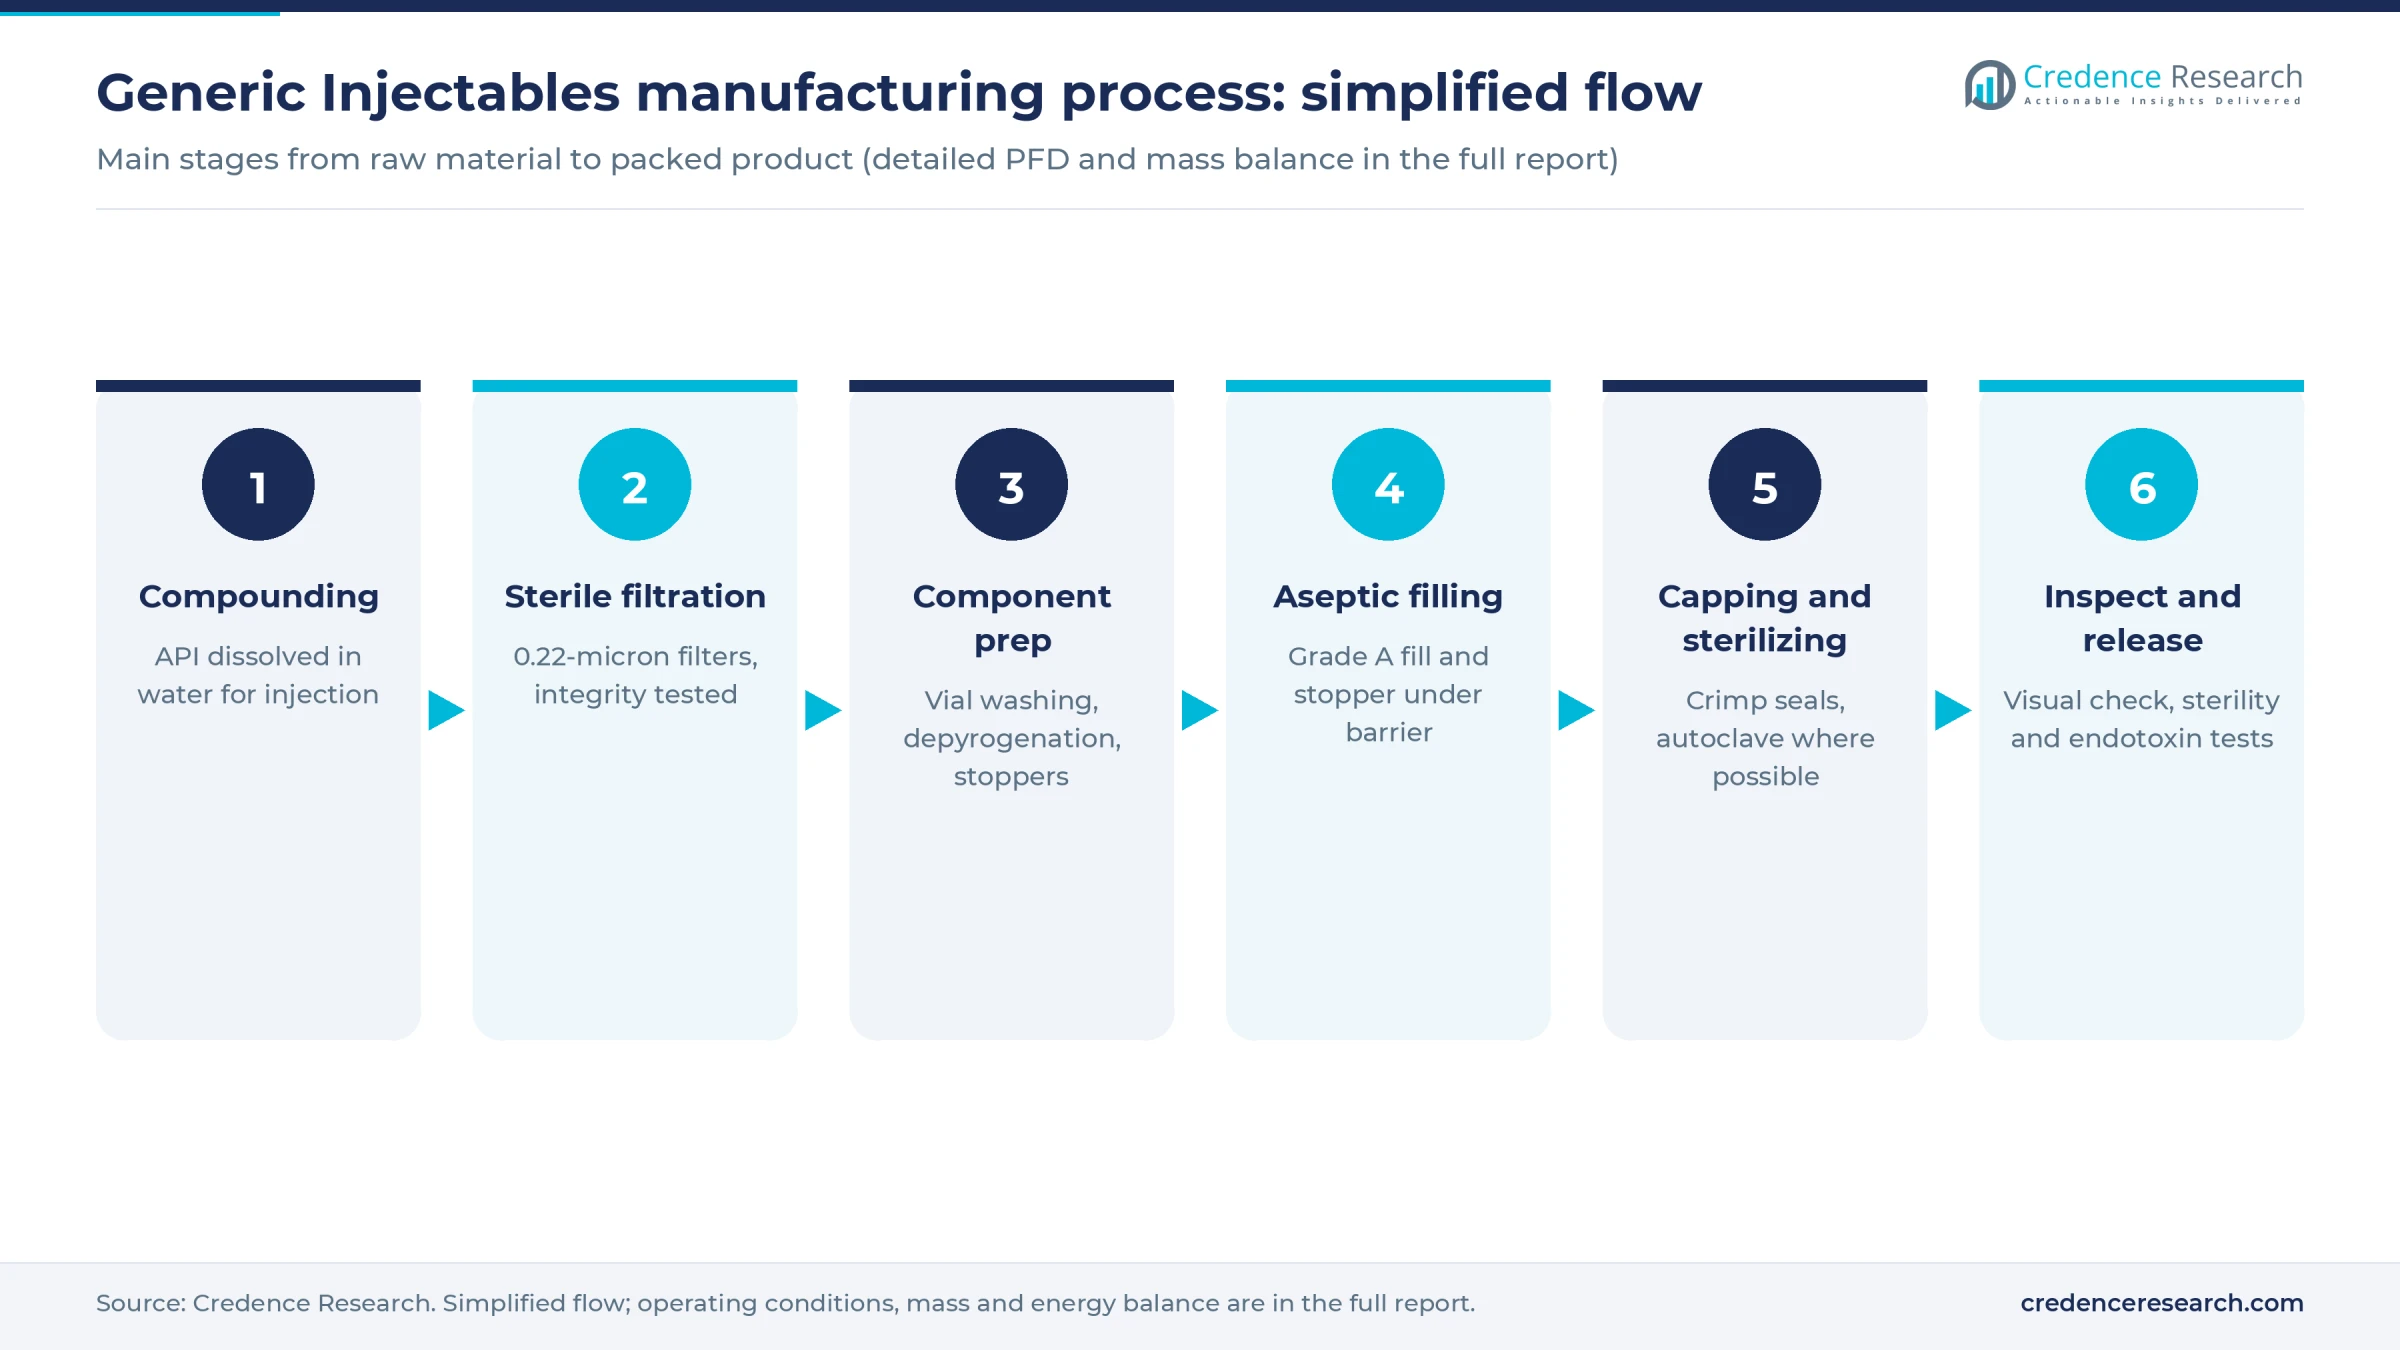
- Dispensing and compounding. Active ingredient and excipients are weighed in a controlled area and dissolved in water for injection in stainless steel vessels, with pH and nitrogen blanketing set by the formula.
- Filtration. The bulk solution passes through a 0.22-micron sterilizing filter, tested for integrity before and after use, into a sterile holding vessel.
- Component preparation. Vials are washed and depyrogenated in a hot-air tunnel, while stoppers and seals are washed and steam sterilized, or bought ready to use.
- Aseptic filling. Filling and stoppering run in a Grade A zone under a restricted-access barrier or an isolator, inside a Grade B room, with continuous particle and microbial monitoring. Ampoules are filled and flame sealed.
- Capping and sterilization. Vials are crimped with aluminum seals, and terminally sterilized products go through a validated autoclave cycle.
- Inspection, testing and release. Every unit is inspected for particles and defects, containers are leak tested, and samples go to sterility, endotoxin, assay and impurity testing before a qualified person or quality unit releases the batch for labeling and serialization.
Most failures come from contamination control rather than formulation. Regulators expect a documented contamination control strategy, media fills that simulate the process, and environmental data trended over time. A plant also needs months of qualification and validation before its first commercial batch, which is why time to market is longer than for tablets.
Generic injectables plant setup cost
The reference plant fills 30 million liquid vials and ampoules a year on two lines over two shifts. Total CapEx is estimated at USD 35–50 million at an Asian industrial park and USD 60–150 million at a U.S. or EU site, covering land, clean-room building and HVAC, process equipment, water systems, a quality lab, validation, preoperative costs and working capital.
Three disclosed projects anchor the range. Civica announced USD 124.5 million in 2021 for a Virginia plant sized at 90 million vials and 50 million prefilled syringes a year. Scaled to 30 million units by the six-tenths rule, with assumed escalation of 20%, that gives about USD 59 million. Jubilant HollisterStier reported USD 132 million for a third fill-finish line at its Spokane, Washington, site, adding roughly 25 million vials a year, which scales to about USD 147 million and sets the high end. In India, Alembic's 2017 Halol unit cost 3 billion rupees, about USD 46 million at an assumed rate, for stated capacity of about 20 million vials plus oral doses. An assumed 75% injectable share scales to about USD 44 million, with escalation offset by its oncology containment premium. Applying an assumed 0.6 location factor to the Civica figure gives about USD 36 million.
For the land row, the plant needs about 2.5 hectares, close to the 5.5 acres planned for one new Indian injectables site. At an assumed USD 20–60 per square meter in Asia, land costs USD 500,000 to USD 1.5 million. An assumed USD 60–200 per square meter at U.S. or EU sites gives USD 1.5–5 million, still only about 3% of CapEx.
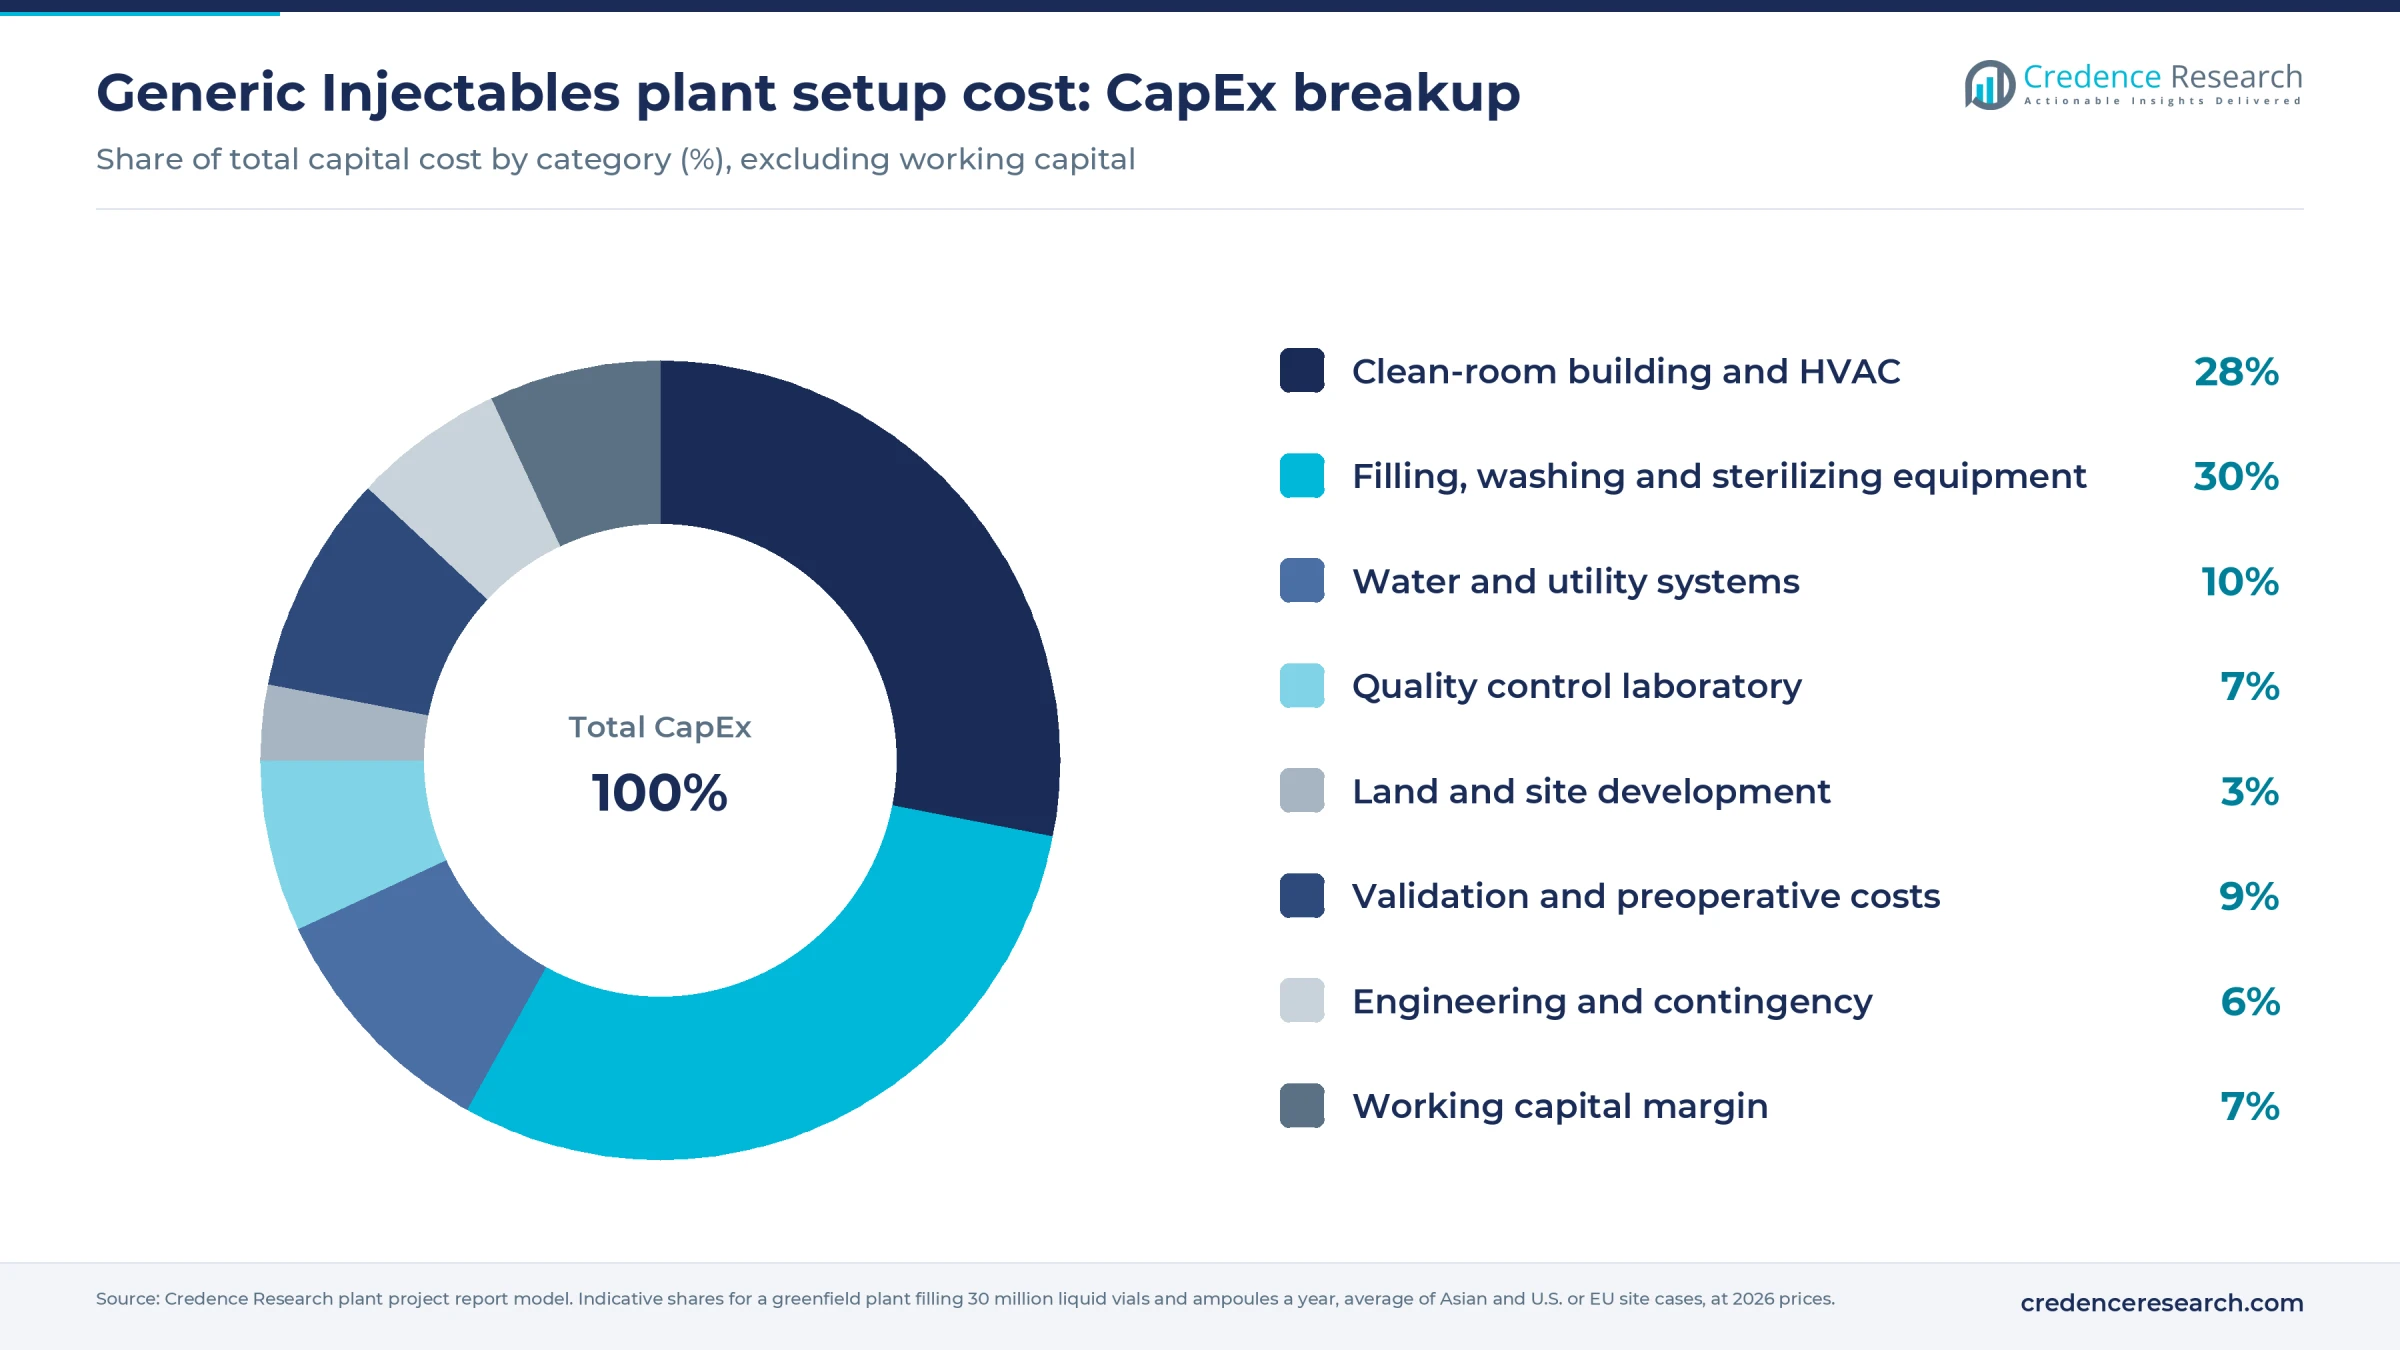
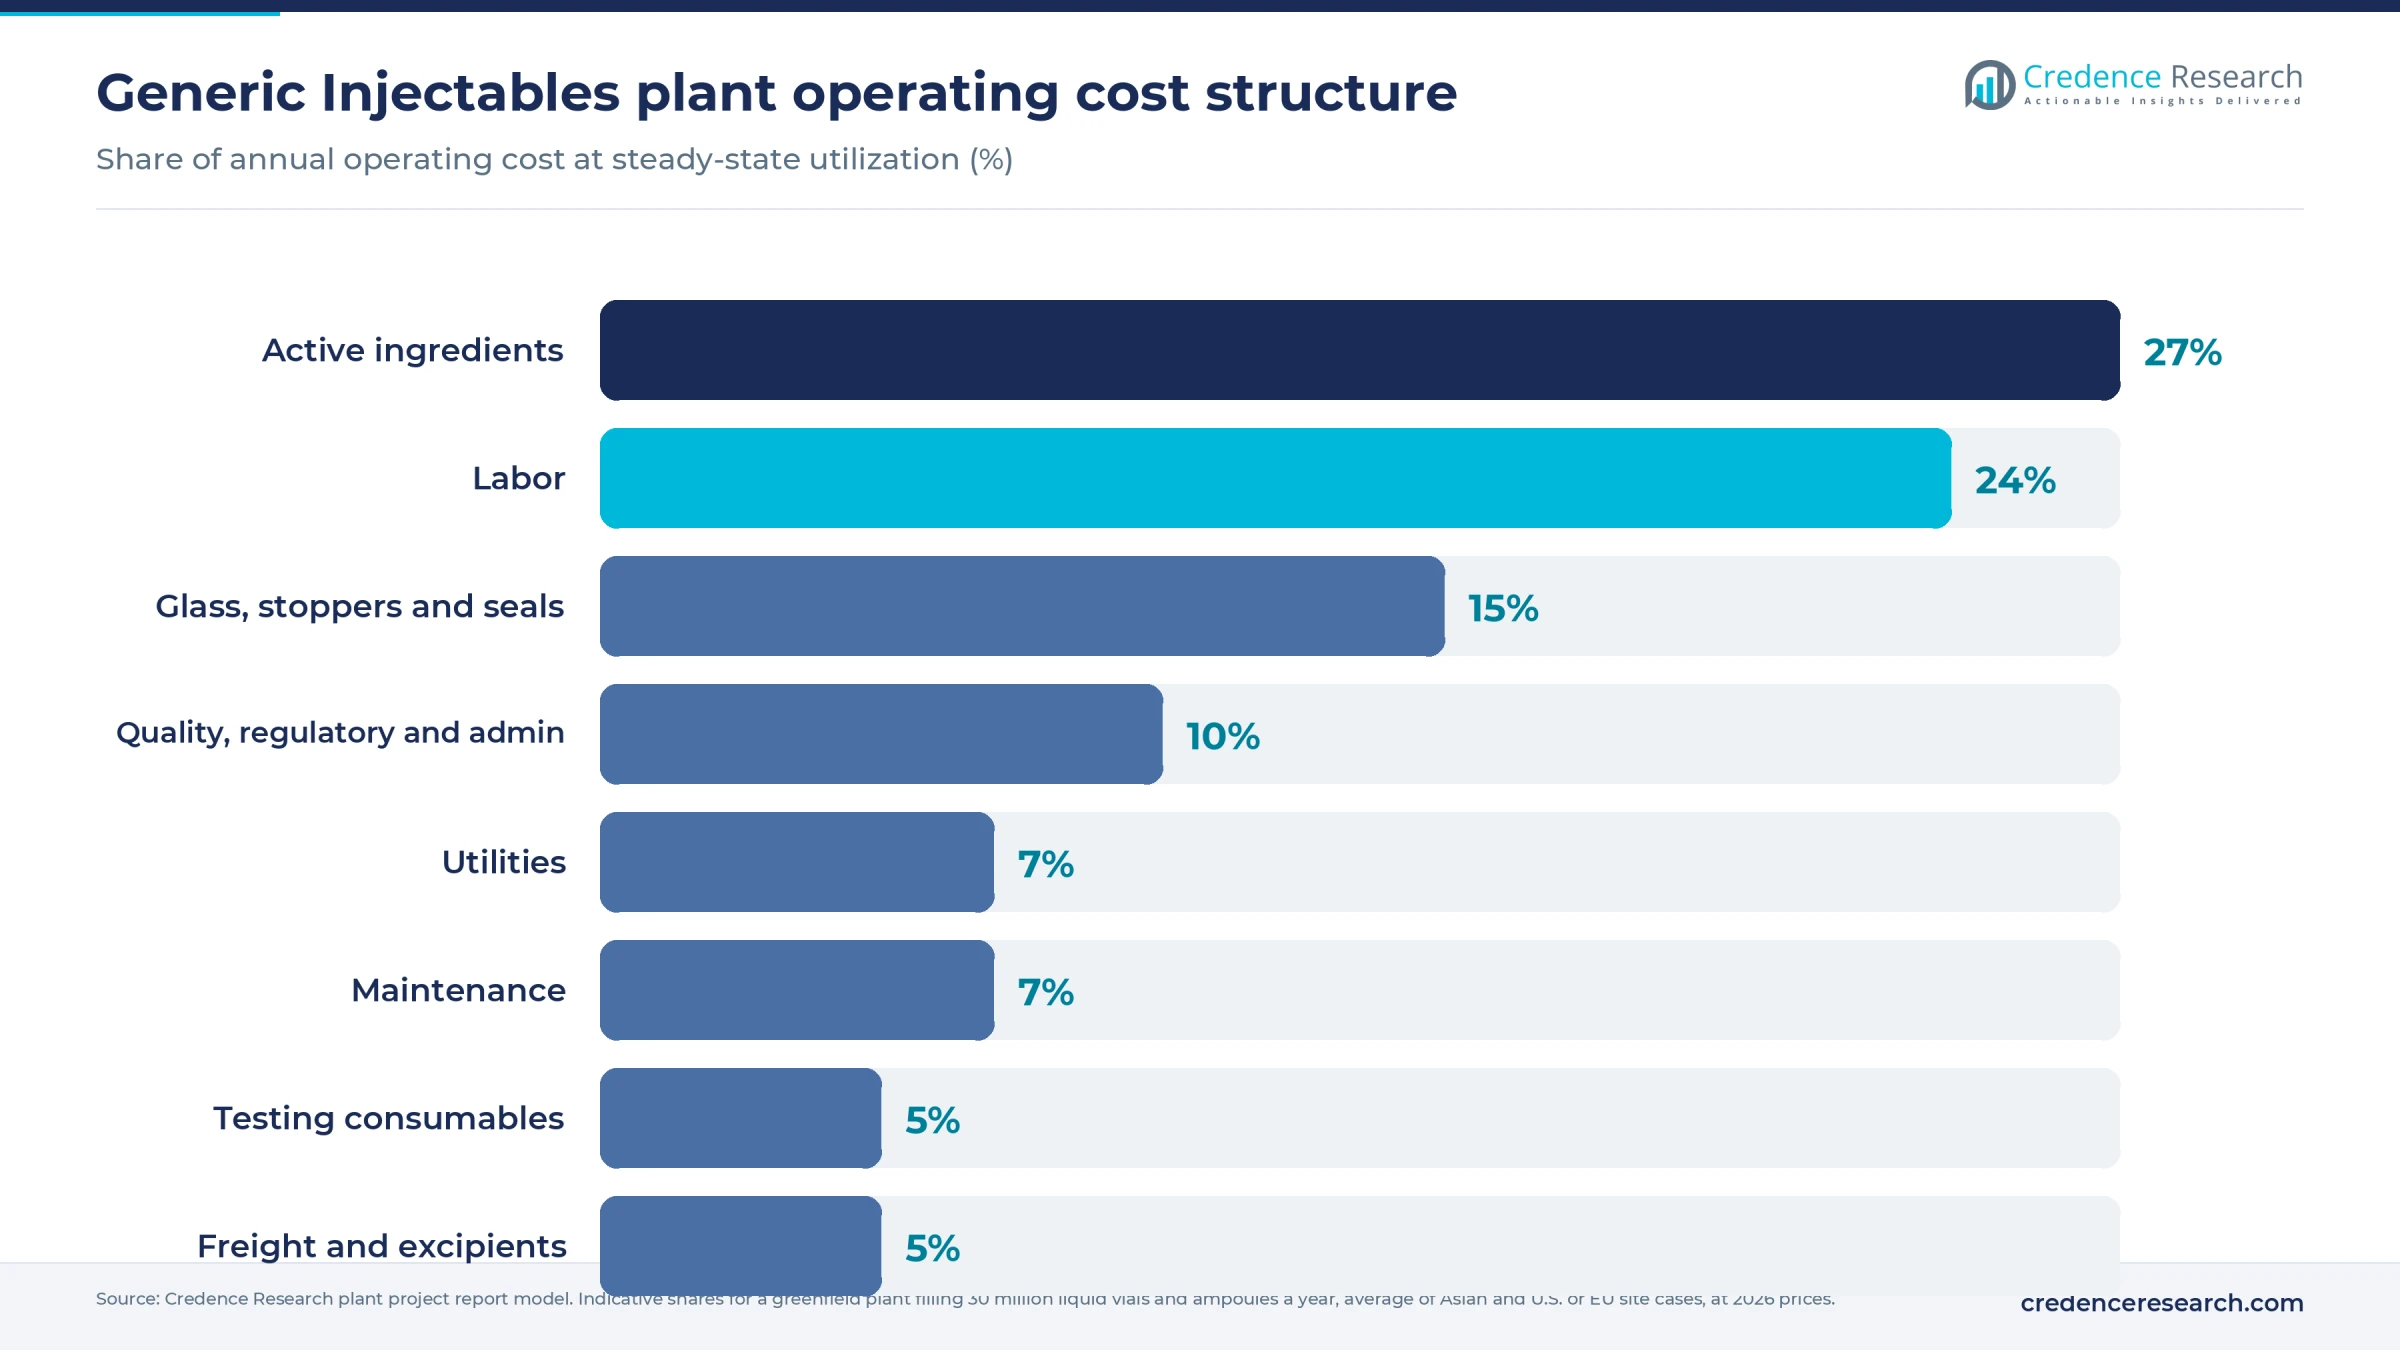
Clean rooms, HVAC and fill-finish machinery take most of the budget. Operating cost then depends on active ingredient prices and on how many people the quality system needs.
The full report can be customized to any country or region.
Machinery and raw materials for a generic injectables plant
Main equipment groups are listed below; ratings, makes and the full schedule are in the report.
- Purified water, water for injection and pure steam generators with stainless steel distribution loops
- Clean-room HVAC with HEPA filtration and environmental monitoring
- Compounding vessels, transfer systems and sterilizing filtration skids
- Vial washers, depyrogenation tunnels and stopper processors
- Filling and stoppering machines under barriers or isolators, plus an ampoule fill-seal line
- Capping machines, steam autoclaves and leak testers
- Automatic visual inspection, labeling, cartoning and serialization equipment
- Quality lab with chromatography, endotoxin, particle and sterility testing
High-speed injectable liquid filling machines and isolators come mainly from Germany, Italy, Japan and the United States, with China and India supplying lower-cost lines that suit domestic markets.
Raw materials fall into two groups. Active pharmaceutical ingredients come largely from India and China, with Europe and the United States supplying many sterile and high-potency grades, and each source must be qualified and filed with the regulator. Type I borosilicate tubing glass and ready-to-use sterile vials come from Germany, the United States, Japan, China and India, while elastomeric stoppers and aluminum seals have makers in the United States, Europe, India and China. Dual sourcing of the active ingredient protects supply but adds filing cost.
Generic injectables business profit margin and ROI
Gross margin is estimated at 45–70%, measured as revenue minus active ingredient, packaging components, utilities, quality testing consumables and freight, before labor and overhead. That band is consistent with a U.S. health department analysis from December 2024 that used cost of goods of 42% of revenue for generic injectables. The same analysis found that about 70% of generic injectable launches were not profitable within three years under its middle cost case.
Average selling prices are assumed at USD 1.20 per unit for an Asian plant serving tenders and export markets, and USD 2.50 per unit for a U.S. or EU plant serving regulated hospital buyers. At 24 million units sold, revenue is about USD 28.8 million and USD 60 million. Assumed fixed costs of about USD 6.3 million and USD 20.5 million leave cash profit near USD 9.1 million and USD 19.1 million, so simple payback is about 4.6 and 5.2 years on USD 42 million and USD 100 million of CapEx. A 15% price swing widens that to 3–10 years.
Approval timing is the hidden cost. Each U.S. generic application now carries a filing fee of USD 375,684 for fiscal 2027, and a plant may wait two to four years for its first products, which payback counts from launch.
| Metric | Value |
|---|---|
| Gross margin | 45–70% |
| Payback period | 3–10 years |
| IRR (post-tax) | Available in report |
| NPV | Available in report |
| Return on investment | Available in report |
| DSCR | Available in report |
| Break-even utilization | Available in report |
How to start a generic injectables business, licenses and approvals
Approval steps follow a common path: company and tax registration, industrial zoning and building permits, an environmental permit covering solvent use, wastewater and biomedical waste, fire and occupational safety clearances, and import-export registration. The defining steps are drug regulation. The plant needs a manufacturing license or authorization, compliance with sterile GMP, and a separate marketing approval for each product in each market, supported by bioequivalence or sameness data, stability studies and process validation. Fees apply too: U.S. generic drug user fees for fiscal 2027 include an annual facility fee of about USD 230,000 for a domestic finished-dose plant and USD 245,000 for a foreign one.
| Market | Key approvals for a generic injectables plant |
|---|---|
| United States | FDA abbreviated new drug application under section 505(j) of the FD&C Act; CGMP under 21 CFR Parts 210 and 211 and FDA aseptic processing guidance; establishment registration and drug listing under 21 CFR Part 207; GDUFA facility and program fees; DEA registration for controlled substances; state manufacturer license |
| European Union | Manufacturing authorization with a Qualified Person under Directive 2001/83/EC; EU GMP Annex 1 for sterile medicinal products, revised version applicable since August 2023; generic marketing authorization under Article 10 through national, decentralized or centralized procedures; European Pharmacopoeia quality |
| India | Manufacturing license in Form 28 from the State Licensing Authority under the Drugs and Cosmetics Rules 1945, since parenterals are Schedule C drugs; revised Schedule M GMP; CDSCO permission where the product counts as a new drug; state pollution board consents; factory license |
Export plants also face inspections by each importing regulator, so inspection readiness is a design input, not an afterthought.
Key generic injectables manufacturers and recent developments
Global supply is led by Pfizer's Hospital unit, Fresenius Kabi, Hikma, Sandoz, Baxter, Teva, Viatris and Sagent, with Indian producers Gland Pharma, Eugia, Dr. Reddy's, Zydus and Caplin Steriles, and Chinese makers such as Qilu and Hengrui, gaining share. Brand owners and generic sponsors without plants often rely on a sterile injectable contract manufacturer.
- June 2026: Hikma announced USD 267 million for its Ohio sites, including USD 51 million at Bedford for advanced aseptic vial filling, lyophilization and IV bag production, with up to 300 jobs there.
- June 2026: Maiva Pharma opened a generic and complex sterile injectables plant at Shoolagiri, Tamil Nadu, with vial, prefilled syringe and cartridge, and lyophilization lines in its first phase on a 22-acre site planned for six lines.
- July 2026: Gland Pharma received U.S. approval for generic sugammadex injection in two vial strengths and completed a day-one U.S. launch through its marketing partner.
These moves show capacity returning to the United States for supply security while Indian plants compete on complex products and day-one launches.
What's inside the Generic Injectables project report PDF
The report runs to 21 chapters. Open a chapter to see its sections.
1. Preface
2. Scope and Methodology
- 2.1 Objectives of the Study
- 2.2 Stakeholders
- 2.3 Research Methodology
- 2.4 Data Sources and Key Assumptions
3. Executive Summary
- 3.1 Market Snapshot
- 3.2 Project at a Glance (Capacity, CapEx, OpEx)
- 3.3 Key Financial Indicators (IRR, NPV, Payback, Break-even)
- 3.4 Feasibility Verdict
4. Product Overview
- 4.1 Generic Injectables Definition and Properties
- 4.2 Grades and Specifications (BIS / ISO / ASTM)
- 4.3 HS Code and Classification
- 4.4 Key Applications
- 4.5 Substitutes
5. Global Generic Injectables Market
- 5.1 Market Overview
- 5.2 Historical and Current Market Performance (Volume and Value)
- 5.3 Market Breakup by Grade / Type
- 5.4 Market Breakup by End-Use Industry
- 5.5 Market Breakup by Region
- 5.6 Market Drivers, Restraints and Trends
- 5.7 Value Chain Analysis
- 5.8 Market Forecast
6. Target Country Generic Injectables Market Analysis
- 6.1 Demand and Supply Analysis
- 6.2 Installed Capacity vs Demand Gap
- 6.3 Import Dependence
- 6.4 Demand Forecast by End-Use
7. Trade Analysis
- 7.1 Imports by Volume, Value and Country
- 7.2 Exports by Volume, Value and Country
- 7.3 Trade Balance and Opportunities
8. Price Analysis
- 8.1 Historical Generic Injectables Price Trends by Region
- 8.2 Raw Material / Feedstock Price Trends and Linkage
- 8.3 Price Forecast
- 8.4 Margins Across the Value Chain
9. Competitive Landscape
- 9.1 Market Structure
- 9.2 Key Players and Installed Capacities
- 9.3 Profiles of Key Players
- 9.4 Recent Developments (Expansions, M&A, New Plants)
10. Manufacturing Process and Technology
- 10.1 Comparison of Technology Routes
- 10.2 Selected Route and Process Flow Diagram
- 10.3 Unit Operations Involved
- 10.4 Chemical Reactions Involved
- 10.5 Mass Balance and Raw Material Requirements
- 10.6 Energy Balance
- 10.7 Quality Assurance Criteria and Technical Tests
- 10.8 By-products and Waste Handling
- 10.9 Technology Licensors / Providers
11. Project Details, Requirements and Costs
- 11.1 Land, Location and Site Development
- 11.1.1 Site Selection Criteria
- 11.1.2 Location Analysis
- 11.1.3 Land Requirement and Costs
- 11.1.4 Site Development Costs
- 11.2 Plant Layout
- 11.2.1 Layout Principles
- 11.2.2 Proposed Layout
- 11.2.3 Factors Influencing Layout
- 11.3 Civil Works and Buildings
- 11.4 Plant Machinery
- 11.4.1 Machinery Requirements and Specifications
- 11.4.2 Machinery Costs
- 11.4.3 Machinery Suppliers
- 11.5 Raw Materials
- 11.5.1 Requirements per Tonne of Output
- 11.5.2 Procurement and Sourcing
- 11.5.3 Costs
- 11.5.4 Suppliers
- 11.6 Packaging
- 11.6.1 Packaging Requirements
- 11.6.2 Packaging Costs
- 11.6.3 Packaging Suppliers
- 11.7 Storage and Material Handling
- 11.8 Transportation Requirements and Costs
- 11.9 Utilities
- 11.9.1 Power Requirements and Costs
- 11.9.2 Water Requirements and Costs
- 11.9.3 Steam, Fuel and Other Utilities
- 11.10 Manpower Requirements and Wages
12. Environment, Health, Safety and Sustainability
- 12.1 Effluent and Emissions Management
- 12.2 Hazard Classification and Safety Measures
- 12.3 Carbon Footprint
- 12.4 Green / Low-Carbon Process Options
13. Regulatory Procedures, Approvals and Certifications
- 13.1 Licences and Registrations
- 13.2 Environmental Clearances
- 13.3 Product Certifications (BIS, REACH, etc.)
- 13.4 Approval Timeline
14. Project Implementation Schedule
15. Project Economics
- 15.1 Capital Cost of the Project
- 15.2 Techno-Economic Parameters
- 15.3 Capacity Utilization and Ramp-up
- 15.4 Product Pricing and Margins
- 15.5 Income Projections
- 15.6 Expenditure Projections
- 15.7 Working Capital Requirement
- 15.8 Taxation
- 15.9 Depreciation
16. Financial Analysis
- 16.1 Projected Profit and Loss Account
- 16.2 Projected Cash Flow Statement
- 16.3 Projected Balance Sheet
- 16.4 Liquidity Analysis
- 16.5 Profitability Analysis (Payback, NPV, IRR, ROI)
- 16.6 Break-even Analysis
- 16.7 Debt Service Coverage Ratio (DSCR)
- 16.8 Sensitivity Analysis
- 16.9 Scenario and Uncertainty Analysis
17. Funding and Incentives
- 17.1 Means of Finance and Debt-Equity Structure
- 17.2 Loans and Financial Assistance
- 17.3 Government Schemes and Subsidies (PLI, State Policies)
18. Risk Assessment
- 18.1 Key Success Factors
- 18.2 Key Risk Factors
- 18.3 Risk Mitigation
19. Strategic Recommendations
20. Case Study of a Successful Venture
21. Appendix
- 21.1 Detailed Assumptions
- 21.2 Abbreviations
- 21.3 List of Tables and Figures
- 21.4 Sources
This page vs. the full report
| Data point | On this page (free) | In the full report |
|---|---|---|
| Total CapEx | One rounded range at one capacity | Exact figure at three capacities with a line-item breakup |
| CapEx breakup | Category shares (%) only | Cost, quantity and supplier for every machine |
| Operating cost | Share of raw materials, utilities and labor | Per-unit cost sheet with each input price and consumption |
| Profitability | Gross margin range and payback band | Exact IRR, NPV, ROI, break-even and DSCR |
| Financial statements | List of what is included | 10-year P&L, cash flow, balance sheet and Excel model |
| Sensitivity | One directional line | Full sensitivity and scenario tables |
| Process | Simplified flow diagram | Detailed process flow, mass and energy balance, operating conditions |
| Machinery | Names of the main machines | Specifications, capacity, cost and supplier list |
| Market | Headline size, growth and global demand | Segment, region, trade and price forecast tables |
| Suppliers and buyers | Supplier types and sourcing hubs | Named suppliers and buyers |
Generic Injectables project report: FAQs
How much does it cost to set up a generic injectables plant?
What is the profit margin in generic injectables manufacturing?
What is the payback period for a generic injectables plant?
Which approvals does a generic injectables plant need?
Should a new plant use terminal sterilization or aseptic filling?
Where do generic injectables plants source raw materials?
Who buys generic injectables?

About the analyst
Shweta Bisht, Healthcare & Biotech Analyst
Shweta is a healthcare and biotech researcher with strong analytical skills in chemical and agri domains.
Related market research
- Generic Injectables Market Size, Share, Growth and Forecast 2032
- Sterile Injectables Market Size, Share, Growth and Forecast 2032
- Sterile Injectable Drugs Market Size, Share and Forecast 2032
- Small Molecule Injectable Market Size, Growth and Forecast 2032
- Injectable Liquid Filling Machines Market Size, Share & Forecast 2032
- Sterile Injectable CDMO Market Size, Growth & Forecast 2032
More plant project reports
- Cannabis Processing Plant Project Report (DPR) 2026
- Vinyl Chloride Manufacturing Plant Project Report (DPR) 2026
- Rice Bran Oil Processing Plant Project Report (DPR) 2026
- Neopentyl Glycol Manufacturing Plant Project Report (DPR) 2026
- Citric Acid Manufacturing Plant Project Report (DPR) 2026
- Castor Oil Processing Plant Project Report (DPR) 2026