
Quick answer
A vinyl chloride monomer (VCM) plant cracks ethylene dichloride, made from ethylene and chlorine, into the monomer used for PVC. A greenfield balanced plant of 400,000 metric tons a year with its own chlor-alkali unit needs an estimated USD 1.0–1.8 billion of CapEx. Gross margin of 10–35% tracks VCM, caustic soda, ethylene and power prices. Payback is long, about 15–27 years at mid-range CapEx and 11–19 years at a low-cost site.
Worth building mainly as part of an integrated chlorovinyl chain with captive PVC or long-term offtake and cheap ethylene and power; a merchant VCM plant at 2025 prices pays back slowly.
Vinyl Chloride plant: key highlights
| Parameter | Indicative value | Note |
|---|---|---|
| Plant capacity | 400,000 metric tons a year of VCM | About 1,210 tons a day over 330 days, with a captive chlor-alkali unit of about 234,000 tons of chlorine |
| Total CapEx | USD 1.0–1.8 billion | Greenfield; low end a Middle East or Asian site with a low-cost contractor, top end a U.S. or EU site |
| Raw material share of operating cost | 63–65% | Ethylene and salt; power for electrolysis adds about 17% |
| Gross margin | 10–35% | VCM and caustic soda revenue minus feedstock, energy and direct conversion cost |
| Payback period | 15–27 years | 90% utilization, mid-range CapEx of USD 1.4 billion, strong to central years; about 11–19 years at USD 1.0 billion |
| IRR | Available in report | Post-tax, 10-year model |
| Break-even | Available in report | Capacity utilization basis |
Ranges assume a 400,000-ton-a-year greenfield balanced VCM plant with captive membrane chlor-alkali and pipeline ethylene, Middle East or Asian to U.S. or EU sites, 2026 prices and 90% utilization. Assumed prices: VCM USD 520–620 a ton, caustic soda USD 300–360 a dry ton, ethylene USD 750–820, power USD 60–75 per MWh. CapEx is scaled from disclosed projects with a 0.6 exponent and assumed escalation. Customizable to any country.
What is vinyl chloride?
Vinyl chloride, usually called vinyl chloride monomer or VCM, is the simplest chlorinated alkene, with the formula C2H3Cl. At room temperature it is a colorless, highly flammable gas with a faintly sweet odor, so producers store and ship it as a liquid under pressure. It boils at about minus 13 degrees Celsius and carries about 57% chlorine by weight, which is why every ton of output ties up a large block of chlor-alkali capacity.
Almost all VCM is polymerized into PVC, so the monomer trades mainly between integrated producers or under long-term contracts with stand-alone resin makers. Small volumes go into copolymers for coatings and adhesives. Commercial monomer is sold at 99.9% purity or better, with tight limits on acetylene, butadiene, iron and water, because traces of these slow polymerization and discolor the resin.
Vinyl chloride falls under Harmonized System subheading 2903.21, vinyl chloride (chloroethylene). It is a confirmed human carcinogen linked to angiosarcoma of the liver, which shapes plant design and worker monitoring. Demand follows PVC resin production for pipes, window profiles, cable insulation and flooring.
Vinyl chloride market overview and global demand
Without a separate VCM estimate, demand is best read through PVC. Credence Research values the global polyvinyl chloride market at about USD 72.1 billion in 2025, based on its USD 70.1 billion estimate for 2024 and a 2.85% CAGR, and nearly all of that resin starts as VCM. Capacity sits mainly in China, the U.S. Gulf Coast, Northeast Asia and Western Europe, and only Chinese plants rely heavily on coal-based acetylene. A decarbonization study by George Mason University put U.S. VCM output at almost 8.8 million metric tons in 2019.
Most monomer never leaves the site where it is made, so cross-border trade is small next to output. UN Comtrade data for HS 290321 show reported exports of about 3.2 million tons in both 2024 and 2025, while their value fell from about USD 2.5 billion to USD 2.1 billion as prices slid. The United States shipped about 1.2 million tons in 2025 at an average of about USD 693 per ton and Japan about 880,000 tons at near USD 450, followed by Belgium, South Korea and the Netherlands. Ranked by value, China, India, Colombia, France, the Netherlands, Portugal and Indonesia were the main importers, all with resin plants on purchased monomer.
Pipe and profile demand in South and Southeast Asia keeps resin makers short of monomer, while weak European demand and high energy costs are closing older chlorovinyl units. In China, obligations under the Minamata Convention on Mercury push carbide-route plants to cut mercury catalyst use or switch feedstock, which raises their costs and supports ethylene-based supply.
Vinyl chloride manufacturing process
The reference plant uses the balanced ethylene route, the standard design outside China. A membrane chlor-alkali unit supplies chlorine, and three linked reaction steps consume all the hydrogen chloride released in cracking, so the site neither buys nor sells acid.
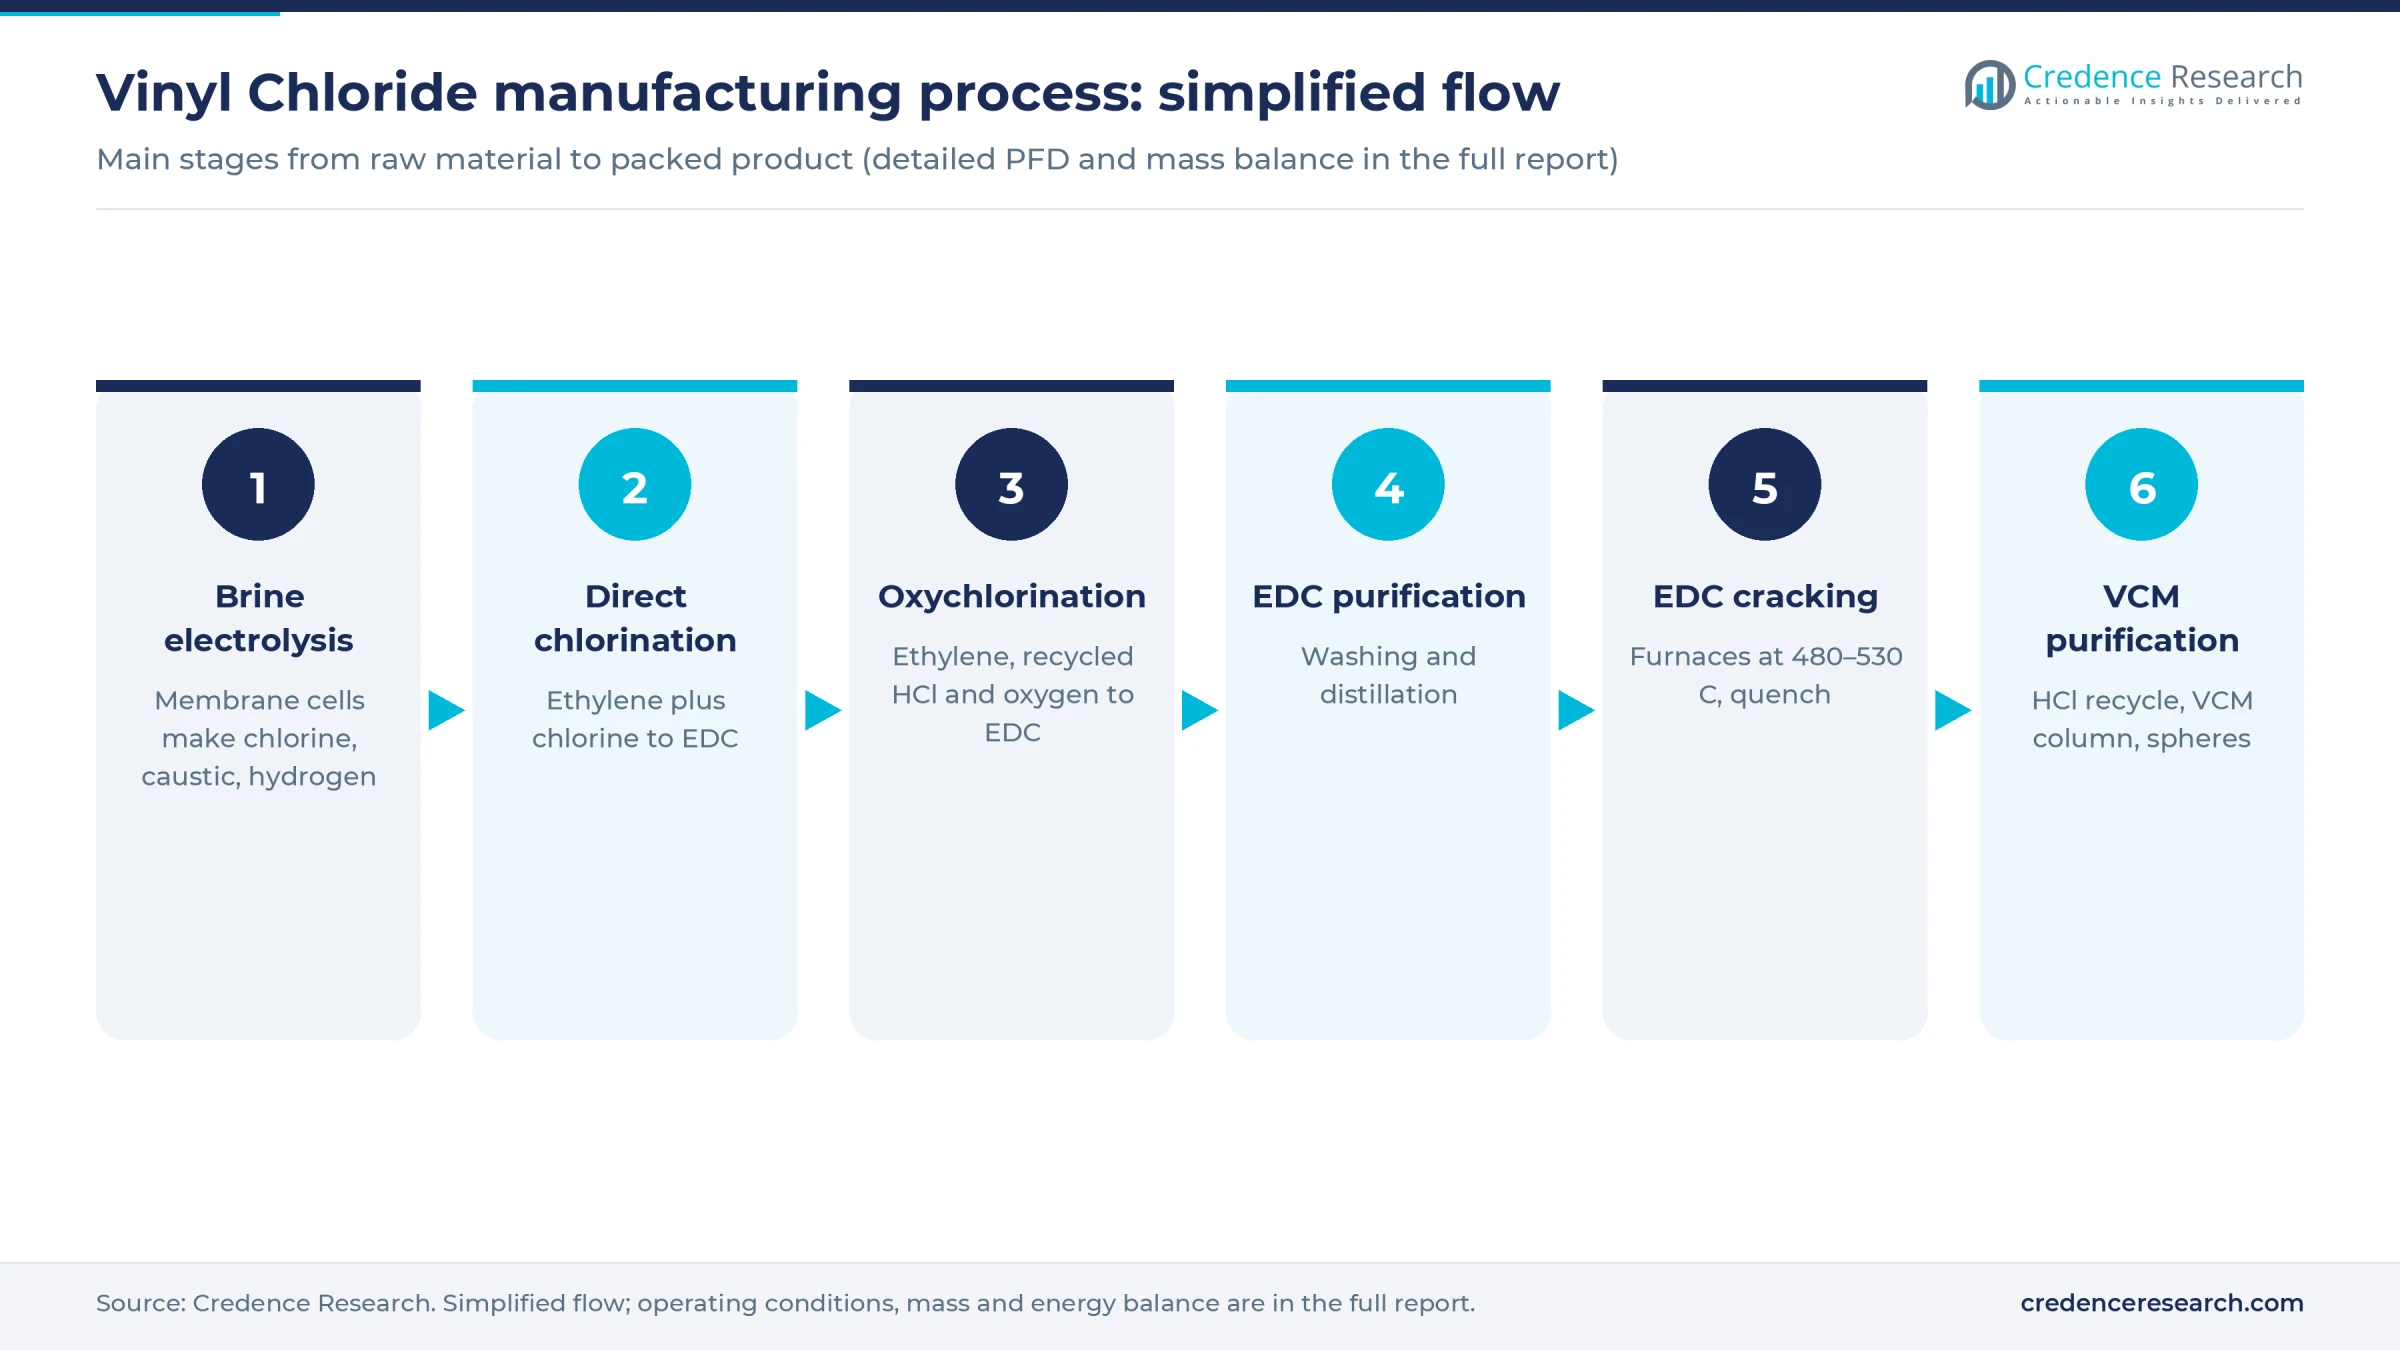
- Brine electrolysis. Purified salt brine is split in membrane cells into chlorine, hydrogen and 32% caustic soda, which is evaporated to the 50% grade most buyers specify.
- Direct chlorination. Ethylene and chlorine react in a loop of liquid ethylene dichloride (EDC) over a ferric chloride catalyst at roughly 50–120 degrees Celsius, giving high-purity EDC with few by-products.
- Oxychlorination. A second ethylene stream reacts with recycled hydrogen chloride and air or oxygen over a copper chloride catalyst, usually in a fluidized bed at about 220–300 degrees Celsius, producing more EDC and water.
- EDC purification. Washing and distillation clean the combined EDC, since impurities speed furnace coking.
- Pyrolysis. Dry EDC is cracked in gas-fired furnaces at about 480–530 degrees Celsius, converting roughly 50–60% per pass into VCM and hydrogen chloride. The hot gas is quenched at once to limit tar and coke.
- VCM purification and storage. A hydrogen chloride column returns acid to oxychlorination, a VCM column delivers monomer of at least 99.9% purity, and unconverted EDC goes back to purification. Product is held in pressurized spheres.
Chlorinated vents go to a thermal oxidizer with acid recovery, and process water passes through a steam stripper before biological treatment. Chinese carbide plants instead react acetylene from calcium carbide with hydrogen chloride over a mercury-based catalyst, a route that depends on cheap coal power and faces tightening mercury rules.
Vinyl chloride plant setup cost
The reference plant produces 400,000 metric tons a year of VCM, about 1,210 tons a day over 330 operating days, with a captive membrane chlor-alkali unit of about 234,000 tons a year of chlorine and ethylene bought by pipeline. Total CapEx is estimated at USD 1.0–1.8 billion, including land, process units, storage, utilities, engineering and working capital.
Shintech's 2018 first phase at Plaquemine, Louisiana, was budgeted at USD 1.49 billion for 270,000 tons a year of caustic soda, a new VCM unit and 290,000 tons of PVC. Removing an assumed USD 180–230 million for the PVC line and scaling the chlor-alkali and VCM block, whose chlorine output matches about 410,000 tons of VCM, gives about USD 1.24–1.29 billion, or USD 1.6–1.8 billion after assumed escalation of 30–40% to 2026. In Abu Dhabi, Ta'ziz awarded a USD 1.99 billion construction contract in November 2025 for a complex combining chlor-alkali, up to 1.2 million tons of EDC, VCM and 350,000 tons of PVC. Scaled to the reference chlorine base and grossed up for owner's costs, it points to about USD 1.0–1.2 billion for a Middle East or Asian site.
For the land row, the complex needs about 250,000 square meters for process units, spheres with safety spacing, tanks and loading. At an assumed USD 20–150 per square meter, from an Asian industrial park to a U.S. Gulf or EU chemical site, land costs USD 5–37.5 million, about 2% of CapEx at the midpoint.
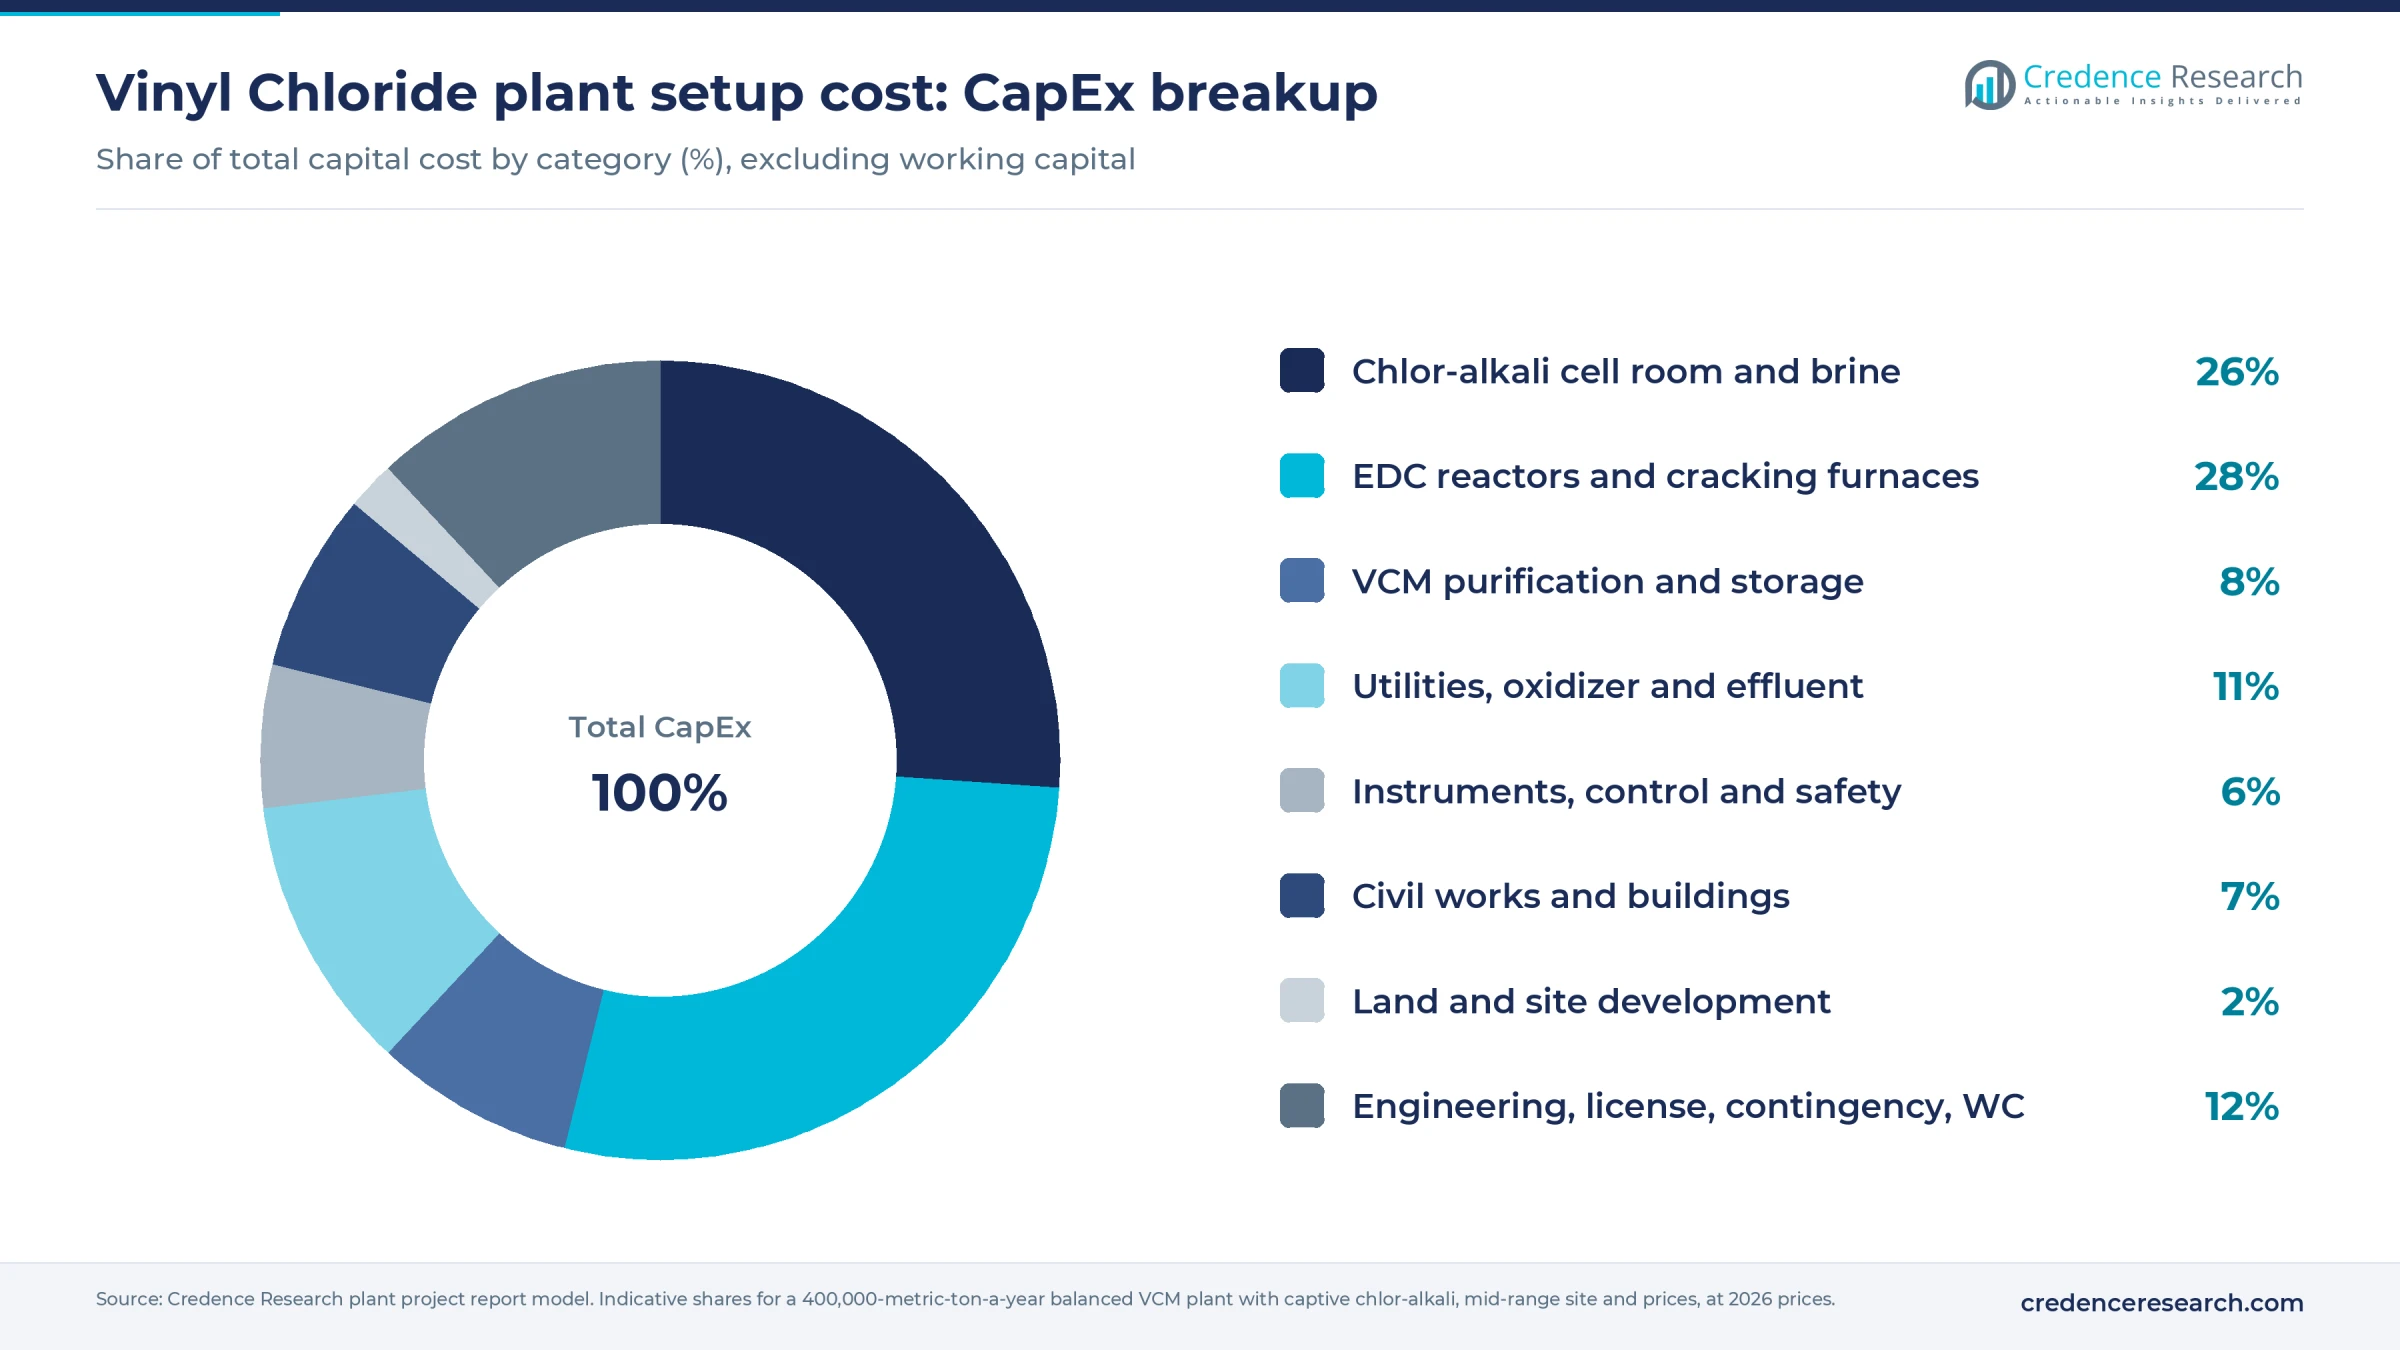
The cell room, brine treatment and rectifiers take about 26% of CapEx, and the two EDC reaction units plus cracking furnaces another 28%.
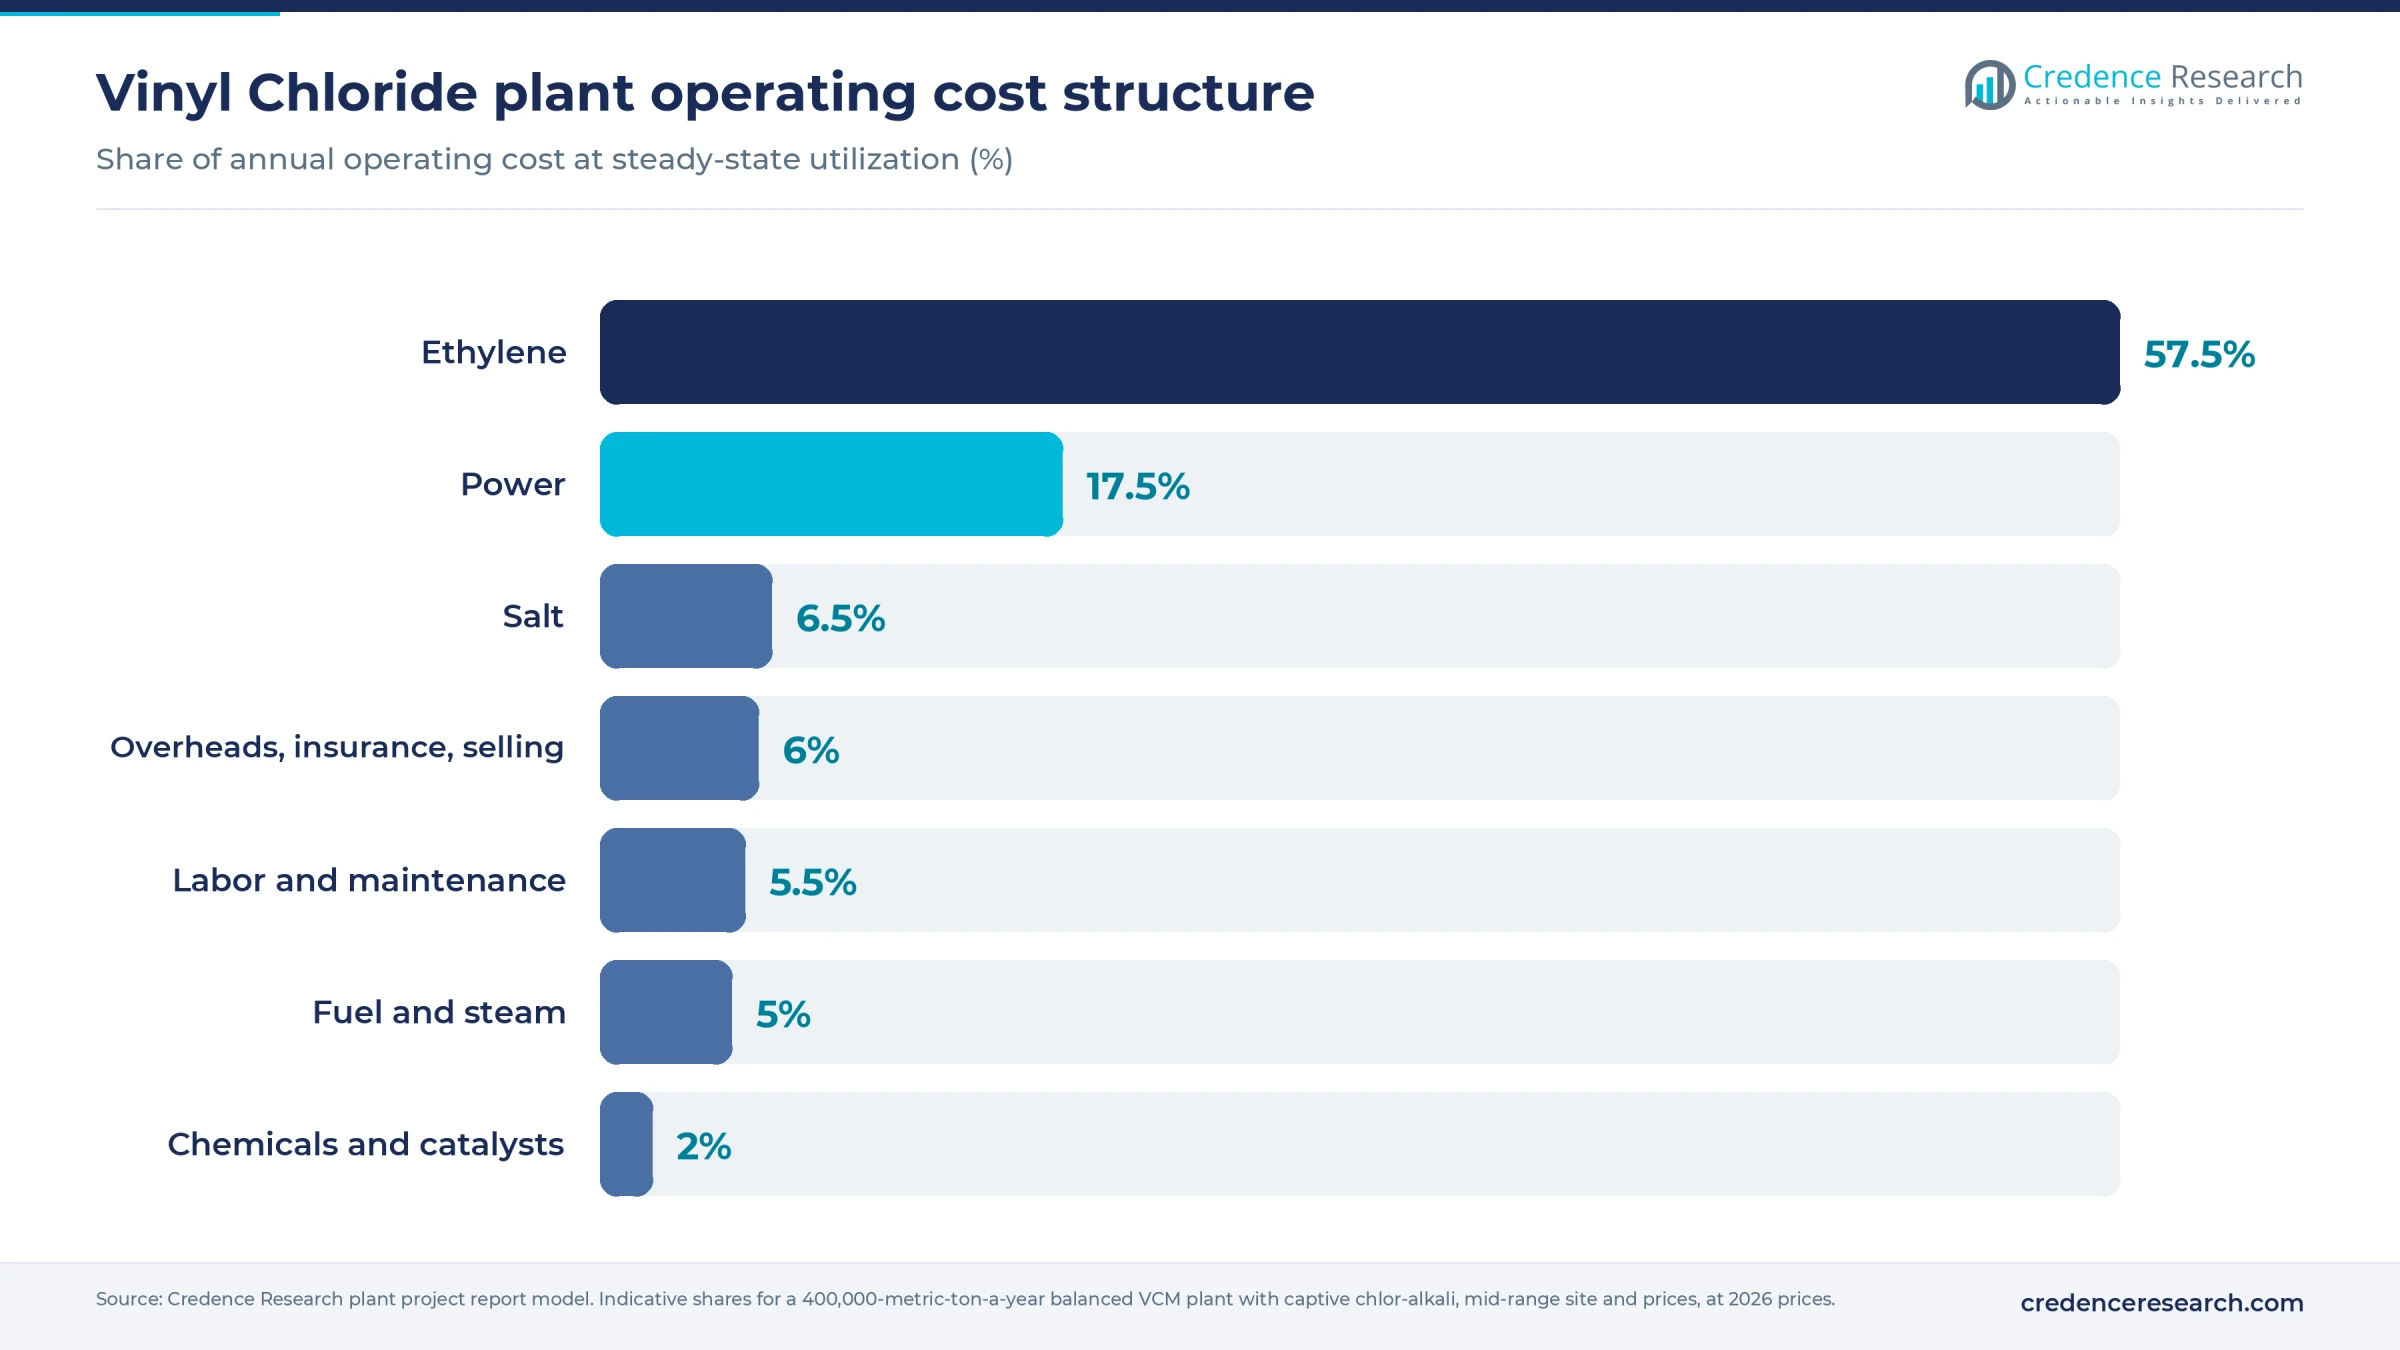
Ethylene is the largest operating cost at about 57%, followed by electricity for electrolysis at about 17%, so feedstock and power contracts decide the economics. The full report can be tailored to any country or region.
Machinery and raw materials for a vinyl chloride plant
Main equipment groups are listed below; ratings are in the report.
- Salt handling, brine saturators and primary and secondary brine purification with ion-exchange columns
- Membrane electrolyzers, transformer-rectifiers, chlorine drying, compression and liquefaction, hydrogen handling and caustic evaporators
- Direct chlorination reactor with circulation loop and ferric chloride dosing
- Fluidized-bed oxychlorination reactor, air or oxygen compressors, catalyst handling and quench system
- EDC washing, drying, light-ends and heavy-ends distillation columns
- Gas-fired EDC cracking furnaces, transfer-line quench, hydrogen chloride and VCM columns
- Pressurized VCM spheres, EDC and caustic tank farm, loading facilities, thermal oxidizer with acid absorption, wastewater strippers, cooling towers and a distributed control and safety system
At 90% utilization the plant uses about 169,000 tons of ethylene, 367,000 tons of salt and roughly 600 gigawatt hours of power a year, and it sells about 238,000 tons of caustic soda alongside its VCM. Ethylene moves mainly by pipeline from crackers on the U.S. Gulf Coast, in the Middle East and in Northeast Asia, and Comtrade lists about 5.3 million tons of cross-border ethylene trade in 2025, led by South Korea, the Netherlands, the United States and Japan. India and Chile lead reported salt exports by volume, alongside rock salt from Germany, the Netherlands and Canada. Caustic soda goes to alumina, pulp and chemical buyers in the caustic soda market.
Vinyl chloride business profit margin and ROI
Gross margin is estimated at 10–35%, measured as VCM and caustic soda revenue minus ethylene, salt, power, fuel and direct conversion costs, as a share of revenue. The build uses an assumed VCM price of USD 520–620 per metric ton, against 2025 export unit values of about USD 450–485 from Japan, South Korea and China and about USD 693 from the United States. Caustic soda is taken at an assumed USD 300–360 per dry ton, and ethylene at an assumed USD 750–820 per ton delivered, against 2025 Asian export unit values of about USD 730–780. Power and salt are assumed at USD 60–75 per megawatt hour and USD 35–50 per ton.
At 90% utilization, or 360,000 tons, central-case revenue is about USD 284 million. Annual cash profit after an assumed USD 12–16 million of overheads ranges from about USD 9 million in a weak year to USD 95 million in a strong one, with about USD 52 million in the central case. On mid-range CapEx of USD 1.4 billion, payback is about 15–27 years in strong to central years, and a low-cost build at USD 1.0 billion shortens that to about 11–19 years.
Each USD 10 per megawatt hour moves annual cost by about USD 6 million, and each USD 50 per ton change in ethylene by about USD 8.5 million.
| Indicator | Result |
|---|---|
| Gross margin | 10–35% |
| Payback period | 15–27 years |
| Post-tax IRR | Available in report |
| Net present value | Available in report |
| Return on investment | Available in report |
| Debt service coverage | Available in report |
| Break-even capacity use | Available in report |
How to start a vinyl chloride business, licenses and approvals
Approvals follow a common sequence: company and tax registration, zoning for major hazard plants, an environmental impact assessment, air and wastewater permits, fire protection for flammable gas storage, process safety and emergency plans, carcinogen exposure monitoring, chemical registration and hazardous materials transport approvals. Because vinyl chloride is a flammable carcinogen, regulators focus on furnace vents, leak detection and sphere spacing.
| Market | Key approvals for a VCM plant |
|---|---|
| United States | State Clean Air Act construction and Title V permits under the EPA vinyl chloride emission standard, 40 CFR Part 61 Subpart F, which covers EDC, VCM and PVC plants, and the chemical manufacturing standard known as the HON, which added fenceline monitoring for vinyl chloride in 2024; the OSHA vinyl chloride standard, 29 CFR 1910.1017, with a 1 ppm eight-hour limit and a 5 ppm 15-minute limit; OSHA process safety management and an EPA risk management program for VCM and chlorine; DOT hazardous materials rules |
| European Union | Integrated permit under the Industrial Emissions Directive, applying best available techniques for large volume organic chemicals, which cover EDC and VCM, and for chlor-alkali, which exclude mercury cells; Seveso III major accident status for VCM, chlorine and ethylene inventories; a binding 1 ppm exposure limit for vinyl chloride monomer under the Carcinogens, Mutagens and Reprotoxic Substances Directive; REACH registration and CLP labeling as a category 1A carcinogen |
| India | Environmental clearance under the EIA Notification 2006; consent to establish and operate from the state pollution control board; PESO licenses for VCM and chlorine storage under the Static and Mobile Pressure Vessels (Unfired) Rules 2016; factory license and an on-site emergency plan under the Factories Act and the MSIHC Rules 1989 |
The air permit and major hazard review usually set the schedule.
Key vinyl chloride manufacturers and recent developments
Westlake, OxyChem, Shin-Etsu through Shintech and Formosa Plastics run the largest ethylene-based VCM chains, mostly in Texas and Louisiana. INEOS Inovyn, Orbia's Vestolit, Kem One, Vynova and Westlake Vinnolit lead in Europe, while Tosoh, LG Chem, Hanwha Solutions and AGC, through Asahimas Chemical and AGC Vinythai, are major Asian producers and exporters. Reliance Industries, Engro Polymer and Chemicals, Qatar Vinyl and SABIC serve South Asia and the Middle East, and Xinjiang Zhongtai Chemical runs large carbide-route plants.
- January 2026: Berkshire Hathaway completed its USD 9.7 billion all-cash purchase of OxyChem, a leading U.S. chlor-alkali and vinyls producer, from Occidental Petroleum.
- March 2026: Shin-Etsu announced up to USD 3.4 billion at Shintech's Plaquemine site for a second ethylene unit of 625,000 tons a year, 500,000 tons of VCM and 310,000 tons of caustic soda, with completion targeted by the end of 2030.
- June 2026: Westlake completed the purchase of a PVC and VCM site at Wilhelmshaven, Germany, which had been in insolvency administration and can make 380,000 tons of PVC a year.
New capital favors integrated chains on the Gulf Coast of the United States, while Europe consolidates.
What's inside the Vinyl Chloride project report PDF
The report runs to 21 chapters. Open a chapter to see its sections.
1. Preface
2. Scope and Methodology
- 2.1 Objectives of the Study
- 2.2 Stakeholders
- 2.3 Research Methodology
- 2.4 Data Sources and Key Assumptions
3. Executive Summary
- 3.1 Market Snapshot
- 3.2 Project at a Glance (Capacity, CapEx, OpEx)
- 3.3 Key Financial Indicators (IRR, NPV, Payback, Break-even)
- 3.4 Feasibility Verdict
4. Product Overview
- 4.1 Vinyl Chloride Definition and Properties
- 4.2 Grades and Specifications (BIS / ISO / ASTM)
- 4.3 HS Code and Classification
- 4.4 Key Applications
- 4.5 Substitutes
5. Global Vinyl Chloride Market
- 5.1 Market Overview
- 5.2 Historical and Current Market Performance (Volume and Value)
- 5.3 Market Breakup by Grade / Type
- 5.4 Market Breakup by End-Use Industry
- 5.5 Market Breakup by Region
- 5.6 Market Drivers, Restraints and Trends
- 5.7 Value Chain Analysis
- 5.8 Market Forecast
6. Target Country Vinyl Chloride Market Analysis
- 6.1 Demand and Supply Analysis
- 6.2 Installed Capacity vs Demand Gap
- 6.3 Import Dependence
- 6.4 Demand Forecast by End-Use
7. Trade Analysis
- 7.1 Imports by Volume, Value and Country
- 7.2 Exports by Volume, Value and Country
- 7.3 Trade Balance and Opportunities
8. Price Analysis
- 8.1 Historical Vinyl Chloride Price Trends by Region
- 8.2 Raw Material / Feedstock Price Trends and Linkage
- 8.3 Price Forecast
- 8.4 Margins Across the Value Chain
9. Competitive Landscape
- 9.1 Market Structure
- 9.2 Key Players and Installed Capacities
- 9.3 Profiles of Key Players
- 9.4 Recent Developments (Expansions, M&A, New Plants)
10. Manufacturing Process and Technology
- 10.1 Comparison of Technology Routes
- 10.2 Selected Route and Process Flow Diagram
- 10.3 Unit Operations Involved
- 10.4 Chemical Reactions Involved
- 10.5 Mass Balance and Raw Material Requirements
- 10.6 Energy Balance
- 10.7 Quality Assurance Criteria and Technical Tests
- 10.8 By-products and Waste Handling
- 10.9 Technology Licensors / Providers
11. Project Details, Requirements and Costs
- 11.1 Land, Location and Site Development
- 11.1.1 Site Selection Criteria
- 11.1.2 Location Analysis
- 11.1.3 Land Requirement and Costs
- 11.1.4 Site Development Costs
- 11.2 Plant Layout
- 11.2.1 Layout Principles
- 11.2.2 Proposed Layout
- 11.2.3 Factors Influencing Layout
- 11.3 Civil Works and Buildings
- 11.4 Plant Machinery
- 11.4.1 Machinery Requirements and Specifications
- 11.4.2 Machinery Costs
- 11.4.3 Machinery Suppliers
- 11.5 Raw Materials
- 11.5.1 Requirements per Tonne of Output
- 11.5.2 Procurement and Sourcing
- 11.5.3 Costs
- 11.5.4 Suppliers
- 11.6 Packaging
- 11.6.1 Packaging Requirements
- 11.6.2 Packaging Costs
- 11.6.3 Packaging Suppliers
- 11.7 Storage and Material Handling
- 11.8 Transportation Requirements and Costs
- 11.9 Utilities
- 11.9.1 Power Requirements and Costs
- 11.9.2 Water Requirements and Costs
- 11.9.3 Steam, Fuel and Other Utilities
- 11.10 Manpower Requirements and Wages
12. Environment, Health, Safety and Sustainability
- 12.1 Effluent and Emissions Management
- 12.2 Hazard Classification and Safety Measures
- 12.3 Carbon Footprint
- 12.4 Green / Low-Carbon Process Options
13. Regulatory Procedures, Approvals and Certifications
- 13.1 Licences and Registrations
- 13.2 Environmental Clearances
- 13.3 Product Certifications (BIS, REACH, etc.)
- 13.4 Approval Timeline
14. Project Implementation Schedule
15. Project Economics
- 15.1 Capital Cost of the Project
- 15.2 Techno-Economic Parameters
- 15.3 Capacity Utilization and Ramp-up
- 15.4 Product Pricing and Margins
- 15.5 Income Projections
- 15.6 Expenditure Projections
- 15.7 Working Capital Requirement
- 15.8 Taxation
- 15.9 Depreciation
16. Financial Analysis
- 16.1 Projected Profit and Loss Account
- 16.2 Projected Cash Flow Statement
- 16.3 Projected Balance Sheet
- 16.4 Liquidity Analysis
- 16.5 Profitability Analysis (Payback, NPV, IRR, ROI)
- 16.6 Break-even Analysis
- 16.7 Debt Service Coverage Ratio (DSCR)
- 16.8 Sensitivity Analysis
- 16.9 Scenario and Uncertainty Analysis
17. Funding and Incentives
- 17.1 Means of Finance and Debt-Equity Structure
- 17.2 Loans and Financial Assistance
- 17.3 Government Schemes and Subsidies (PLI, State Policies)
18. Risk Assessment
- 18.1 Key Success Factors
- 18.2 Key Risk Factors
- 18.3 Risk Mitigation
19. Strategic Recommendations
20. Case Study of a Successful Venture
21. Appendix
- 21.1 Detailed Assumptions
- 21.2 Abbreviations
- 21.3 List of Tables and Figures
- 21.4 Sources
This page vs. the full report
| Data point | On this page (free) | In the full report |
|---|---|---|
| Total CapEx | One rounded range at one capacity | Exact figure at three capacities with a line-item breakup |
| CapEx breakup | Category shares (%) only | Cost, quantity and supplier for every machine |
| Operating cost | Share of raw materials, utilities and labor | Per-unit cost sheet with each input price and consumption |
| Profitability | Gross margin range and payback band | Exact IRR, NPV, ROI, break-even and DSCR |
| Financial statements | List of what is included | 10-year P&L, cash flow, balance sheet and Excel model |
| Sensitivity | One directional line | Full sensitivity and scenario tables |
| Process | Simplified flow diagram | Detailed process flow, mass and energy balance, operating conditions |
| Machinery | Names of the main machines | Specifications, capacity, cost and supplier list |
| Market | Headline size, growth and global demand | Segment, region, trade and price forecast tables |
| Suppliers and buyers | Supplier types and sourcing hubs | Named suppliers and buyers |
Vinyl Chloride project report: FAQs
How much does it cost to set up a vinyl chloride plant?
Why does a VCM plant need a chlor-alkali unit?
What is the profit margin in vinyl chloride manufacturing?
What is the payback period for a VCM plant?
Which approvals does a vinyl chloride plant need?
What is the difference between the ethylene and carbide routes?
Who buys vinyl chloride monomer?

About the analyst
Nisha Gupta, Senior Research Analyst
Nisha Gupta is a Senior Research Analyst at Credence Research Inc. who works across industry domains, including packaging, automotive parts and machinery. Her focus is the modelling engine behind each study: she builds quantitative market databases and econometric forecasting frameworks, and developed automated Excel-based market modelling templates that cut client turnaround time by 30%.
Related market research
- Polyvinyl Chloride Market Size, Share, Growth and Forecast 2032
- Polyvinyl Chloride Resins Market Size, Growth and Forecast 2032
- Caustic Soda Market Size, Share, Growth and Forecast 2032
- Chlorinated Polyvinyl Chloride Market Size, Growth and Forecast 2032
- PVC Compound Market Size, Share, Trends and Forecast 2032
More plant project reports
- Neopentyl Glycol Manufacturing Plant Project Report (DPR) 2026
- Citric Acid Manufacturing Plant Project Report (DPR) 2026
- Castor Oil Processing Plant Project Report (DPR) 2026
- Styrene Manufacturing Plant Project Report (DPR) 2026
- Polyvinyl Chloride Manufacturing Plant Project Report (DPR) 2026
- Phosphoric Acid Manufacturing Plant Project Report (DPR) 2026