
Quick answer
A citric acid plant ferments sugars with the mold Aspergillus niger and purifies the broth into crystals. This overview models a greenfield plant making 30,000 tonnes a year, with estimated CapEx of USD 30–150 million: USD 30–60 million integrated with an existing starch or glucose plant, USD 90–150 million as a standalone international-standard build. Gross margin after feedstock and direct conversion costs is estimated at 15–35%, with payback at 5–12 years for integrated builds.
Viable for starch or sugar processors that can integrate fermentation and sell into regional or duty-protected markets; difficult as a standalone plant competing with Chinese export prices.
Citric Acid plant: key highlights
| Parameter | Indicative value | Note |
|---|---|---|
| Plant capacity | 30,000 tonnes of citric acid per year | About 100 tonnes a day over 300 operating days |
| Total CapEx | USD 30–150 million | USD 30–60 million integrated with an existing starch or glucose plant; USD 90–150 million as a standalone international-standard build |
| Raw material share of operating cost | 55–65% | Carbohydrate feedstock plus lime and sulfuric acid for recovery |
| Gross margin | 15–35% | After feedstock and direct conversion costs, at an assumed USD 1.05–1.35 per kg |
| Payback period | 5–12 years | From commissioning, for integrated builds |
| IRR | Available in report | Post-tax, 10-year model |
| Break-even | Available in report | Capacity utilization basis |
Ranges assume a 30,000 tonnes-per-year greenfield plant, 300 operating days, 85% steady-state utilization and 2026 prices. Carbohydrate cost is an assumed USD 300–480 per tonne of product; blended selling price an assumed USD 1.05–1.35 per kg, set against 2024 UN Comtrade export unit values. CapEx is scaled from disclosed projects and excludes working capital; RUB converted at an assumed 61 per USD for 2022. The full report can be customized to any country or region.
What is citric acid?
Citric acid is a weak tricarboxylic organic acid, C6H8O7, found naturally in lemons and limes but made commercially by fermenting sugars with selected strains of the mold Aspergillus niger. It is sold as white crystals in two forms, anhydrous and monohydrate, plus liquid solutions of about 50% strength, and it is the most widely used acidulant in processed food.
Beverages are the largest outlet, because citric acid adds tartness, balances sweetness and lowers pH so preservatives work better. Confectionery, jams, dairy desserts and canned foods use it for flavor and to stop browning. Outside food, it chelates calcium and magnesium in phosphate-free detergents and dishwasher tablets, cleans boilers and metal, buffers pharmaceutical syrups and effervescent tablets, and adjusts pH in cosmetics. Its salts, chiefly sodium and potassium citrate, are made from the same acid and are covered in the sodium citrate market study. The EU labels it E 330. Citric acid is classified under Harmonized System subheading 2918.14, a code the EU also uses in its trade defense notices on the product.
Citric acid market overview and global demand
Credence Research values the global citric acid market at USD 3.88 billion in 2024, growing at a 4.01% CAGR to USD 5.30 billion by 2032. Carried forward one year at that rate, the 2024 figure implies about USD 4.04 billion in 2025. A narrower segment, covered in the high purity citric acid market report, was valued at USD 1.07 billion in 2024 with a 5.84% CAGR, reflecting tighter specifications for pharmaceutical and other sensitive uses.
Supply is dominated by one country. UN Comtrade records for 2024 show reporting countries exporting about 1.65 million tonnes worth USD 1.52 billion. China shipped about 1.25 million tonnes, roughly three-quarters of the volume, at an average of only USD 0.68 per kg. Thailand followed with about 103,000 tonnes at USD 1.61 per kg, then Belgium with 79,000 tonnes at USD 1.43, Germany, Colombia, the U.S. and the Netherlands.
On the import side, reporters recorded about USD 2.08 billion of purchases in 2024. The U.S. led at USD 425 million, followed by Germany at USD 175 million and about 148,000 tonnes, India at USD 105 million and about 142,000 tonnes, Mexico at USD 102 million, and Italy and France at about USD 70 million each. Totals omit countries that did not report, and several entries lack weights.
The price gap between Chinese and other origins is the defining feature of this market. The U.S. and the EU both keep trade defense duties on Chinese citric acid, which lets producers in North America and Europe sell at higher prices than open markets in Asia, Africa and Latin America. Demand grows with soft drinks, packaged food and phosphate-free cleaning products, and buyers favor suppliers with consistent quality, food safety audits and short lead times.
Citric acid manufacturing process
Almost all commercial citric acid is made by submerged aerobic fermentation followed by recovery and crystallization. The chemistry is mature, so competitiveness comes from fermentation yield, aeration energy and how the plant handles its by-products.
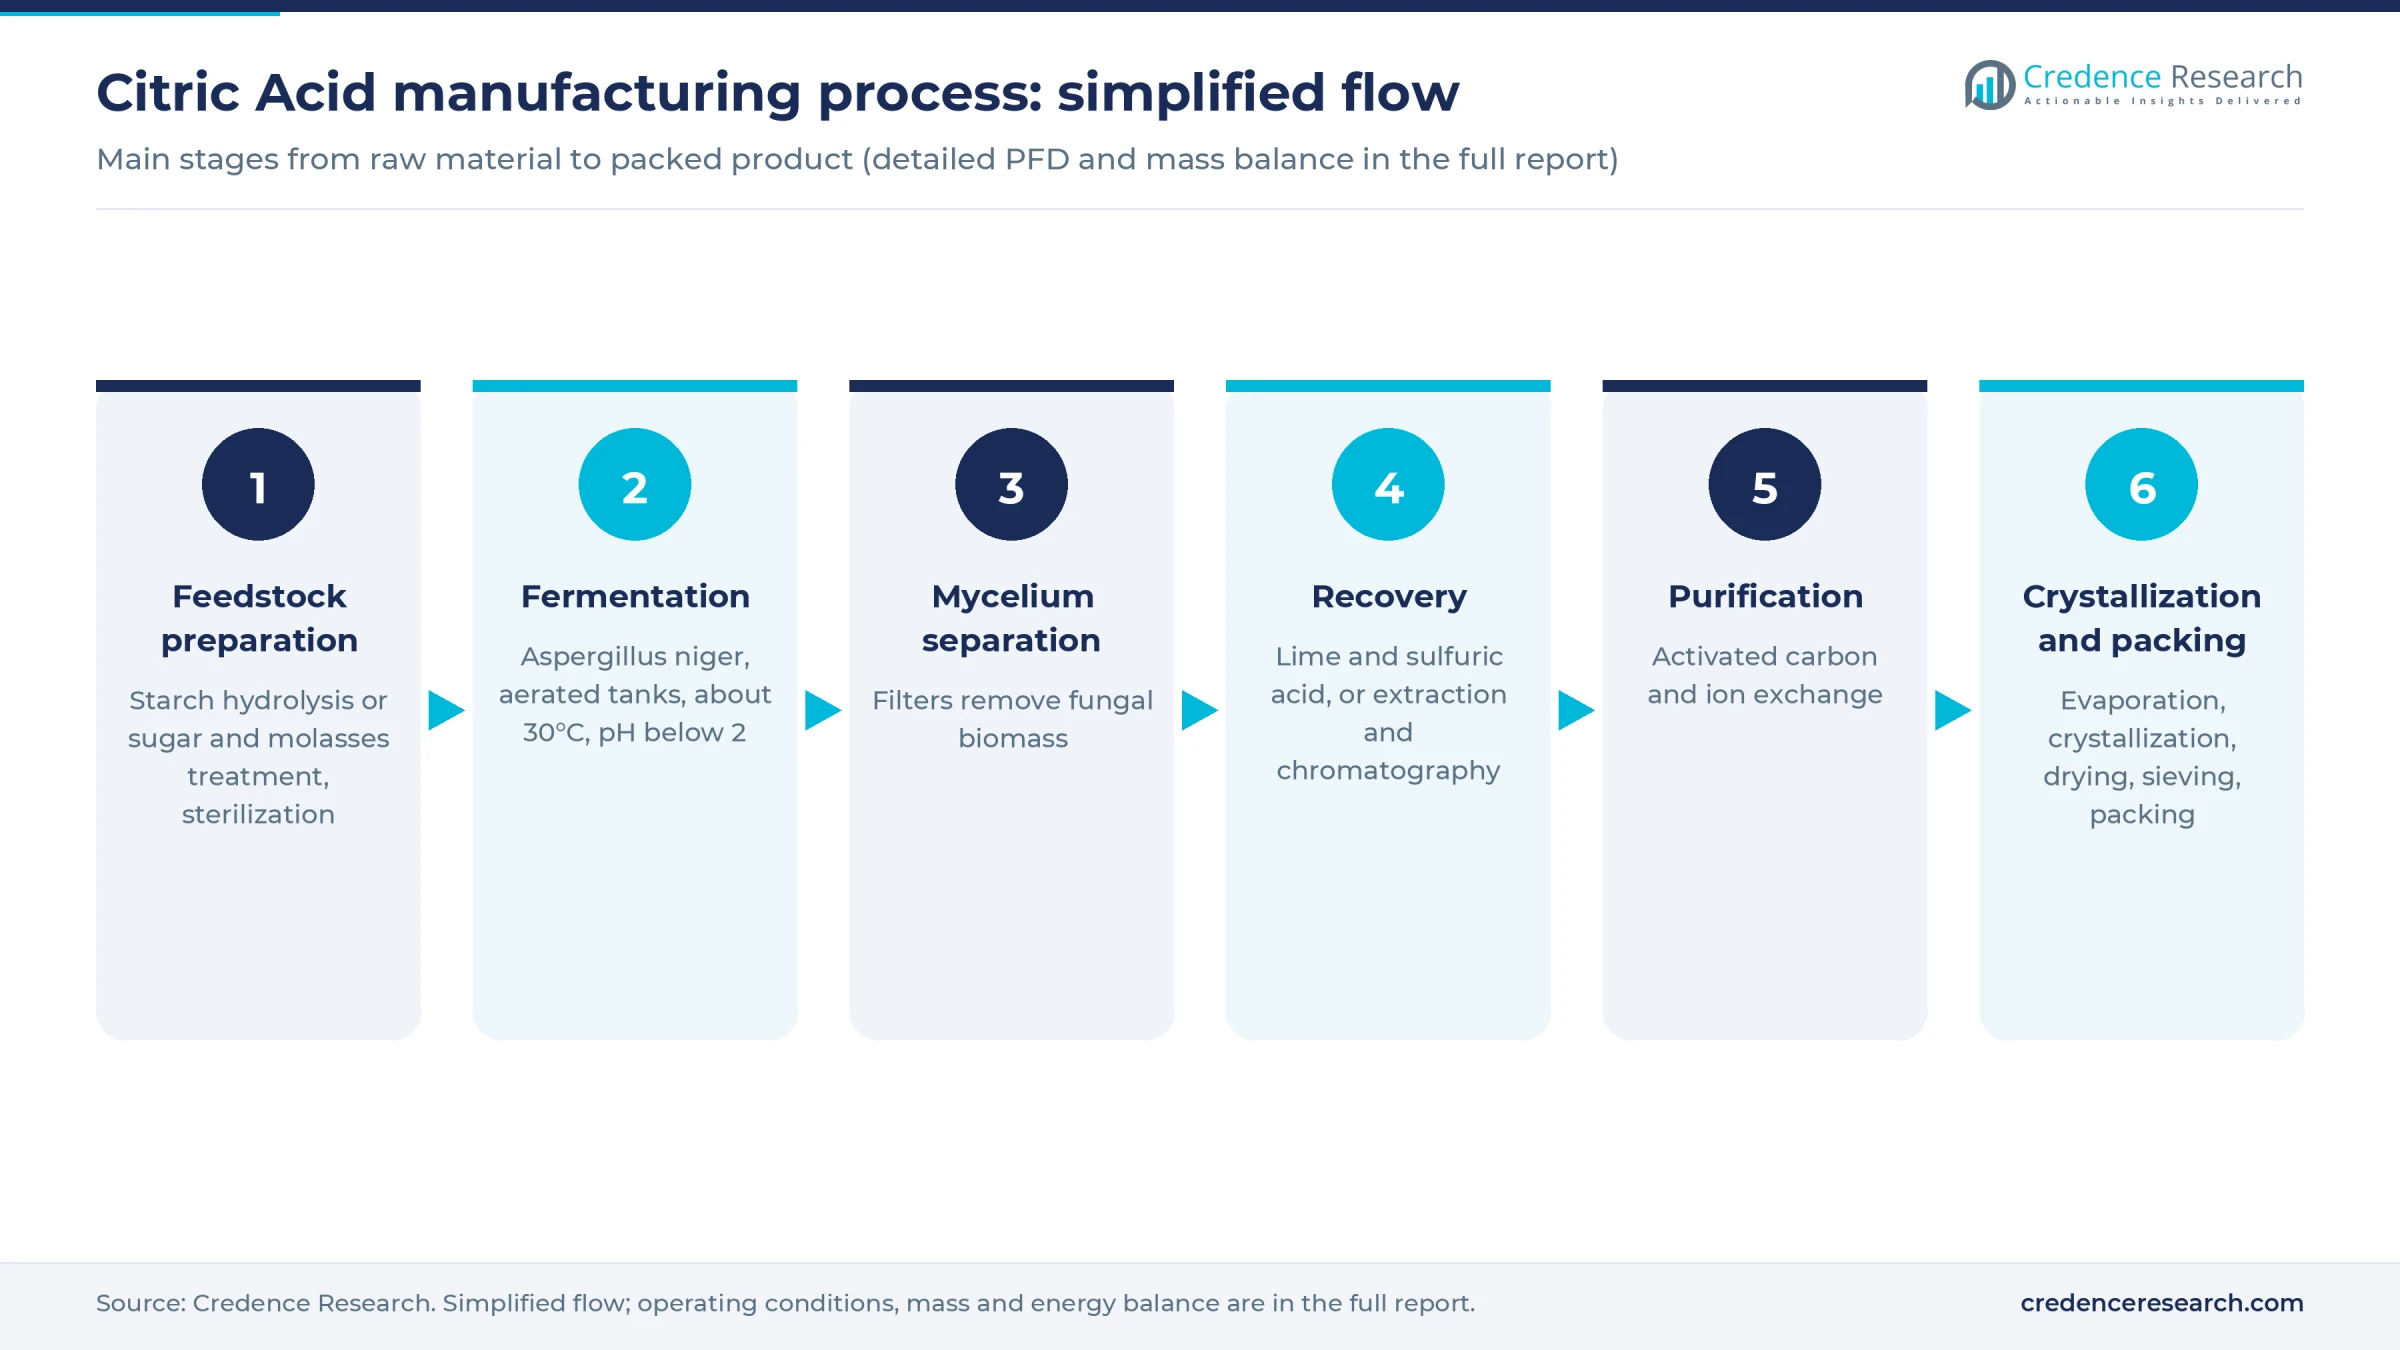
- Feedstock preparation. Corn or cassava is milled and its starch liquefied and saccharified to glucose, or the plant buys glucose syrup, refined sugar or molasses. Molasses needs treatment to remove metal ions that suppress citric acid formation. The medium is sterilized and dosed with nitrogen and phosphate nutrients.
- Fermentation. A selected Aspergillus niger culture is grown in seed tanks and transferred to large stirred or airlift fermenters. Over several days at about 30°C with heavy aeration, the mold converts sugar to citric acid as pH falls below 2. Stoichiometry caps the yield near 1.07 kg of anhydrous acid per kg of glucose, and well-run plants reach an estimated 80–90% of that.
- Mycelium separation. Belt or drum filters remove the fungal biomass, which is dried and sold as feed or disposed of.
- Recovery. In the classic route, lime precipitates calcium citrate, and sulfuric acid then releases citric acid and forms gypsum. A U.S. patent on the process cites about 0.5 kg of lime and 0.8 kg of 95% sulfuric acid per kg of acid, leaving about 2 kg of gypsum. Newer plants use solvent extraction or chromatographic separation to cut chemical use and solid waste.
- Purification. Activated carbon removes color, and cation and anion exchange columns remove residual metals and ions.
- Crystallization and finishing. Evaporators concentrate the liquor, and crystallizers produce monohydrate below about 36°C or anhydrous crystals above it. Centrifuges, dryers and sieves then deliver graded product for packing in bags or bulk.
Gypsum disposal, wastewater with high organic load and aeration power are the three items that most often decide whether a site works.
Citric acid plant setup cost
This overview models a greenfield plant making 30,000 tonnes a year, about 100 tonnes a day, at an estimated total CapEx of USD 30–150 million. The spread reflects two bands: USD 30–60 million integrated with an existing starch or glucose plant, and USD 90–150 million as a standalone international-standard build with its own grain processing, utilities and effluent treatment.
The low end rests on two disclosures. Cairo 3A earmarked about USD 35 million in November 2025 for a 35,000 tonnes-per-year plant beside its maize operations in Egypt, which scales to about USD 32 million. An undated Uzbek government investment profile prices a 20,000-tonne plant at USD 16.4 million, about USD 21 million at this size before escalation. The high end comes from Organic Acids' RUB 19 billion project in Russia's Tula region, announced in 2022 for 70,000 tonnes of citric acid and 10,000 tonnes of lactic acid. Allocated and scaled with a standard capacity exponent, it points to about USD 150 million.
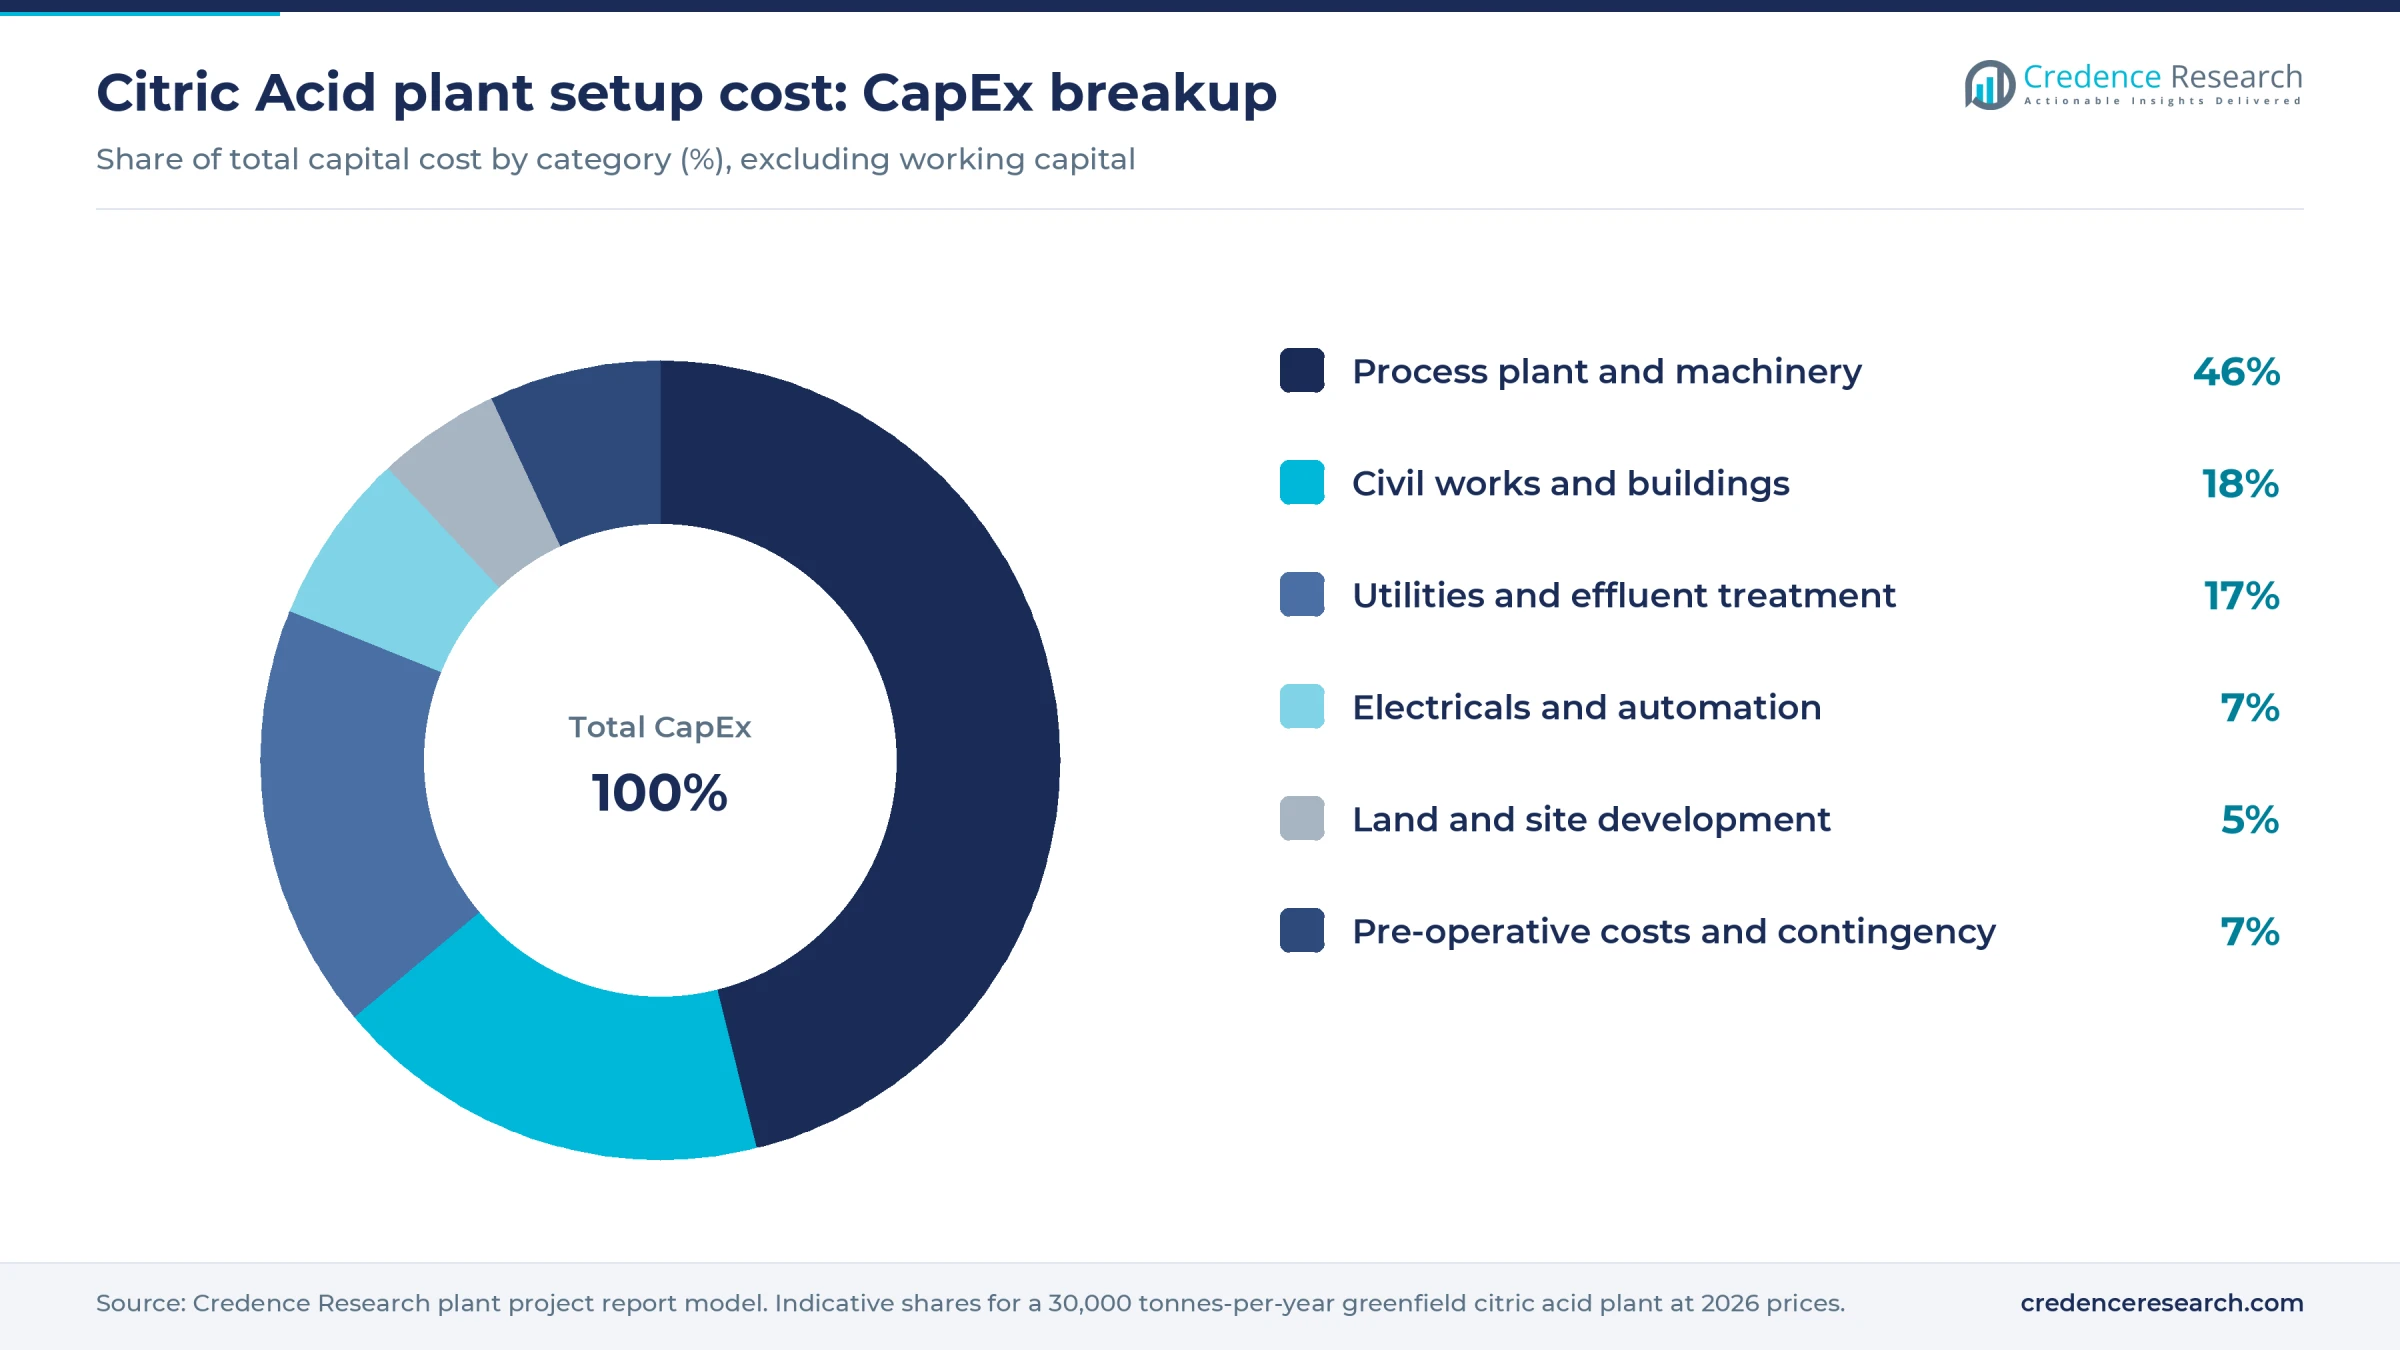
Worked example, land and site development. A 30,000-tonne plant needs an assumed 60,000–100,000 square meters, including gypsum storage and an effluent plant. At an assumed USD 15–50 per square meter in an Asian or Middle Eastern industrial park, the plot costs about USD 0.9–5 million, and at an assumed USD 30–90 at a U.S. or EU site, about USD 1.8–9 million. Site works add an assumed USD 1–2.5 million, so this row runs from about 3% to 15% of CapEx depending on the pairing.
Working capital sits outside CapEx: feedstock stock, finished goods and about two months of receivables tie up an estimated USD 5–8 million.
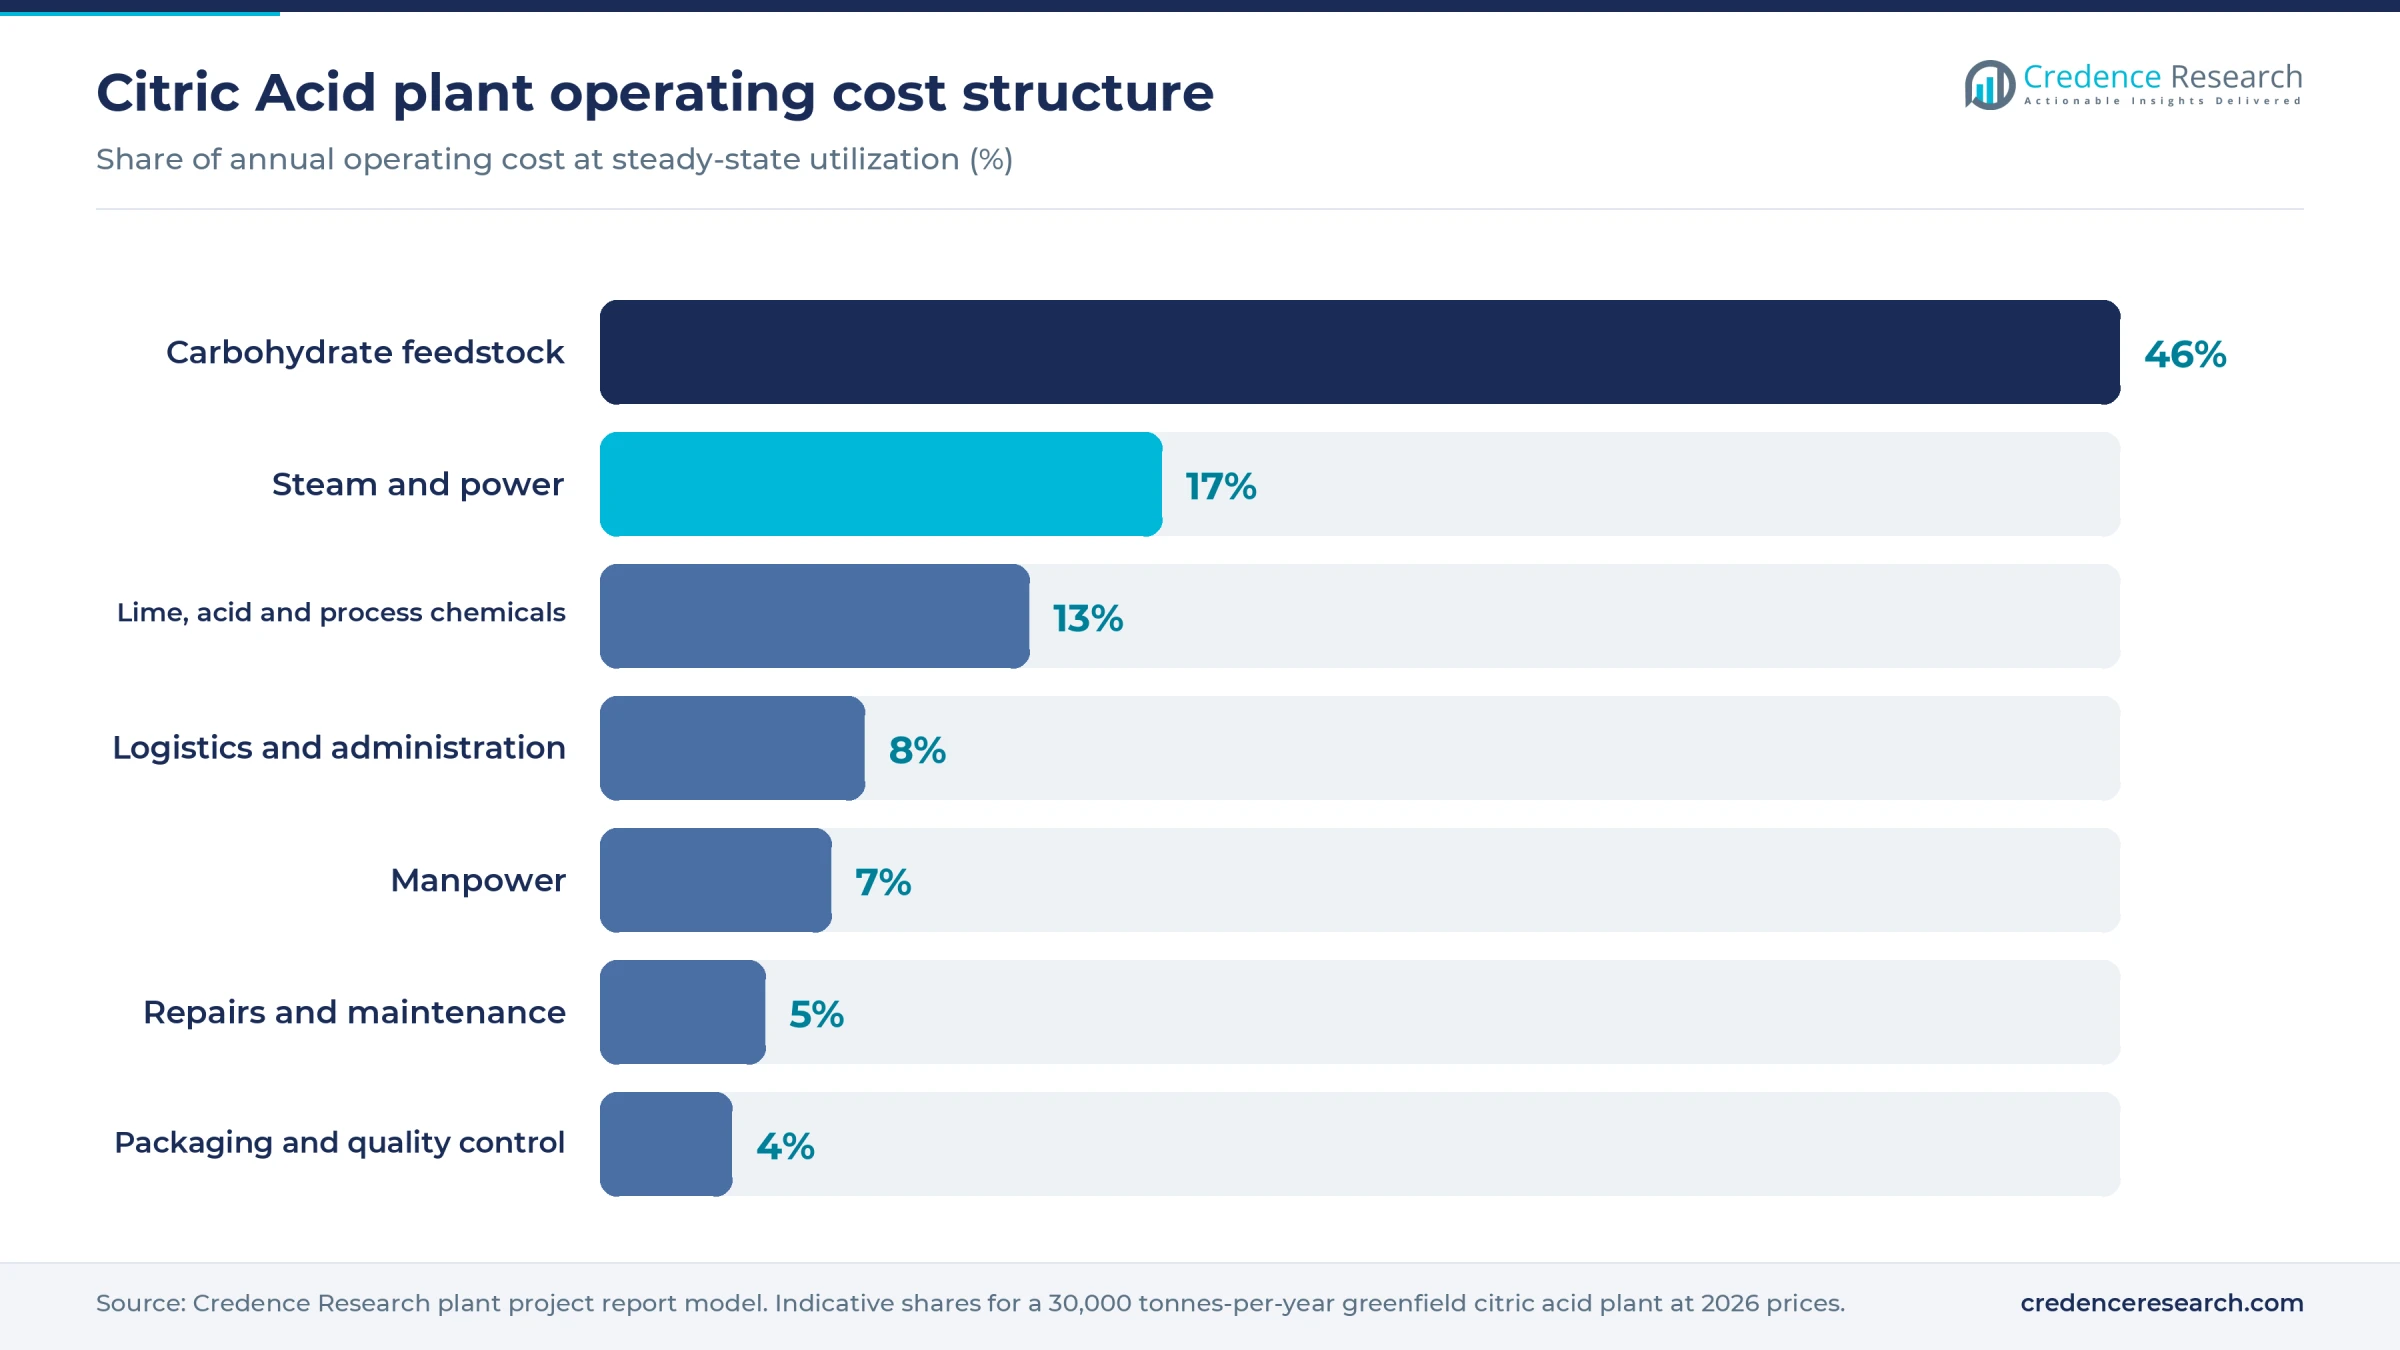
Carbohydrate feedstock is the largest operating cost, followed by steam and power for sterilization, aeration and evaporation. Lime and sulfuric acid add a further block on the classic recovery route.
Machinery and raw materials for a citric acid plant
The main machinery groups are listed below; capacities, specifications and quotations are available in the report.
- Feedstock: corn or cassava mills, liquefaction and saccharification tanks, molasses treatment, continuous sterilizers
- Fermentation: seed fermenters, large production fermenters with air compressors, sterile air filters and cooling coils
- Separation: belt or rotary vacuum filters, biomass dryer
- Recovery: calcium citrate reactors, acidolysis tanks, gypsum filters, or solvent extraction and chromatography units
- Purification and finishing: carbon columns, ion exchange columns, multiple-effect evaporators, crystallizers, centrifuges, fluid bed dryers, sieves, packing line
- Utilities: boilers, cooling towers, water treatment, anaerobic and aerobic effluent treatment, quality laboratory
Fermentable carbohydrate is the critical input, about 1.1–1.3 tonnes of glucose equivalent per tonne of product. Corn is the main source in China and the U.S., the two largest corn producers, with Brazil and Ukraine also large suppliers. Thai producers lean on cassava starch, while plants in Brazil, India, Colombia and Thailand can use cane sugar or molasses. Price swings in corn and sugar pass straight into cost, so plants near cheap starch hold a structural edge. Other inputs are lime, sulfuric acid, nutrient salts, activated carbon, ion exchange resins and packaging. Plants with a starch or dextrose line can also feed the lactic acid market from the same glucose stream.
Citric acid business profit margin and ROI
Citric acid is a commodity, and its margin depends on where the plant sells. For the modeled plant, gross margin after feedstock and direct conversion costs is estimated at 15–35%, at an assumed blended price of USD 1.05–1.35 per kg. Payback is estimated at 5–12 years after commissioning, including ramp-up, for integrated builds and the lower end of standalone builds.
Revenue of about USD 27–34 million a year on 25,500 tonnes must also cover sales, audits and administration, assumed at USD 1.5–3 million a year. An international-standard build near USD 150 million rarely pays back within 15 years at these prices unless it also sells starch by-products or specialty grades. The Uzbek profile's 2.4-year payback looks optimistic against current export prices.
Selling price is the first of three margin drivers: Chinese exports averaged USD 0.68 per kg in 2024, below the estimated cash cost of most plants outside China, so a new plant needs buyers in duty-protected or freight-protected markets where Thai, Belgian and German exports averaged USD 1.4–1.9 per kg. Feedstock is next; a USD 50 per tonne rise in glucose cost that cannot be passed through cuts gross margin by about 5 percentage points. Energy is third, since aeration and evaporation make citric acid one of the more power-hungry food ingredients.
| Metric | Value |
|---|---|
| Project IRR (post-tax) | Available in report |
| NPV | Available in report |
| Return on investment | Available in report |
| DSCR | Available in report |
| Break-even utilization | Available in report |
How to start a citric acid business, licenses and approvals
A citric acid plant needs approvals in six areas wherever it is built. These are business and tax registration; land use, zoning and building permits; an environmental permit covering high-strength wastewater, boiler emissions and gypsum or biomass handling; occupational safety approvals for pressure vessels, acids and dust; food additive, facility and chemical registration; and customs registration for export. Wastewater treatment usually draws the most scrutiny, because fermentation liquor carries a heavy organic load.
| Market | Product and facility | Environment and safety |
|---|---|---|
| United States | FDA food facility registration and 21 CFR 117 preventive controls; citric acid is affirmed as generally recognized as safe under 21 CFR 184.1033; TSCA inventory and Chemical Data Reporting for industrial grades | State air permit; NPDES or local pretreatment permit; OSHA standards for pressure vessels and corrosives |
| European Union | Food business registration under Regulation (EC) No 852/2004; E 330 specifications in Regulation (EU) No 231/2012; REACH registration for non-food uses | Integrated permit under the Industrial Emissions Directive, as citric acid production falls under Annex I activity 4.1(b), organic chemicals including carboxylic acids, produced by chemical or biological processing on an industrial scale |
| India | FSSAI central license, required above 2 tonnes a day of installed capacity; INS 330 specifications under FSSAI additive rules | State pollution control board consents to establish and operate; factory license; boiler registration under the Boilers Act |
Pharmaceutical grades must also meet the U.S., European or other pharmacopoeia monographs, and food and beverage customers commonly require FSSC 22000, kosher and halal certification.
Key citric acid manufacturers and recent developments
Chinese producers such as Weifang Ensign Industry, RZBC Group and COFCO Biotechnology hold most global capacity. Outside China, Jungbunzlauer runs plants in Austria and Canada, Citrique Belge produces in Belgium, Cargill makes citric acid in the U.S., and Sucroal supplies from Colombia, alongside makers in Thailand and new entrants in Egypt and Russia.
- April 2026. The European Commission opened an expiry review of anti-dumping measures on Chinese citric acid, at the request of Citrique Belge and Jungbunzlauer Austria on behalf of EU producers, against measures in place under Implementing Regulation (EU) 2021/607.
- May 2026. The U.S. International Trade Commission voted that revoking duty orders on Chinese citric acid and citrate salts would likely cause renewed injury, and Commerce continued the orders after a third sunset review.
- September 2026. The Commission opened a separate interim review of the same EU measures on Chinese citric acid and trisodium citrate dihydrate, with an investigation period from April 2025 to March 2026, French customs told importers.
Buyers comparing acid options often weigh the wider food acidulants market, where citric acid competes with malic, lactic and phosphoric acids.
What's inside the Citric Acid project report PDF
The report runs to 21 chapters. Open a chapter to see its sections.
1. Preface
2. Scope and Methodology
- 2.1 Objectives of the Study
- 2.2 Stakeholders
- 2.3 Research Methodology
- 2.4 Data Sources and Key Assumptions
3. Executive Summary
- 3.1 Market Snapshot
- 3.2 Project at a Glance (Capacity, CapEx, OpEx)
- 3.3 Key Financial Indicators (IRR, NPV, Payback, Break-even)
- 3.4 Feasibility Verdict
4. Product Overview
- 4.1 Citric Acid Definition and Properties
- 4.2 Grades and Specifications (BIS / ISO / ASTM)
- 4.3 HS Code and Classification
- 4.4 Key Applications
- 4.5 Substitutes
5. Global Citric Acid Market
- 5.1 Market Overview
- 5.2 Historical and Current Market Performance (Volume and Value)
- 5.3 Market Breakup by Grade / Type
- 5.4 Market Breakup by End-Use Industry
- 5.5 Market Breakup by Region
- 5.6 Market Drivers, Restraints and Trends
- 5.7 Value Chain Analysis
- 5.8 Market Forecast
6. Target Country Citric Acid Market Analysis
- 6.1 Demand and Supply Analysis
- 6.2 Installed Capacity vs Demand Gap
- 6.3 Import Dependence
- 6.4 Demand Forecast by End-Use
7. Trade Analysis
- 7.1 Imports by Volume, Value and Country
- 7.2 Exports by Volume, Value and Country
- 7.3 Trade Balance and Opportunities
8. Price Analysis
- 8.1 Historical Citric Acid Price Trends by Region
- 8.2 Raw Material / Feedstock Price Trends and Linkage
- 8.3 Price Forecast
- 8.4 Margins Across the Value Chain
9. Competitive Landscape
- 9.1 Market Structure
- 9.2 Key Players and Installed Capacities
- 9.3 Profiles of Key Players
- 9.4 Recent Developments (Expansions, M&A, New Plants)
10. Manufacturing Process and Technology
- 10.1 Comparison of Technology Routes
- 10.2 Selected Route and Process Flow Diagram
- 10.3 Unit Operations Involved
- 10.4 Chemical Reactions Involved
- 10.5 Mass Balance and Raw Material Requirements
- 10.6 Energy Balance
- 10.7 Quality Assurance Criteria and Technical Tests
- 10.8 By-products and Waste Handling
- 10.9 Technology Licensors / Providers
11. Project Details, Requirements and Costs
- 11.1 Land, Location and Site Development
- 11.1.1 Site Selection Criteria
- 11.1.2 Location Analysis
- 11.1.3 Land Requirement and Costs
- 11.1.4 Site Development Costs
- 11.2 Plant Layout
- 11.2.1 Layout Principles
- 11.2.2 Proposed Layout
- 11.2.3 Factors Influencing Layout
- 11.3 Civil Works and Buildings
- 11.4 Plant Machinery
- 11.4.1 Machinery Requirements and Specifications
- 11.4.2 Machinery Costs
- 11.4.3 Machinery Suppliers
- 11.5 Raw Materials
- 11.5.1 Requirements per Tonne of Output
- 11.5.2 Procurement and Sourcing
- 11.5.3 Costs
- 11.5.4 Suppliers
- 11.6 Packaging
- 11.6.1 Packaging Requirements
- 11.6.2 Packaging Costs
- 11.6.3 Packaging Suppliers
- 11.7 Storage and Material Handling
- 11.8 Transportation Requirements and Costs
- 11.9 Utilities
- 11.9.1 Power Requirements and Costs
- 11.9.2 Water Requirements and Costs
- 11.9.3 Steam, Fuel and Other Utilities
- 11.10 Manpower Requirements and Wages
12. Environment, Health, Safety and Sustainability
- 12.1 Effluent and Emissions Management
- 12.2 Hazard Classification and Safety Measures
- 12.3 Carbon Footprint
- 12.4 Green / Low-Carbon Process Options
13. Regulatory Procedures, Approvals and Certifications
- 13.1 Licences and Registrations
- 13.2 Environmental Clearances
- 13.3 Product Certifications (BIS, REACH, etc.)
- 13.4 Approval Timeline
14. Project Implementation Schedule
15. Project Economics
- 15.1 Capital Cost of the Project
- 15.2 Techno-Economic Parameters
- 15.3 Capacity Utilization and Ramp-up
- 15.4 Product Pricing and Margins
- 15.5 Income Projections
- 15.6 Expenditure Projections
- 15.7 Working Capital Requirement
- 15.8 Taxation
- 15.9 Depreciation
16. Financial Analysis
- 16.1 Projected Profit and Loss Account
- 16.2 Projected Cash Flow Statement
- 16.3 Projected Balance Sheet
- 16.4 Liquidity Analysis
- 16.5 Profitability Analysis (Payback, NPV, IRR, ROI)
- 16.6 Break-even Analysis
- 16.7 Debt Service Coverage Ratio (DSCR)
- 16.8 Sensitivity Analysis
- 16.9 Scenario and Uncertainty Analysis
17. Funding and Incentives
- 17.1 Means of Finance and Debt-Equity Structure
- 17.2 Loans and Financial Assistance
- 17.3 Government Schemes and Subsidies (PLI, State Policies)
18. Risk Assessment
- 18.1 Key Success Factors
- 18.2 Key Risk Factors
- 18.3 Risk Mitigation
19. Strategic Recommendations
20. Case Study of a Successful Venture
21. Appendix
- 21.1 Detailed Assumptions
- 21.2 Abbreviations
- 21.3 List of Tables and Figures
- 21.4 Sources
This page vs. the full report
| Data point | On this page (free) | In the full report |
|---|---|---|
| Total CapEx | One rounded range at one capacity | Exact figure at three capacities with a line-item breakup |
| CapEx breakup | Category shares (%) only | Cost, quantity and supplier for every machine |
| Operating cost | Share of raw materials, utilities and labor | Per-unit cost sheet with each input price and consumption |
| Profitability | Gross margin range and payback band | Exact IRR, NPV, ROI, break-even and DSCR |
| Financial statements | List of what is included | 10-year P&L, cash flow, balance sheet and Excel model |
| Sensitivity | One directional line | Full sensitivity and scenario tables |
| Process | Simplified flow diagram | Detailed process flow, mass and energy balance, operating conditions |
| Machinery | Names of the main machines | Specifications, capacity, cost and supplier list |
| Market | Headline size, growth and global demand | Segment, region, trade and price forecast tables |
| Suppliers and buyers | Supplier types and sourcing hubs | Named suppliers and buyers |
Citric Acid project report: FAQs
How much does it cost to set up a citric acid plant?
What raw material does a citric acid plant use?
What profit margin can a citric acid plant earn?
Why is Chinese citric acid so much cheaper?
Which licenses does a citric acid plant need?
What happens to the gypsum from citric acid production?
Should a new plant make anhydrous or monohydrate citric acid?

About the analyst
Nisha Gupta, Senior Research Analyst
Nisha Gupta is a Senior Research Analyst at Credence Research Inc. who works across industry domains, including packaging, automotive parts and machinery. Her focus is the modelling engine behind each study: she builds quantitative market databases and econometric forecasting frameworks, and developed automated Excel-based market modelling templates that cut client turnaround time by 30%.
Related market research
- Citric Acid Market Size, Growth, Trends, Share and Forecast 2032
- High Purity Citric Acid Market Size, Growth, Share and Forecast 2032
- Sodium Citrate Market Size, Share, Growth and Forecast 2032
- Food Acidulants Market Size, Growth, Analysis and Forecast 2032
- Lactic Acid Market Size, Trends, Share, Growth and Forecast 2032
More plant project reports
- Vinyl Chloride Manufacturing Plant Project Report (DPR) 2026
- Neopentyl Glycol Manufacturing Plant Project Report (DPR) 2026
- Castor Oil Processing Plant Project Report (DPR) 2026
- Styrene Manufacturing Plant Project Report (DPR) 2026
- Polyvinyl Chloride Manufacturing Plant Project Report (DPR) 2026
- Phosphoric Acid Manufacturing Plant Project Report (DPR) 2026