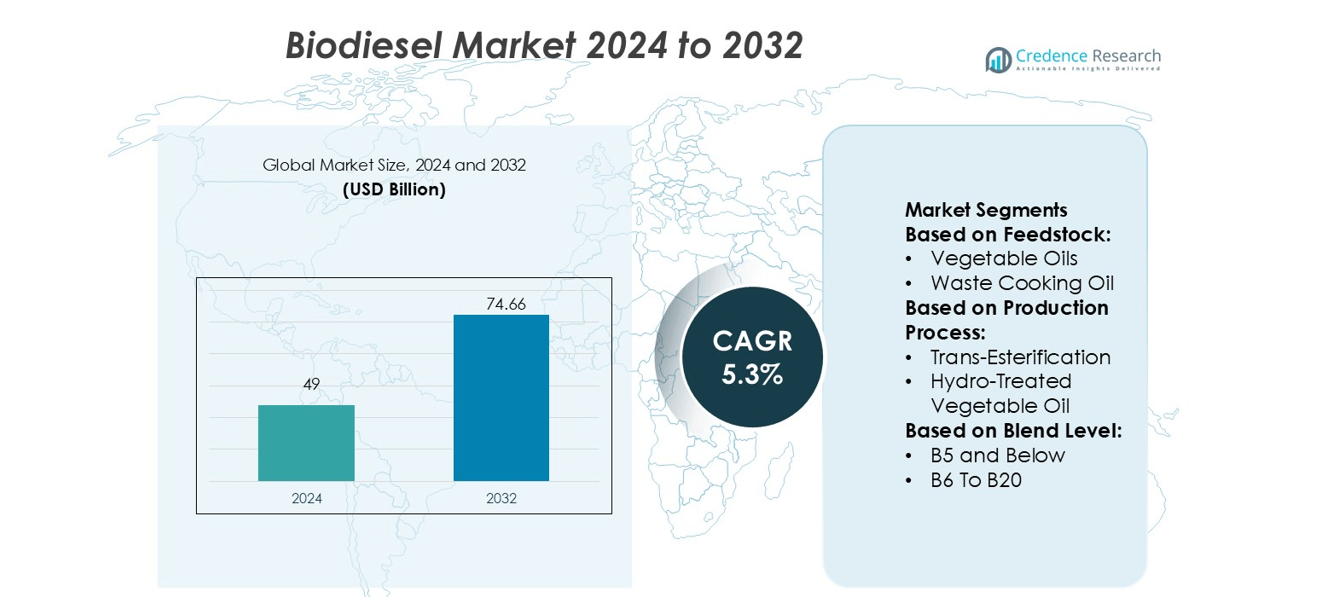
Home » Energy » Oil & Gas » Biodiesel Market

Biodiesel Market By Feedstock Segment (Vegetable Oil, Animal Fats), By Application (Automotive Fuel, Marine Fuel, Agriculture Fuel, Power Generation, Others) – Growth, Future Prospects And Competitive Analysis, 2020 – 2030

Report ID: 3129 | Report Format : Excel, PDF

Market Overview

The biodiesel market exhibits a promising growth trajectory. In 2022, it achieved significant success, generating revenue of USD 31,875 million. This upward trend is projected to persist, with the market value expected to reach USD 54,586.79 million by 2030, reflecting a compound annual growth rate (CAGR) of 7.99% from 2023 to 2030. Biodiesel, a renewable biofuel derived from sources such as vegetable oils and animal fats, is gaining popularity due to its environmental advantages. One notable advantage is its lower greenhouse gas emissions compared to conventional fossil fuels, making it an appealing and sustainable alternative. Additionally, the compatibility of biodiesel with existing diesel engines without requiring modifications highlights its potential to reduce dependence on petroleum products. These factors collectively point towards a robust and steadily expanding market for biodiesel in the years to come.

Biodiesel is gaining significant momentum in terms of market growth and is in alignment with the global agenda for sustainable development. Recognizing the importance of biofuels, including biodiesel, in mitigating climate change and reducing carbon emissions, the United Nations (UN) has set targets for countries to increase their use of renewable energy sources, including biofuels, to achieve the Sustainable Development Goals (SDGs). Furthermore, biodiesel contributes to energy security by reducing reliance on volatile oil prices and promoting domestic production. Consequently, governments are providing increased support and implementing initiatives to develop biodiesel infrastructure and policies.

Market Growth Drivers and Trends

The Asia-Pacific region is leading the biodiesel market, driven by a growing environmental consciousness and supportive government initiatives. Countries like China and India are making significant investments in biofuel production infrastructure to meet their energy needs sustainably. Moreover, the demand for biodiesel in the transport and agriculture industries is increasing due to its cost-effectiveness and reduced carbon footprint.

The market expansion is further fueled by innovation and technological advancements. Improved biodiesel production techniques enhance efficiency and reduce production costs. The waste-to-energy trend, utilizing waste cooking oil and agricultural waste for biodiesel production, is gaining momentum and contributing to market growth.

Stringent environmental regulations worldwide are also promoting the shift towards renewable energy sources, driving the biodiesel market. The global concern over climate change and the goal of achieving carbon neutrality are expected to further boost the biodiesel market in the foreseeable future.

The global biodiesel market is experiencing growth due to the increasing adoption of biodiesel as an alternative to fossil fuels in the automotive and power generation sectors. This shift is driven by the rising awareness of environmental concerns, such as greenhouse gas emissions.

Transportation fuels, including biodiesel, power various vehicles and offer advantages such as non-toxicity, biodegradability, high energy density, and easy transportability. Biodiesel usage results in significant reductions in particulate matter and hydrocarbon emissions. Additionally, biodiesel production reduces wastewater and hazardous waste, while each gallon of biodiesel usage saves four gallons of fossil fuels. The increasing usage of biodiesel as a replacement for fossil fuels in transportation is a significant driving force behind the growth of the biodiesel market.

Industrial fuels, such as power generation and heating oil, find applications across diverse industries. Biodiesel is used as heating oil in commercial and domestic boilers, while B100 blends in power generation help reduce emissions that contribute to smog, ozone, and sulfur. These generators play a crucial role in reducing poisonous emissions in residential areas near schools and hospitals. The growing use of biodiesel to replace conventional fossil fuels in automotive and power generation applications is expected to drive the growth of the biodiesel market.

biodiesel market

Market restraint factors

Despite the positive trends, the growth of the biodiesel market faces several challenges. One of the main obstacles is the volatility of feedstock prices, which significantly impacts biodiesel production costs. The high costs and limited availability of feedstock impede the expansion of the market.

Another constraint is the competition from fossil fuels. Despite the environmental advantages of biodiesel, fossil fuels continue to dominate the global energy market due to their low cost and high efficiency.

Moreover, the biodiesel production process itself can have environmental impacts. Converting land for biofuel crop production can lead to deforestation, biodiversity loss, and soil erosion. Improper management of waste byproducts from biodiesel production can also contribute to water pollution.

Technological limitations pose another challenge. While biodiesel is compatible with existing diesel engines, its performance is affected by cold weather as it tends to gel at lower temperatures. This limits its usability in colder regions.

Policy instability can also hinder market growth. Changes in government policies and regulations related to biofuel use and production create uncertainty for producers and investors. Therefore, supportive and stable policies are crucial for the sustained growth of the biodiesel market.

The COVID-19 pandemic has also impacted the market, particularly in Latin America. In 2020, biodiesel consumption in Argentina, Peru, and Colombia was low due to reduced demand caused by the economic slowdown resulting from the pandemic. In Malaysia, the pandemic affected biodiesel consumption and delayed the implementation of the B20 mandate. In the Middle East and Africa region, the COVID-19 outbreak led to a decline in biodiesel demand due to temporary bans on non-essential item production and limited mobility of goods and personnel.

Access crucial information at unmatched prices!

Request your sample report today & start making informed decisions powered by Credence Research Inc.!

Download Sample

Market Challenges and Opportunities

One of the major challenges is the fluctuating prices of feedstock, which can significantly impact the overall cost of production. Additionally, the battle against climate change mandates the reduction of greenhouse gas emissions, posing both a challenge and an opportunity for biodiesel producers to demonstrate their product’s environmental benefits.

Technological advancements present immense opportunities as they enable the production of higher-quality and more efficient biodiesel. Furthermore, the growing demand for renewable energy globally provides a lucrative market for biodiesel producers. Embracing circular economy principles, such as waste and residue streams for biodiesel production, also offers additional opportunities to enhance sustainability and profitability.

Policy support is another critical factor shaping the future of the biodiesel industry. Supportive policies and regulations can stimulate market growth by encouraging the use of biodiesel and fostering an enabling environment for investments and innovations.

Regulatory Analysis

Government policies and regulations exert a profound influence on the market dynamics of the biodiesel industry. In the United States, for instance, the Renewable Fuel Standard Program incentivizes the adoption of biodiesel to mitigate greenhouse gas emissions. Similarly, the European Union’s Renewable Energy Directive establishes ambitious targets for renewable energy integration in the transportation sector. Moreover, the Fuel Quality Directive mandates a reduction in greenhouse gas intensity within the transport industry, fostering a favorable environment for biodiesel production and utilization. In Asian markets, regulatory backing for biofuels has contributed to the surging demand for biodiesel. In conclusion, regulatory factors play a pivotal role in shaping the growth of the biodiesel market, potentially unlocking novel opportunities for industry stakeholders.

Competitive Analysis

The key players operating in the global biodiesel market are:

  • Archer-Daniels-Midland Company (U.S.)
  • Ag Processing Inc. (U.S.)
  • Avril Group (France)
  • Biodiesel Bilbao S.L. (a subsidiary of Bunge Limited) (Spain)
  • Cargill Inc. (U.S.)
  • Emami Agrotech Ltd. (part of Emami Limited)
  • FutureFuel Chemical Company (U.S.)
  • G-Energetic Biofuels Private Limited (India)
  • Louis Dreyfus Company (Netherlands)
  • Münzer Bioindustrie GmbH (Austria)
  • Renewable Energy Group (U.S.)
  • VERBIO Vereinigte BioEnergie AG (Germany)
  • Wilmar International Limited (Singapore)
  • World Energy LLC (U.S.)

Recent developments and news

  • In November 2022, Technip Energies secured a contract in France from TotalEnergies to produce Sustainable Aviation Fuel (SAF) at the Grandpuits platform. The contract involves EPC assistance for the conversion of the refinery into a zero-crude platform focused on SAF, with a production capacity of approximately 210,000 metric tons per year.
  • In October 2022, Fluor Corporation was awarded a reimbursable front-end engineering and detailed EPC services contract by Imperial for the development of a world-class renewable diesel complex at the Strathcona refinery near Canada.
  • In February 2022, SLD Pumps & Power (SLD) announced the adoption of biodiesel fuel to power its nationwide equipment fleet, displacing the consumption of about 1 million liters of highly polluting mineral diesel annually.
  • In 2019, Archer Daniels Midland Company acquired Algar Agro’s vegetable oil refining business, strengthening its global footprint in the biodiesel industry.
  • In 2020, Neste Corporation launched a renewable diesel product that significantly reduces greenhouse gas emissions, showcasing their innovative approach and commitment to sustainability.
  • In 2019, Renewable Energy Group, Inc. entered into a strategic partnership with Phillips 66 to construct a large-scale renewable diesel plant, further solidifying its position in the biofuel market.
  • In 2018, Bunge Limited made a strategic investment to enhance its biofuel production capabilities, investing in a state-of-the-art biodiesel production plant in the US, demonstrating its commitment to renewable energy.

Segmentation Analysis

By source, the global biodiesel market is categorized as follows:

  • Soybean Oil
  • Corn Oil
  • Canola Oil
  • Animal Fats

Based on the source, the global biodiesel market can be segmented into soybean oil, corn oil, canola oil, and animal fats. In 2020, soybean oil held the largest market share and is projected to maintain its dominance throughout the forecast period. The presence of food manufacturing industries in Europe ensures a steady supply of soybean oil as a feedstock for biodiesel, which is expected to drive segment growth from 2024 to 2030. Corn oil is anticipated to be the fastest-growing segment among all sources. The increasing production of corn oil products facilitates the availability of corn oil feedstock, driving the growth of the segment during the forecast period.

Based on the application, the global biodiesel market is segmented as follows:

  • Transportation Fuel
  • Power Generation
  • Others

Shape Your Report to Specific Countries or Regions & Enjoy 30% Off!

Based on the application, the global biodiesel market can be segmented into transportation fuels, power generation, and others. In 2021, transportation was observed as the largest application segment and is projected to maintain its dominance throughout the forecast period. The growing use of biodiesel as fuel in automobiles, railroads, marine vessels, mining, etc., coupled with favorable regulatory initiatives taken by governments to promote the production and use of biofuels, is expected to drive the growth of the segment. The power generation segment is anticipated to account for a significant share of the global biodiesel market and is expected to witness significant growth during the forecast period. The increasing inclination to reduce dependency on fossil fuels is projected to spur the growth of the segment from 2024 to 2030.

For the purpose of this study, the global biodiesel market is categorized as follows:

  • North America
  • Europe
  • Asia Pacific
  • Latin America (LATAM)
  • Middle East and Africa (MEA)

By geography, the global biodiesel market can be segmented into North America, Europe, Asia Pacific, Latin America, the Middle East, and Africa. In 2021, Europe held the largest market share and is projected to maintain its dominance throughout the forecast period. Increasing investment in biodiesel production, along with growing regulatory support for biodiesel blending in diesel, especially in countries such as Germany, Greece, Russia, Poland, the Czech Republic, and Serbia, is anticipated to drive market growth in Europe. The region is expected to witness robust growth in biodiesel demand. North America followed in second place and accounted for a significant share of the global biodiesel market in 2021. The increasing production of biodiesel in the U.S., coupled with factors such as growing access to foreign biodiesel, the biodiesel tax credit, favorable blending economics, and renewable fuel standards, is anticipated to drive the demand for biodiesel in the country from 2024 to 2030.

Table of Content

Chapter No. 1 : Introduction 19

1.1.      Report Description. 19

1.1.1.    Purpose of the Report 19

1.1.2.    USP & Key Offerings. 19

1.2.      Key Benefits for Stakeholders. 19

1.3.      Target Audience. 20

1.4.      Report Scope  21

Chapter No. 2 : Executive Summary. 23

2.1.      Biodiesel Market Snapshot. 23

2.2.      Global Biodiesel Market, 2017 – 2022 (USD Million) 24

Chapter No. 3 : Impact Analysis of COVID 19 & Russia-Ukraine War on Biodiesel Market. 25

3.1.      Impact Assessment of COVID-19 Pandemic, By Region. 25

3.1.1.    Supply chain disruptions. 25

3.1.2.    Demand fluctuations. 25

3.1.3.    Shift in product mix. 25

3.1.4.    Reduced industrial activity. 25

3.1.5.    Temporary disruptions and delays. 25

3.1.6.    Shift in focus towards essential services. 25

3.2.      Russia-Ukraine War Impacts. 26

3.2.1.    Uncertainty and economic instability. 26

3.2.2.    Supply chain disruptions. 26

3.2.3.    Regional market shifts. 26

3.2.4.    Shift in government priorities. 26

Chapter No. 4 : Biodiesel Market – Industry Analysis. 27

4.1.      Introduction  27

4.2.      Market Drivers  28

4.2.1.    Driving Factor 1 Analysis. 28

4.2.2.    Driving Factor 2 Analysis. 29

4.3.      Market Restraints. 30

4.3.1.    Restraining Factor Analysis. 30

4.4.      Market Opportunities. 31

4.4.1.    Market Opportunity Analysis. 31

4.5.      Porter’s Five Forces Analysis. 32

4.6.      Value Chain Analysis. 33

4.7.      Buying Criteria  34

Chapter No. 5 : Analysis Competitive Landscape. 35

5.1.      Company Market Share Analysis – 2022. 35

5.1.1.    Global Biodiesel Market: Company Market Share, by Revenue2022. 35

5.1.2.    Global Biodiesel Market: Top 6 Company Market Share, by Revenue2022. 35

5.1.3.    Global Biodiesel Market: Top 3 Company Market Share, by Revenue2022. 36

5.1.      Global Biodiesel Market Company Revenue Market Share, 2022. 37

5.2.      Company Assessment Metrics, 2022. 38

5.2.1.    Stars  38

5.2.2.    Emerging Leaders. 38

5.2.3.    Pervasive Players. 38

5.2.4.    Participants. 38

5.3.      Start-ups /SMEs Assessment Metrics, 2022. 38

5.3.1.    Progressive Companies. 38

5.3.2.    Responsive Companies. 38

5.3.3.    Dynamic Companies. 38

5.3.4.    Starting Blocks. 38

5.4.      Strategic Developments. 39

5.4.1.    Acquisitions & Mergers. 39

5.4.2.    New Product Launch. 39

5.4.3.    Regional Expansion. 39

5.5.      Key Players Product Matrix. 40

Chapter No. 6 : PESTEL & Adjacent Market Analysis. 41

6.1.      PESTEL  41

6.1.1.    Political Factors. 41

6.1.2.    Economic Factors. 41

6.1.3.    Social Factors. 41

6.1.4.    Technological Factors. 41

6.1.5.    Environmental Factors. 41

6.1.6.    Legal Factors. 41

6.2.      Adjacent Market Analysis. 41

Chapter No. 7 : Biodiesel Market – By Feedstock Segment Analysis. 42

7.1.      Biodiesel Market Overview, by Feedstock Segment. 42

7.1.1.    Biodiesel Market Revenue Share, By Feedstock, 2022 & 2030. 43

7.1.2.    Biodiesel Market Attractiveness Analysis, By Feedstock. 44

7.1.3.    Incremental Revenue Growth Opportunity, by Feedstock, 2023 – 2030. 44

7.1.4.    Biodiesel Market Revenue, By Feedstock, 2017, 2022, 2026 & 2030. 45

7.2.      Vegetable Oil 46

7.2.1.    Global Vegetable Oil Biodiesel Market Revenue, By Region, 2017 – 2022 (USD Million) 47

7.2.2.    Global Vegetable Oil Biodiesel Market Revenue, By Region, 2017 – 2022 (USD Million) 47

7.3.      Animal Fats  48

7.3.1.    Global Animal Fats Biodiesel Market Revenue, By Region, 2017 – 2022 (USD Million) 49

7.3.2.    Global Animal Fats Biodiesel Market Revenue, By Region, 2017 – 2022 (USD Million) 49

Chapter No. 8 : Biodiesel Market – By Application Segment Analysis. 50

8.1.      Biodiesel Market Overview, by Application Segment. 50

8.1.1.    Biodiesel Market Revenue Share, By Application, 2022 & 2030. 51

8.1.2.    Biodiesel Market Attractiveness Analysis, By Application. 52

8.1.3.    Incremental Revenue Growth Opportunity, by Application, 2023 – 2030. 52

8.1.4.    Biodiesel Market Revenue, By Application, 2017, 2022, 2026 & 2030. 53

8.2.      Automotive Fuel 54

8.2.1.    Global Automotive Fuel Biodiesel Market Revenue, By Region, 2017 – 2022 (USD Million) 55

8.2.2.    Global Automotive Fuel Biodiesel Market Revenue, By Region, 2017 – 2022 (USD Million) 55

8.3.      Marine Fuel 56

8.3.1.    Global Marine Fuel Biodiesel Market Revenue, By Region, 2017 – 2022 (USD Million) 57

8.3.2.    Global Marine Fuel Biodiesel Market Revenue, By Region, 2017 – 2022 (USD Million) 57

8.4.      Agriculture Fuel 58

8.4.1.    Global Agriculture Fuel Biodiesel Market Revenue, By Region, 2017 – 2022 (USD Million) 59

8.4.2.    Global Agriculture Fuel Biodiesel Market Revenue, By Region, 2017 – 2022 (USD Million) 59

8.5.      Power Generation. 60

8.5.1.    Global Power Generation Biodiesel Market Revenue, By Region, 2017 – 2022 (USD Million) 61

8.5.2.    Global Power Generation Biodiesel Market Revenue, By Region, 2017 – 2022 (USD Million) 61

8.6.      Others  62

8.6.1.    Global Others Biodiesel Market Revenue, By Region, 2017 – 2022 (USD Million) 63

8.6.2.    Global Others Biodiesel Market Revenue, By Region, 2017 – 2022 (USD Million) 63

Chapter No. 9 : Biodiesel Market – Regional Analysis. 64

9.1.      Biodiesel Market Overview, by Regional Segments. 64

9.2.      Region  65

9.2.1.    Global Biodiesel Market Revenue Share, By Region, 2022 & 2030. 65

9.2.2.    Biodiesel Market Attractiveness Analysis, By Region. 66

9.2.3.    Incremental Revenue Growth Opportunity, by Region, 2023 – 2030. 66

9.2.4.    Biodiesel Market Revenue, By Region, 2017, 2022, 2026 & 2030. 67

9.2.5.    Global Biodiesel Market Revenue, By Region, 2017 – 2022 (USD Million) 68

9.2.6.    Global Biodiesel Market Revenue, By Region, 2023 – 2030 (USD Million) 68

9.3.      Feedstock  69

9.3.1.    Global Biodiesel Market Revenue, By Feedstock, 2017 – 2022 (USD Million) 69

9.3.2.    Global Biodiesel Market Revenue, By Feedstock, 2023 – 2030 (USD Million) 69

9.4.      Application  70

9.4.1.    Global Biodiesel Market Revenue, By Application, 2017 – 2022 (USD Million) 70

9.4.2.    Global Biodiesel Market Revenue, By Application, 2023 – 2030 (USD Million) 70

Chapter No. 10 : Biodiesel Market – North America 71

10.1.    North America  71

10.1.    Key Highlights  71

10.1.1.  North America Biodiesel Market Revenue, By Country, 2017 – 2022 (USD Million) 72

10.1.2.  North America Biodiesel Market Revenue, By Feedstock, 2017 – 2022 (USD Million) 73

10.1.3.  North America Biodiesel Market Revenue, By Application, 2017 – 2022 (USD Million) 74

10.1.4.  U.S. 75

10.1.5.  Canada  75

10.1.6.  Mexico  75

Chapter No. 11 : Biodiesel Market – Europe. 76

11.1.    Europe  76

11.2.    Key Highlights  76

11.2.1.  Europe Biodiesel Market Revenue, By Country, 2017 – 2022 (USD Million) 77

11.2.2.  Europe Biodiesel Market Revenue, By Feedstock, 2017 – 2022 (USD Million) 78

11.2.3.  Europe Biodiesel Market Revenue, By Application, 2017 – 2022 (USD Million) 79

11.2.4.  UK  80

11.2.5.  France  80

11.2.6.  Germany. 80

11.2.7.  Italy  80

11.2.8.  Spain  80

11.2.9.  Russia  80

11.2.10.            BENELUX. 80

11.2.11.            Sweden. 80

11.2.12.            Denmark. 80

11.2.13.            Poland. 80

11.2.14.            Austria. 80

11.2.15.            Rest of Europe. 80

Chapter No. 12 : Biodiesel Market – Asia Pacific. 81

12.1.    Asia Pacific  81

12.2.    Key Highlights  81

12.2.1.  Asia Pacific Biodiesel Market Revenue, By Country, 2017 – 2022 (USD Million) 82

12.2.2.  Asia Pacific Biodiesel Market Revenue, By Feedstock, 2017 – 2022 (USD Million) 83

12.2.3.  Asia Pacific Biodiesel Market Revenue, By Application, 2017 – 2022 (USD Million) 84

12.2.4.  China  85

12.2.5.  Japan  85

12.2.6.  South Korea. 85

12.2.7.  India  85

12.2.8.  Thailand. 85

12.2.9.  Indonesia. 85

12.2.10.            Vietnam 85

12.2.11.            Malaysia. 85

12.2.12.            Philippines. 85

12.2.13.            Taiwan. 85

12.2.14.            Rest of Asia Pacific. 85

Chapter No. 13 : Biodiesel Market – Latin America 86

13.1.    Latin America  86

13.2.    Key Highlights  86

13.2.1.  Latin America Biodiesel Market Revenue, By Country, 2017 – 2022 (USD Million) 87

13.2.2.  Latin America Biodiesel Market Revenue, By Feedstock, 2017 – 2022 (USD Million) 88

13.2.3.  Latin America Biodiesel Market Revenue, By Application, 2017 – 2022 (USD Million) 89

13.2.4.  Brazil 90

13.2.5.  Argentina. 90

13.2.6.  Colombia. 90

13.2.7.  Chile  90

13.2.8.  Peru  90

13.2.9.  Rest of Latin America. 90

Chapter No. 14 : Biodiesel Market – Middle East. 91

14.1.    The Middle-East. 91

14.2.    Key Highlights  91

14.2.1.  Middle East Biodiesel Market Revenue, By Country, 2017 – 2022 (USD Million) 92

14.2.2.  Middle East Biodiesel Market Revenue, By Feedstock, 2017 – 2022 (USD Million) 93

14.2.3.  Middle East Biodiesel Market Revenue, By Application, 2017 – 2022 (USD Million) 94

14.2.4.  GCC Countries. 95

14.2.5.  Israel 95

14.2.6.  Turkey  95

14.2.7.  Iran  95

14.2.8.  Rest of Middle East & Africa. 95

Chapter No. 15 : Biodiesel Market – Africa 96

15.1.    Africa  96

15.2.    Key Highlights  96

15.2.1.  Africa Biodiesel Market Revenue, By Country, 2017 – 2022 (USD Million) 97

15.2.2.  Africa Biodiesel Market Revenue, By Feedstock, 2017 – 2022 (USD Million) 98

15.2.3.  Africa Biodiesel Market Revenue, By Application, 2017 – 2022 (USD Million) 99

15.2.4.  South Africa. 100

15.2.5.  Egypt 100

15.2.6.  Nigeria  100

15.2.7.  Algeria  100

15.2.8.  Morocco. 100

15.2.9.  Rest of Africa. 100

Chapter No. 16 : Company Profiles. 101

16.1.    Ag Processing, Inc. 101

16.1.1.  Company Overview 101

16.1.2.  Product Portfolio. 101

16.1.3.  Swot Analysis. 101

16.1.4.  Business Strategy. 102

16.1.5.  Financial Overview 102

16.2.    Archer Daniels Midland Company (ADM) 103

16.3.    Bunge Ltd. 103

16.4.    Cargill, Inc. 103

16.5.    Ecodiesel Colombia S.A. 103

16.6.    FutureFuel Corp. 103

16.7.    Manuelita S.A. 103

16.8.    Renewable Biofuels, Inc. 103

16.9.    TerraVia Holdings, Inc. 103

16.10. Wilmar International Ltd. 103

Chapter No. 17 : Research Methodology. 104

17.1.    Research Methodology. 104

17.2.    Phase I – Secondary Research. 105

17.3.    Phase II – Data Modeling. 105

17.3.1.  Company Share Analysis Model 106

17.3.2.  Revenue Based Modeling. 106

17.4.    Phase III – Primary Research. 107

17.5.    Research Limitations. 108

17.5.1.  Assumptions. 108


List of Figures

FIG NO. 1. Global Biodiesel Market Revenue, 2017 – 2022 (USD Million) 24

FIG NO. 2. Porter’s Five Forces Analysis for Global Biodiesel Market 32

FIG NO. 3. Value Chain Analysis for Global Biodiesel Market 33

FIG NO. 4. Company Share Analysis, 2022. 35

FIG NO. 5. Company Share Analysis, 2022. 35

FIG NO. 6. Company Share Analysis, 2022. 36

FIG NO. 7. Biodiesel Market – Company Revenue Market Share, 2022. 37

FIG NO. 8. Biodiesel Market Revenue Share, By Feedstock, 2022 & 2030. 43

FIG NO. 9. Market Attractiveness Analysis, By Feedstock. 44

FIG NO. 10 Incremental Revenue Growth Opportunity by Feedstock. 44

FIG NO. 11 Biodiesel Market Revenue, By Feedstock, 2017, 2022, 2026 & 2030. 45

FIG NO. 12 Global Biodiesel Market for Vegetable Oil, Revenue (USD Million) 2017 – 2030. 46

FIG NO. 13 Global Biodiesel Market for Animal Fats, Revenue (USD Million) 2017 – 2030. 48

FIG NO. 14 Biodiesel Market Revenue Share, By Application, 2022 & 2030. 51

FIG NO. 15 Market Attractiveness Analysis, By Application. 52

FIG NO. 16 Incremental Revenue Growth Opportunity by Application. 52

FIG NO. 17 Biodiesel Market Revenue, By Application, 2017, 2022, 2026 & 2030. 53

FIG NO. 18 Global Biodiesel Market for Automotive Fuel, Revenue (USD Million) 2017 – 2030. 54

FIG NO. 19 Global Biodiesel Market for Marine Fuel, Revenue (USD Million) 2017 – 2030. 56

FIG NO. 20 Global Biodiesel Market for Agriculture Fuel, Revenue (USD Million) 2017 – 2030. 58

FIG NO. 21 Global Biodiesel Market for Power Generation, Revenue (USD Million) 2017 – 2030. 60

FIG NO. 22 Global Biodiesel Market for Others, Revenue (USD Million) 2017 – 2030. 62

FIG NO. 23 Global Biodiesel Market Revenue Share, By Region, 2022 & 2030. 65

FIG NO. 24 Market Attractiveness Analysis, By Region. 66

FIG NO. 25 Incremental Revenue Growth Opportunity by Region. 66

FIG NO. 26 Biodiesel Market Revenue, By Region, 2017, 2022, 2026 & 2030. 67

FIG NO. 27 North America Biodiesel Market Revenue, 2017 – 2022 (USD Million) 71

FIG NO. 28 Europe Biodiesel Market Revenue, 2017 – 2022 (USD Million) 76

FIG NO. 29 Asia Pacific Biodiesel Market Revenue, 2017 – 2022 (USD Million) 81

FIG NO. 30 Latin America Biodiesel Market Revenue, 2017 – 2022 (USD Million) 86

FIG NO. 31 The Middle-East Biodiesel Market Revenue, 2017 – 2022 (USD Million) 91

FIG NO. 32 Africa Biodiesel Market Revenue, 2017 – 2022 (USD Million) 96

FIG NO. 33 Research Methodology – Detailed View 104

FIG NO. 34 Research Methodology. 105


List of Tables

TABLE NO. 1. : Global Biodiesel Market: Snapshot 23

TABLE NO. 2. : Drivers for the Biodiesel Market: Impact Analysis. 28

TABLE NO. 3. : Restraints for the Biodiesel Market: Impact Analysis. 30

TABLE NO. 4. : Global Vegetable Oil Biodiesel Market Revenue, By Region, 2017 – 2022 (USD Million) 47

TABLE NO. 5. : Global Vegetable Oil Biodiesel Market Revenue, By Region, 2023– 2030 (USD Million) 47

TABLE NO. 6. : Global Animal Fats Biodiesel Market Revenue, By Region, 2017 – 2022 (USD Million) 49

TABLE NO. 7. : Global Animal Fats Biodiesel Market Revenue, By Region, 2023– 2030 (USD Million) 49

TABLE NO. 8. : Global Automotive Fuel Biodiesel Market Revenue, By Region, 2017 – 2022 (USD Million) 55

TABLE NO. 9. : Global Automotive Fuel Biodiesel Market Revenue, By Region, 2023– 2030 (USD Million) 55

TABLE NO. 10. : Global Marine Fuel Biodiesel Market Revenue, By Region, 2017 – 2022 (USD Million) 57

TABLE NO. 11. : Global Marine Fuel Biodiesel Market Revenue, By Region, 2023– 2030 (USD Million) 57

TABLE NO. 12. : Global Agriculture Fuel Biodiesel Market Revenue, By Region, 2017 – 2022 (USD Million) 59

TABLE NO. 13. : Global Agriculture Fuel Biodiesel Market Revenue, By Region, 2023– 2030 (USD Million) 59

TABLE NO. 14. : Global Power Generation Biodiesel Market Revenue, By Region, 2017 – 2022 (USD Million) 61

TABLE NO. 15. : Global Power Generation Biodiesel Market Revenue, By Region, 2023– 2030 (USD Million) 61

TABLE NO. 16. : Global Others Biodiesel Market Revenue, By Region, 2017 – 2022 (USD Million) 63

TABLE NO. 17. : Global Others Biodiesel Market Revenue, By Region, 2023– 2030 (USD Million) 63

TABLE NO. 18. : Global Biodiesel Market Revenue, By Region, 2017 – 2022 (USD Million) 68

TABLE NO. 19. : Global Biodiesel Market Revenue, By Region, 2023– 2030 (USD Million) 68

TABLE NO. 20. : Global Biodiesel Market Revenue, By Feedstock, 2017 – 2022 (USD Million) 69

TABLE NO. 21. : Global Biodiesel Market Revenue, By Feedstock, 2023– 2030 (USD Million) 69

TABLE NO. 22. : Global Biodiesel Market Revenue, By Application, 2017 – 2022 (USD Million) 70

TABLE NO. 23. : Global Biodiesel Market Revenue, By Application, 2023– 2030 (USD Million) 70

TABLE NO. 24. : North America Biodiesel Market Revenue, By Country, 2017 – 2022 (USD Million) 72

TABLE NO. 25. : North America Biodiesel Market Revenue, By Country, 2023– 2030 (USD Million) 72

TABLE NO. 26. : North America Biodiesel Market Revenue, By Feedstock, 2017 – 2022 (USD Million) 73

TABLE NO. 27. : North America Biodiesel Market Revenue, By Feedstock, 2023– 2030 (USD Million) 73

TABLE NO. 28. : North America Biodiesel Market Revenue, By Application, 2017 – 2022 (USD Million) 74

TABLE NO. 29. : North America Biodiesel Market Revenue, By Application, 2023– 2030 (USD Million) 74

TABLE NO. 30. : Europe Biodiesel Market Revenue, By Country, 2017 – 2022 (USD Million) 77

TABLE NO. 31. : Europe Biodiesel Market Revenue, By Country, 2023– 2030 (USD Million) 77

TABLE NO. 32. : Europe Biodiesel Market Revenue, By Feedstock, 2017 – 2022 (USD Million) 78

TABLE NO. 33. : Europe Biodiesel Market Revenue, By Feedstock, 2023– 2030 (USD Million) 78

TABLE NO. 34. : Europe Biodiesel Market Revenue, By Application, 2017 – 2022 (USD Million) 79

TABLE NO. 35. : Europe Biodiesel Market Revenue, By Application, 2023– 2030 (USD Million) 79

TABLE NO. 36. : Asia Pacific Biodiesel Market Revenue, By Country, 2017 – 2022 (USD Million) 82

TABLE NO. 37. : Asia Pacific Biodiesel Market Revenue, By Country, 2023– 2030 (USD Million) 82

TABLE NO. 38. : Asia Pacific Biodiesel Market Revenue, By Feedstock, 2017 – 2022 (USD Million) 83

TABLE NO. 39. : Asia Pacific Biodiesel Market Revenue, By Feedstock, 2023– 2030 (USD Million) 83

TABLE NO. 40. : Asia Pacific Biodiesel Market Revenue, By Application, 2017 – 2022 (USD Million) 84

TABLE NO. 41. : Asia Pacific Biodiesel Market Revenue, By Application, 2023– 2030 (USD Million) 84

TABLE NO. 42. : Latin America Biodiesel Market Revenue, By Country, 2017 – 2022 (USD Million) 87

TABLE NO. 43. : Latin America Biodiesel Market Revenue, By Country, 2023– 2030 (USD Million) 87

TABLE NO. 44. : Latin America Biodiesel Market Revenue, By Feedstock, 2017 – 2022 (USD Million) 88

TABLE NO. 45. : Latin America Biodiesel Market Revenue, By Feedstock, 2023– 2030 (USD Million) 88

TABLE NO. 46. : Latin America Biodiesel Market Revenue, By Application, 2017 – 2022 (USD Million) 89

TABLE NO. 47. : Latin America Biodiesel Market Revenue, By Application, 2023– 2030 (USD Million) 89

TABLE NO. 48. : Middle East Biodiesel Market Revenue, By Country, 2017 – 2022 (USD Million) 92

TABLE NO. 49. : Middle East Biodiesel Market Revenue, By Country, 2023– 2030 (USD Million) 92

TABLE NO. 50. : Middle East Biodiesel Market Revenue, By Feedstock, 2017 – 2022 (USD Million) 93

TABLE NO. 51. : Middle East Biodiesel Market Revenue, By Feedstock, 2023– 2030 (USD Million) 93

TABLE NO. 52. : Middle East Biodiesel Market Revenue, By Application, 2017 – 2022 (USD Million) 94

TABLE NO. 53. : Middle East Biodiesel Market Revenue, By Application, 2023– 2030 (USD Million) 94

TABLE NO. 54. : Africa Biodiesel Market Revenue, By Country, 2017 – 2022 (USD Million) 97

TABLE NO. 55. : Africa Biodiesel Market Revenue, By Country, 2023– 2030 (USD Million) 97

TABLE NO. 56. : Africa Biodiesel Market Revenue, By Feedstock, 2017 – 2022 (USD Million) 98

TABLE NO. 57. : Africa Biodiesel Market Revenue, By Feedstock, 2023– 2030 (USD Million) 98

TABLE NO. 58. : Africa Biodiesel Market Revenue, By Application, 2017 – 2022 (USD Million) 99

TABLE NO. 59. : Africa Biodiesel Market Revenue, By Application, 2023– 2030 (USD Million) 99

Request Free Sample

Ready to Transform Data into Decisions?

Request Your Sample Report and Start Your Journey of Informed Choices


Providing the strategic compass for industry titans.

cr-clients-logos

Frequently Asked Questions:

What is the projected growth of the biodiesel market?

The biodiesel market is expected to reach USD 54,586.79 million by 2030, reflecting a compound annual growth rate (CAGR) of 7.99% from 2023 to 2030.

What factors are driving the growth of the biodiesel market in the Asia-Pacific region?

The Asia-Pacific region’s biodiesel market growth is primarily driven by growing environmental consciousness, supportive government initiatives, and significant investments in biofuel production infrastructure by countries like China and India.

How does the use of biodiesel contribute to environmental sustainability?

Biodiesel results in lower greenhouse gas emissions compared to conventional fossil fuels. It also reduces particulate matter and hydrocarbon emissions in transportation, and the use of biodiesel in power generation helps reduce emissions contributing to smog, ozone, and sulfur.

What role does innovation play in the biodiesel market?

Innovation and technological advancements, such as improved production techniques and the waste-to-energy trend, are contributing significantly to the expansion of the biodiesel market by enhancing efficiency and reducing production costs.

About Author

Ganesh Chandwade

Ganesh Chandwade

Senior Industry Consultant

Ganesh is a senior industry consultant specializing in heavy industries and advanced materials.

View Profile

Europe Advanced Biodiesel Market

The Europe Advanced Biodiesel market is projected to grow significantly, increasing from USD 11,415 million in 2024 to USD 33,252.68 million by 2032, reflecting a robust compound annual growth rate (CAGR) of 14.30%.

Acidulated Soap Stock Market

The Acidulated Soap Stock market size was valued at USD 507.8 million in 2018, reached USD 708.6 million in 2024, and is anticipated to reach USD 1,032.3 million by 2032, at a CAGR of 4.80% during the forecast period.

Blown Rapeseed Oil Market

The Blown Rapeseed Oil Market is expected to grow from USD 2,379.20 million in 2024 to USD 3,352.5 million by 2032, registering a compound annual growth rate (CAGR) of 4.38%.

Animal and Marine Fats and Oils Market

The Animal and Marine Fats and Oils Market is projected to grow from USD 325,145 million in 2024 to USD 546,496 million by 2032, registering a compound annual growth rate (CAGR) of 7.7% during the forecast period.

Sodium Ethoxide Market

The Sodium Ethoxide market was valued at USD 267.1 million in 2024 and is anticipated to reach USD 487.11 million by 2032, reflecting a compound annual growth rate (CAGR) of 7.8% during the forecast period.

Spain Soy-Based Chemicals Market

The Spain Soy-Based Chemicals Market is projected to grow from USD 580.99 million in 2024 to an estimated USD 904.28 million by 2032, with a compound annual growth rate (CAGR) of 5.69% from 2025 to 2032.

Brazil Soy-Based Chemicals Market

The Brazil Soy-Based Chemicals Market is projected to grow from USD 812.68 million in 2024 to an estimated USD 1,403.79 million by 2032, with a compound annual growth rate (CAGR) of 7.07% from 2025 to 2032.

U.S. Soy-Based Chemicals Market

The U.S. Soy-Based Chemicals Market is projected to grow from USD 8,462.98 million in 2024 to an estimated USD 15,313.75 million by 2032, with a compound annual growth rate (CAGR) of 7.69% from 2025 to 2032. This growth is driven by the increasing adoption of sustainable and renewable resources across various industries.

South Korea Soy-Based Chemicals Market

The South Korea Soy-Based Chemicals Market is projected to grow from USD 1,234.93 million in 2024 to an estimated USD 2,313.92 million by 2032, with a compound annual growth rate (CAGR) of 8.17% from 2025 to 2032.

Purchase Options

The report comes as a view-only PDF document, optimized for individual clients. This version is recommended for personal digital use and does not allow printing. Use restricted to one purchaser only.
$4999

To meet the needs of modern corporate teams, our report comes in two formats: a printable PDF and a data-rich Excel sheet. This package is optimized for internal analysis. Unlimited users allowed within one corporate location (e.g., regional office).
$6999

The report will be delivered in printable PDF format along with the report’s data Excel sheet. This license offers 100 Free Analyst hours where the client can utilize Credence Research Inc. research team. Permitted for unlimited global use by all users within the purchasing corporation, such as all employees of a single company.
$12999

Credence Staff 3

WILLIAM, North America

Support Staff at Credence Research

KEITH PHILLIPS, Europe

Lee - CR Sales Staff

LEE VALLANCE, Asia Pacific

Kieran Jameson

KIERAN JAMESON, Australia

Report delivery within 24 to 48 hours

User Review

Thank you for the data! The numbers are exactly what we asked for and what we need to build our business case.

Materials Scientist
(privacy requested)

User Review

The report was an excellent overview of the Industrial Burners market. This report does a great job of breaking everything down into manageable chunks.

Imre Hof
Management Assistant, Bekaert

cr-clients-logos

Request Sample