
Quick answer
A hydrochloric acid plant burns chlorine in hydrogen and absorbs the gas in water to make 30–37% acid for steel pickling, well acidizing, water treatment and chemical synthesis. A greenfield synthesis plant of 100 metric tons a day of HCl, sited beside a chlor-alkali producer, needs an estimated USD 9–20 million of CapEx. Gross margin of 30–55% depends mainly on the chlorine transfer price, and payback is about 2–8 years at mid-range CapEx.
Viable for a chlor-alkali producer or a partner on its fence line that can buy chlorine at a low transfer price, but uneconomic for a standalone entrant paying merchant liquid chlorine prices.
Hydrochloric Acid plant: key highlights
| Parameter | Indicative value | Note |
|---|---|---|
| Plant capacity | 100 metric tons per day of HCl (100% basis) | About 300 tons a day, or 100,000 tons a year, of 33% acid by the synthesis route |
| Total CapEx | USD 9–20 million | Greenfield plot beside a chlor-alkali plant; low end an Asian site, top end a U.S. or EU site |
| Raw material share of operating cost | 70–80% | Chlorine and hydrogen at assumed transfer prices from the neighboring producer |
| Gross margin | 30–55% | Acid price minus chlorine, hydrogen and direct conversion cost |
| Payback period | 2–8 years | 90% utilization and mid-range CapEx of USD 14 million |
| IRR | Available in report | Post-tax, 10-year model |
| Break-even | Available in report | Capacity utilization basis |
Ranges assume a 100-ton-a-day (100% HCl) synthesis plant on a greenfield plot beside a chlor-alkali producer, Asian to U.S. or EU sites, 2026 prices, 330 days, 90% utilization, an assumed ex-works price of USD 115–140 per ton of 33% acid, chlorine at an assumed USD 140–180 per ton and hydrogen at an assumed USD 1,000–1,300 per ton. CapEx is scaled from a 2025 disclosed project at an assumed 86 rupees per dollar. Customizable to any country.
What is hydrochloric acid?
Hydrochloric acid is a water solution of hydrogen chloride (HCl), a colorless gas with a sharp, choking odor. Commercial acid is sold at about 30% to 37% HCl, with 31–33% the most common technical strength, while the anhydrous gas ships in cylinders and tube trailers for electronics and chemical synthesis. Grades run from technical acid for steel pickling and well treatment to food, reagent and electronic grades, where iron, heavy metals and organic traces are held to parts per million or lower.
Most world supply is a by-product. Chlorination steps in vinyl chloride, isocyanate, chloromethane and fluorocarbon plants release hydrogen chloride that is either recycled or absorbed into water and sold. Purpose-built plants burn chlorine in hydrogen to make a cleaner acid, and the older Mannheim process reacts salt with sulfuric acid to yield the acid and sodium sulfate.
Hydrogen chloride and hydrochloric acid are classified under Harmonized System subheading 2806.10. Main uses include steel pickling, oil and gas well acidizing, ferric and aluminum chloride coagulants, pH control, ore processing, calcium chloride, food processing and pharmaceutical synthesis. Concentrated acid moves as UN1789, Class 8 corrosive.
Hydrochloric acid market overview and global demand
Global output is hard to measure, because much of the acid is made and consumed inside the same complex and never reported as a sale. Trade data give the clearest view of the merchant market. UN Comtrade data for HS 280610 show reported exports of about 2.37 million metric tons worth USD 391 million in 2025, against 2.28 million tons and USD 427 million in 2024. Germany led with about 495,000 tons, followed by Belgium, Canada, Spain, the Netherlands, India, the United States and Hungary. Unit values point to two price zones: most large European exporters and India shipped at about USD 80–135 per ton, while Canadian and U.S. acid sold near USD 220. The United States was the largest importer in 2024 at about 317,000 tons, ahead of France, Germany and Belgium.
Because the acid is heavy, corrosive and mostly water, it rarely travels more than a few hundred kilometers, and most cross-border flows are between neighbors. Supply follows chlorine output, and Euro Chlor puts its members' chlorine capacity at about 11 million metric tons at the start of 2026, with monthly output of about 540,000–640,000 tons from June to September 2026. Acid economics are therefore tied to the chlorine market and to caustic soda demand, since electrolysis makes chlorine and caustic in a fixed ratio.
Demand comes from steel pickling in China, India, Europe and North America, well stimulation in U.S. shale basins and the Middle East, water treatment coagulants, and new phosphate and specialty chemical plants that use the acid as a feed. Semiconductor fabs in East Asia, the United States and Europe add demand for electronic-grade acid. Merchant prices swing with the vinyl cycle: strong PVC runs flood the market with by-product acid, and cuts tighten it.
Hydrochloric acid manufacturing process
A dedicated plant uses the synthesis route, combining chlorine and hydrogen piped from a neighboring chlor-alkali unit. The reaction of one molecule of hydrogen with one of chlorine gives two molecules of hydrogen chloride and releases about 92 kilojoules per mole of HCl. Each metric ton of 100% HCl needs about 0.973 ton of chlorine and 0.028 ton of hydrogen, plus a small hydrogen excess so that no free chlorine reaches the product.
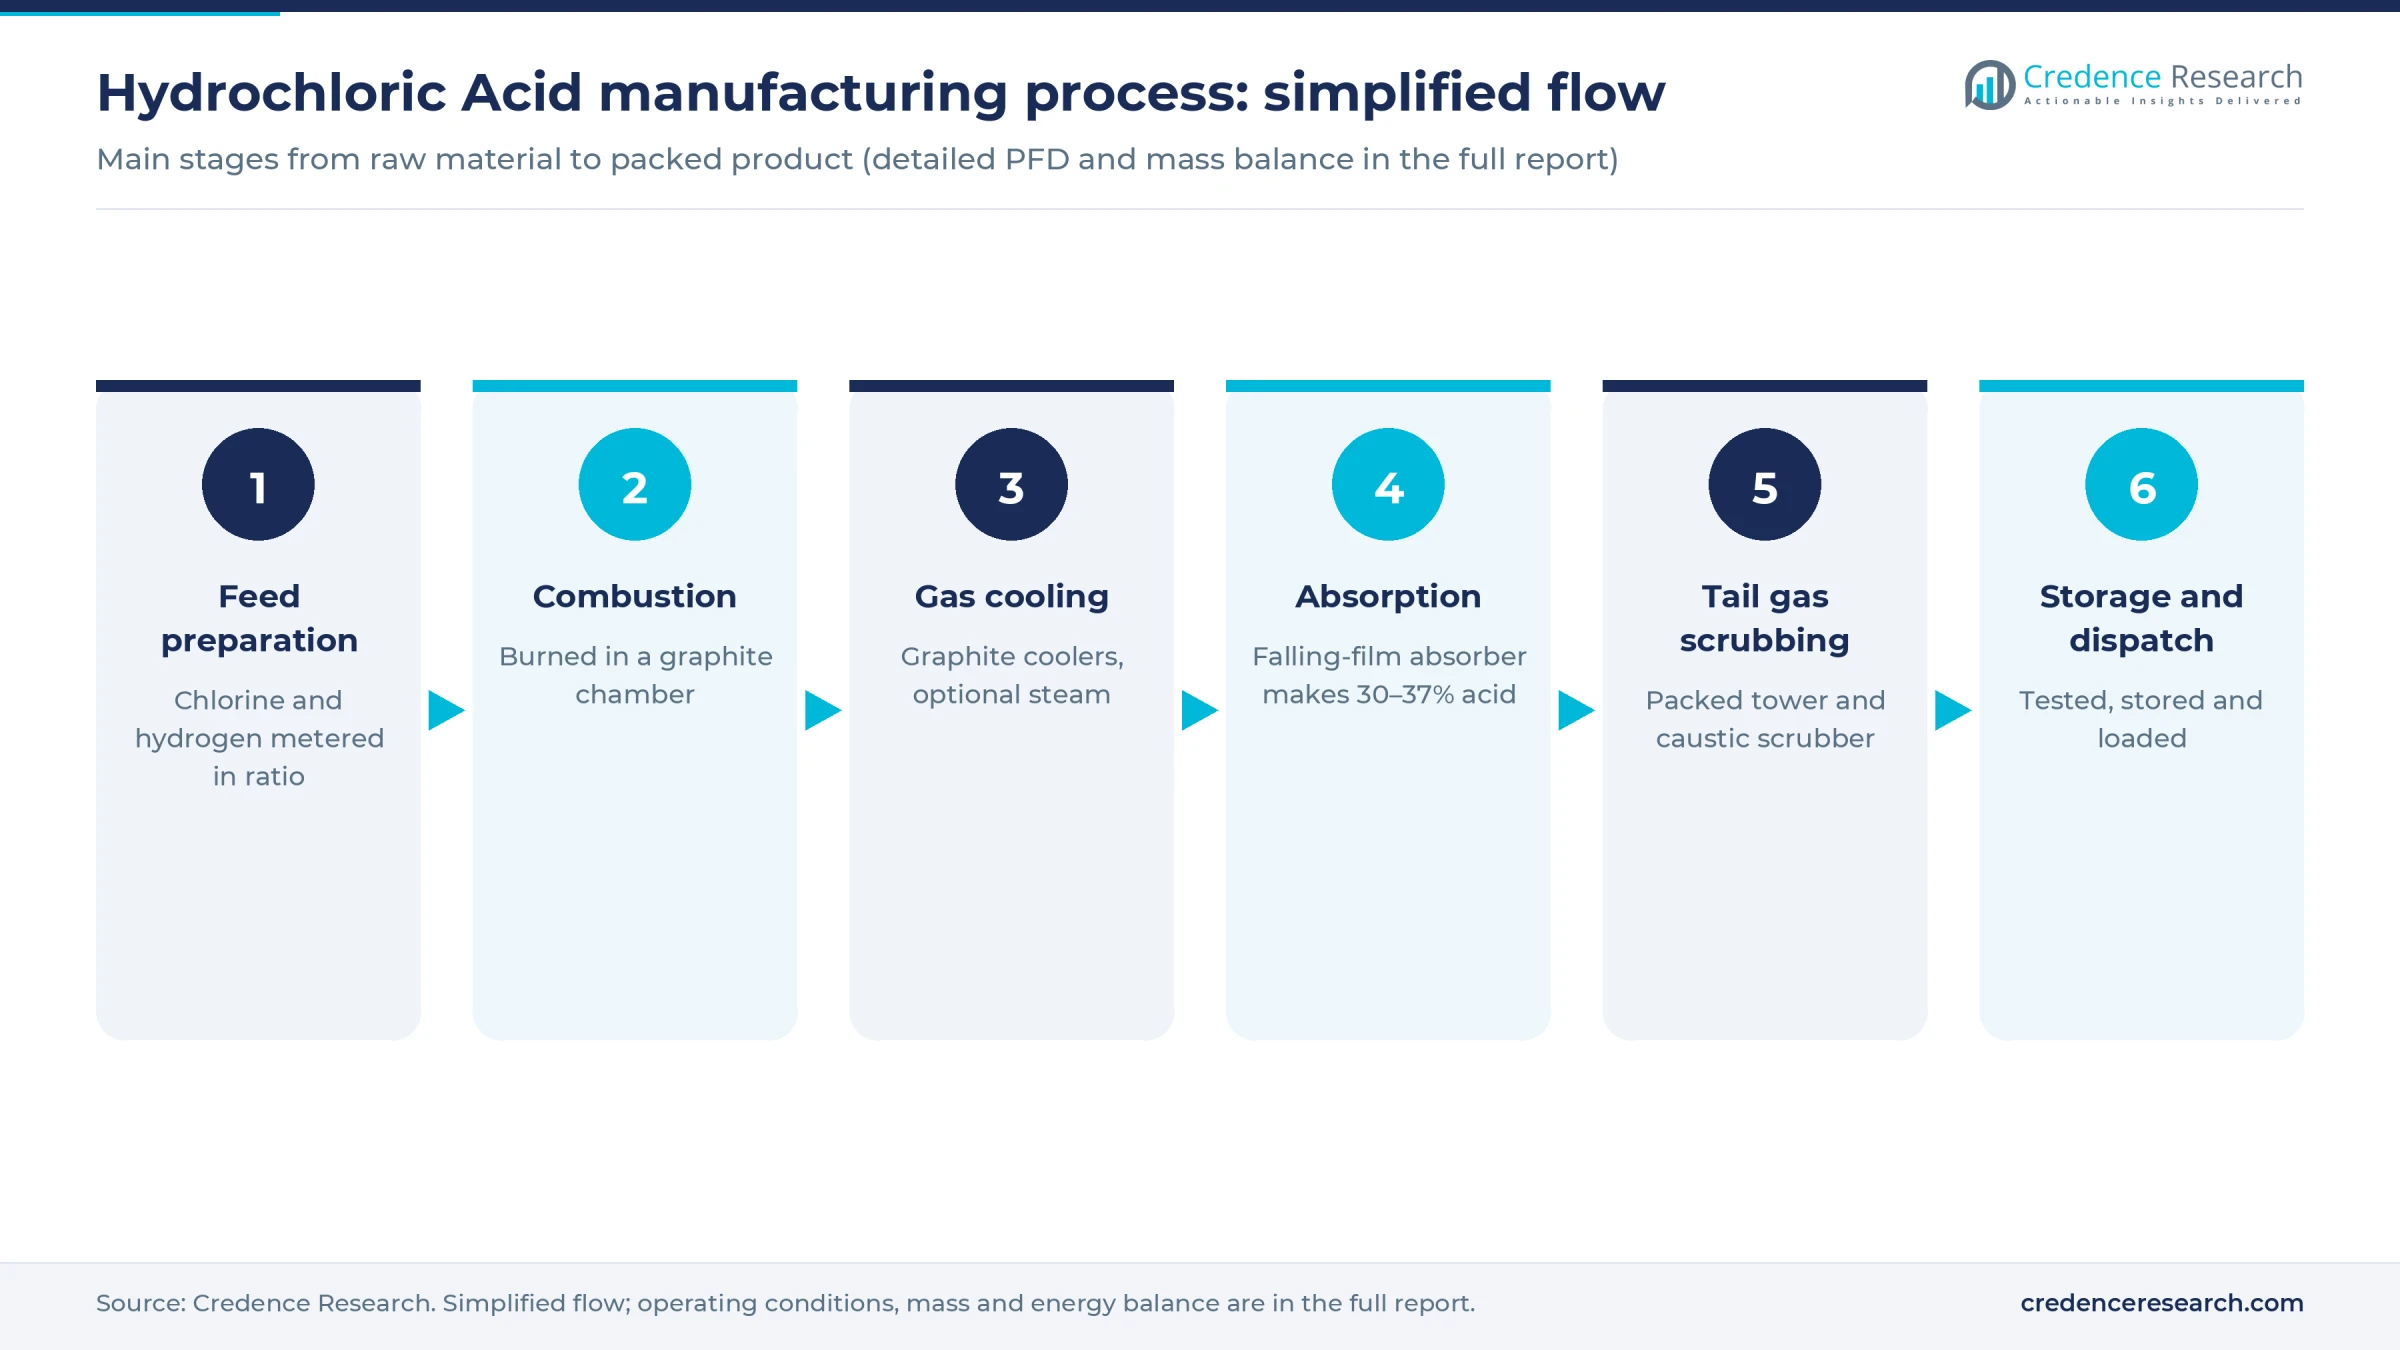
- Feed preparation. Chlorine gas arrives by pipeline or from evaporated liquid chlorine, and cell hydrogen passes through knockout pots and flame arrestors. Ratio control holds hydrogen about 5–10% above the stoichiometric amount.
- Combustion. A quartz or graphite burner mixes the gases inside a water-cooled chamber of resin-impregnated graphite, where the flame exceeds 2,000 degrees Celsius.
- Gas cooling. Hydrogen chloride gas is cooled in graphite heat exchangers, and some designs recover the reaction heat as low-pressure steam.
- Absorption. A falling-film absorber dissolves the gas in demineralized water or weak acid to give 30–37% acid. Absorption also releases heat, so cooling water runs on the shell side.
- Tail gas scrubbing. A packed tower captures unabsorbed HCl, and an emergency caustic scrubber neutralizes any chlorine release.
- Storage and dispatch. Acid is tested for strength, iron and free chlorine, then pumped to rubber-lined steel or fiberglass tanks and loaded to tank trucks, rail cars or totes.
Safety design dominates the layout because hydrogen and chlorine form an explosive mixture, so purge sequences, flame monitoring and automatic shutoff valves are standard. Graphite is used because few metals resist hot, wet hydrogen chloride. Higher grades add adsorption beds to strip iron and organics, and electronic grades need dedicated purification and clean packaging. By-product acid needs more cleanup, so synthesis acid earns a premium with food and pharmaceutical buyers.
Hydrochloric acid plant setup cost
The reference plant makes 100 metric tons a day of HCl on a 100% basis, or about 300 tons a day of 33% acid and 100,000 tons a year over 330 operating days. It sits on a greenfield plot beside a chlor-alkali producer and takes chlorine and hydrogen by pipeline. Total CapEx is estimated at USD 9–20 million, including land, two synthesis trains, storage and loading, utilities, preoperative costs and working capital.
The anchor is a disclosed project. In May 2025, Gujarat Alkalies and Chemicals told Indian exchanges that its board had approved a 90–120-ton-a-day HCl synthesis unit at Dahej for about 350 million rupees, or about USD 4.1 million at an assumed 86 rupees per dollar. Scaled to 100 tons a day with a 0.6 capacity exponent, that is about USD 4 million for the synthesis block at an existing Indian site. A greenfield plot adds a tank farm holding about 15 days of output, loading bays, demineralized water, cooling, scrubbing, buildings and engineering. U.S. and EU builds are assumed to cost 1.8–2 times the Indian synthesis block because of labor and equipment pricing.
For the land row, the plant needs about 20,000 square meters for the synthesis building, tank farm, loading area and safety buffer. At an assumed USD 15–60 per square meter, land costs USD 300,000–1.2 million, about 5% of CapEx at the midpoint. An Asian industrial park sits at the low end and a U.S. or EU chemical park at the top.
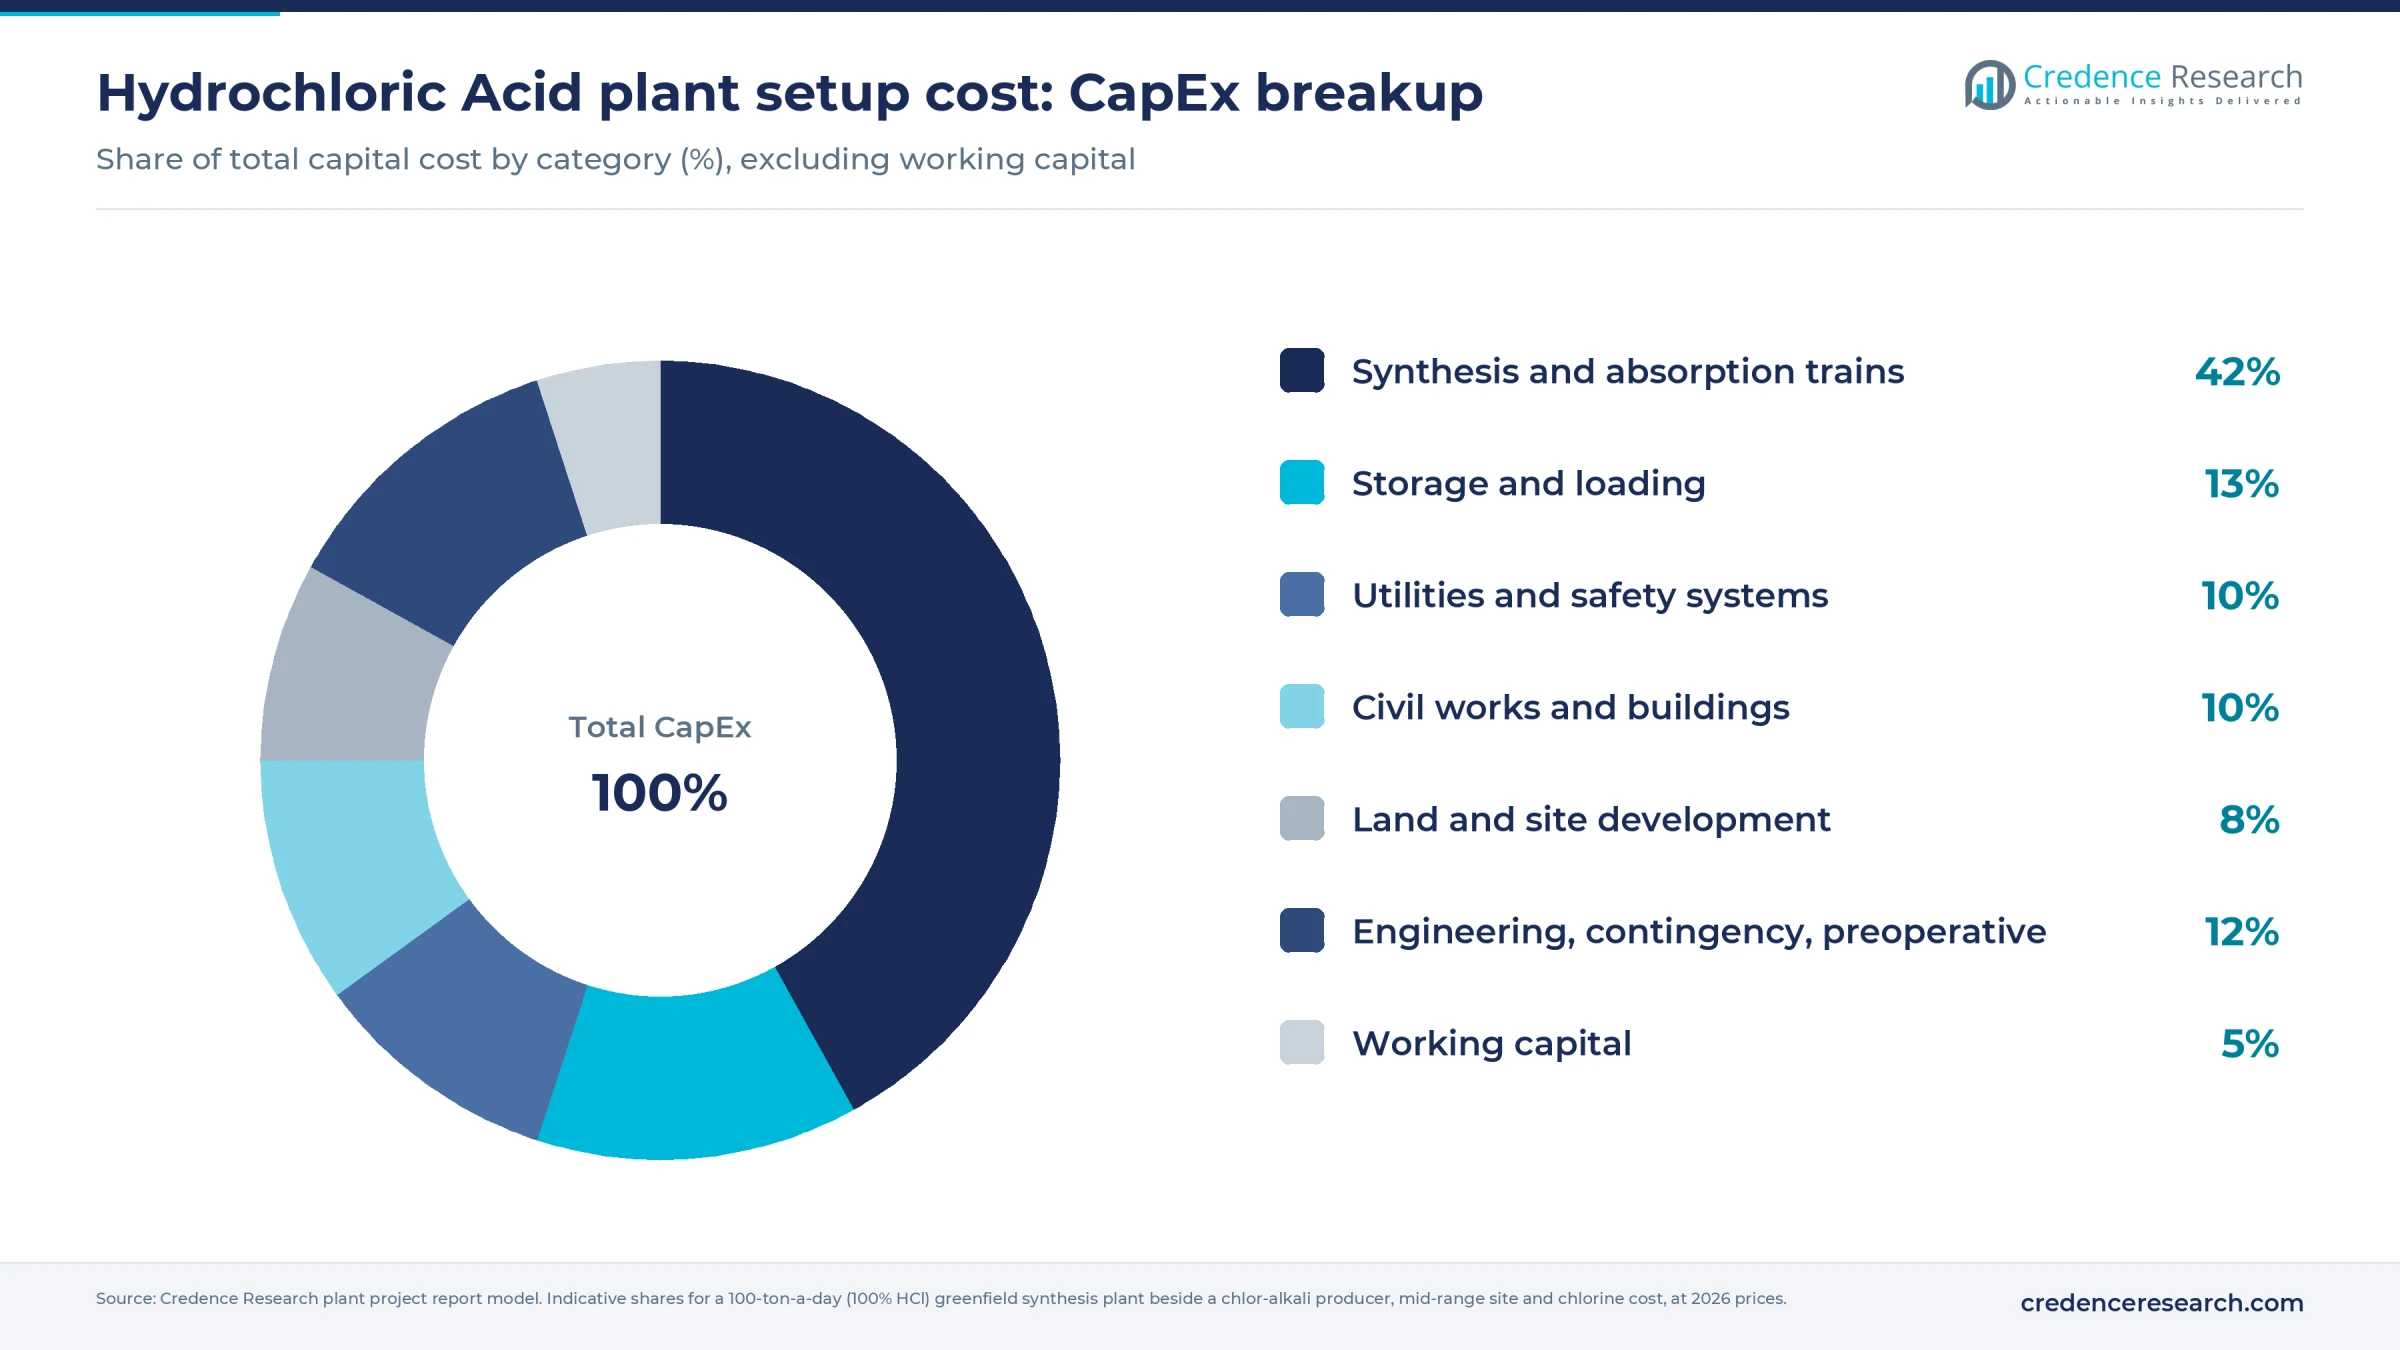
The synthesis and absorption trains take about 42% of CapEx, and storage and loading about 13%. Running cost is dominated by one input.
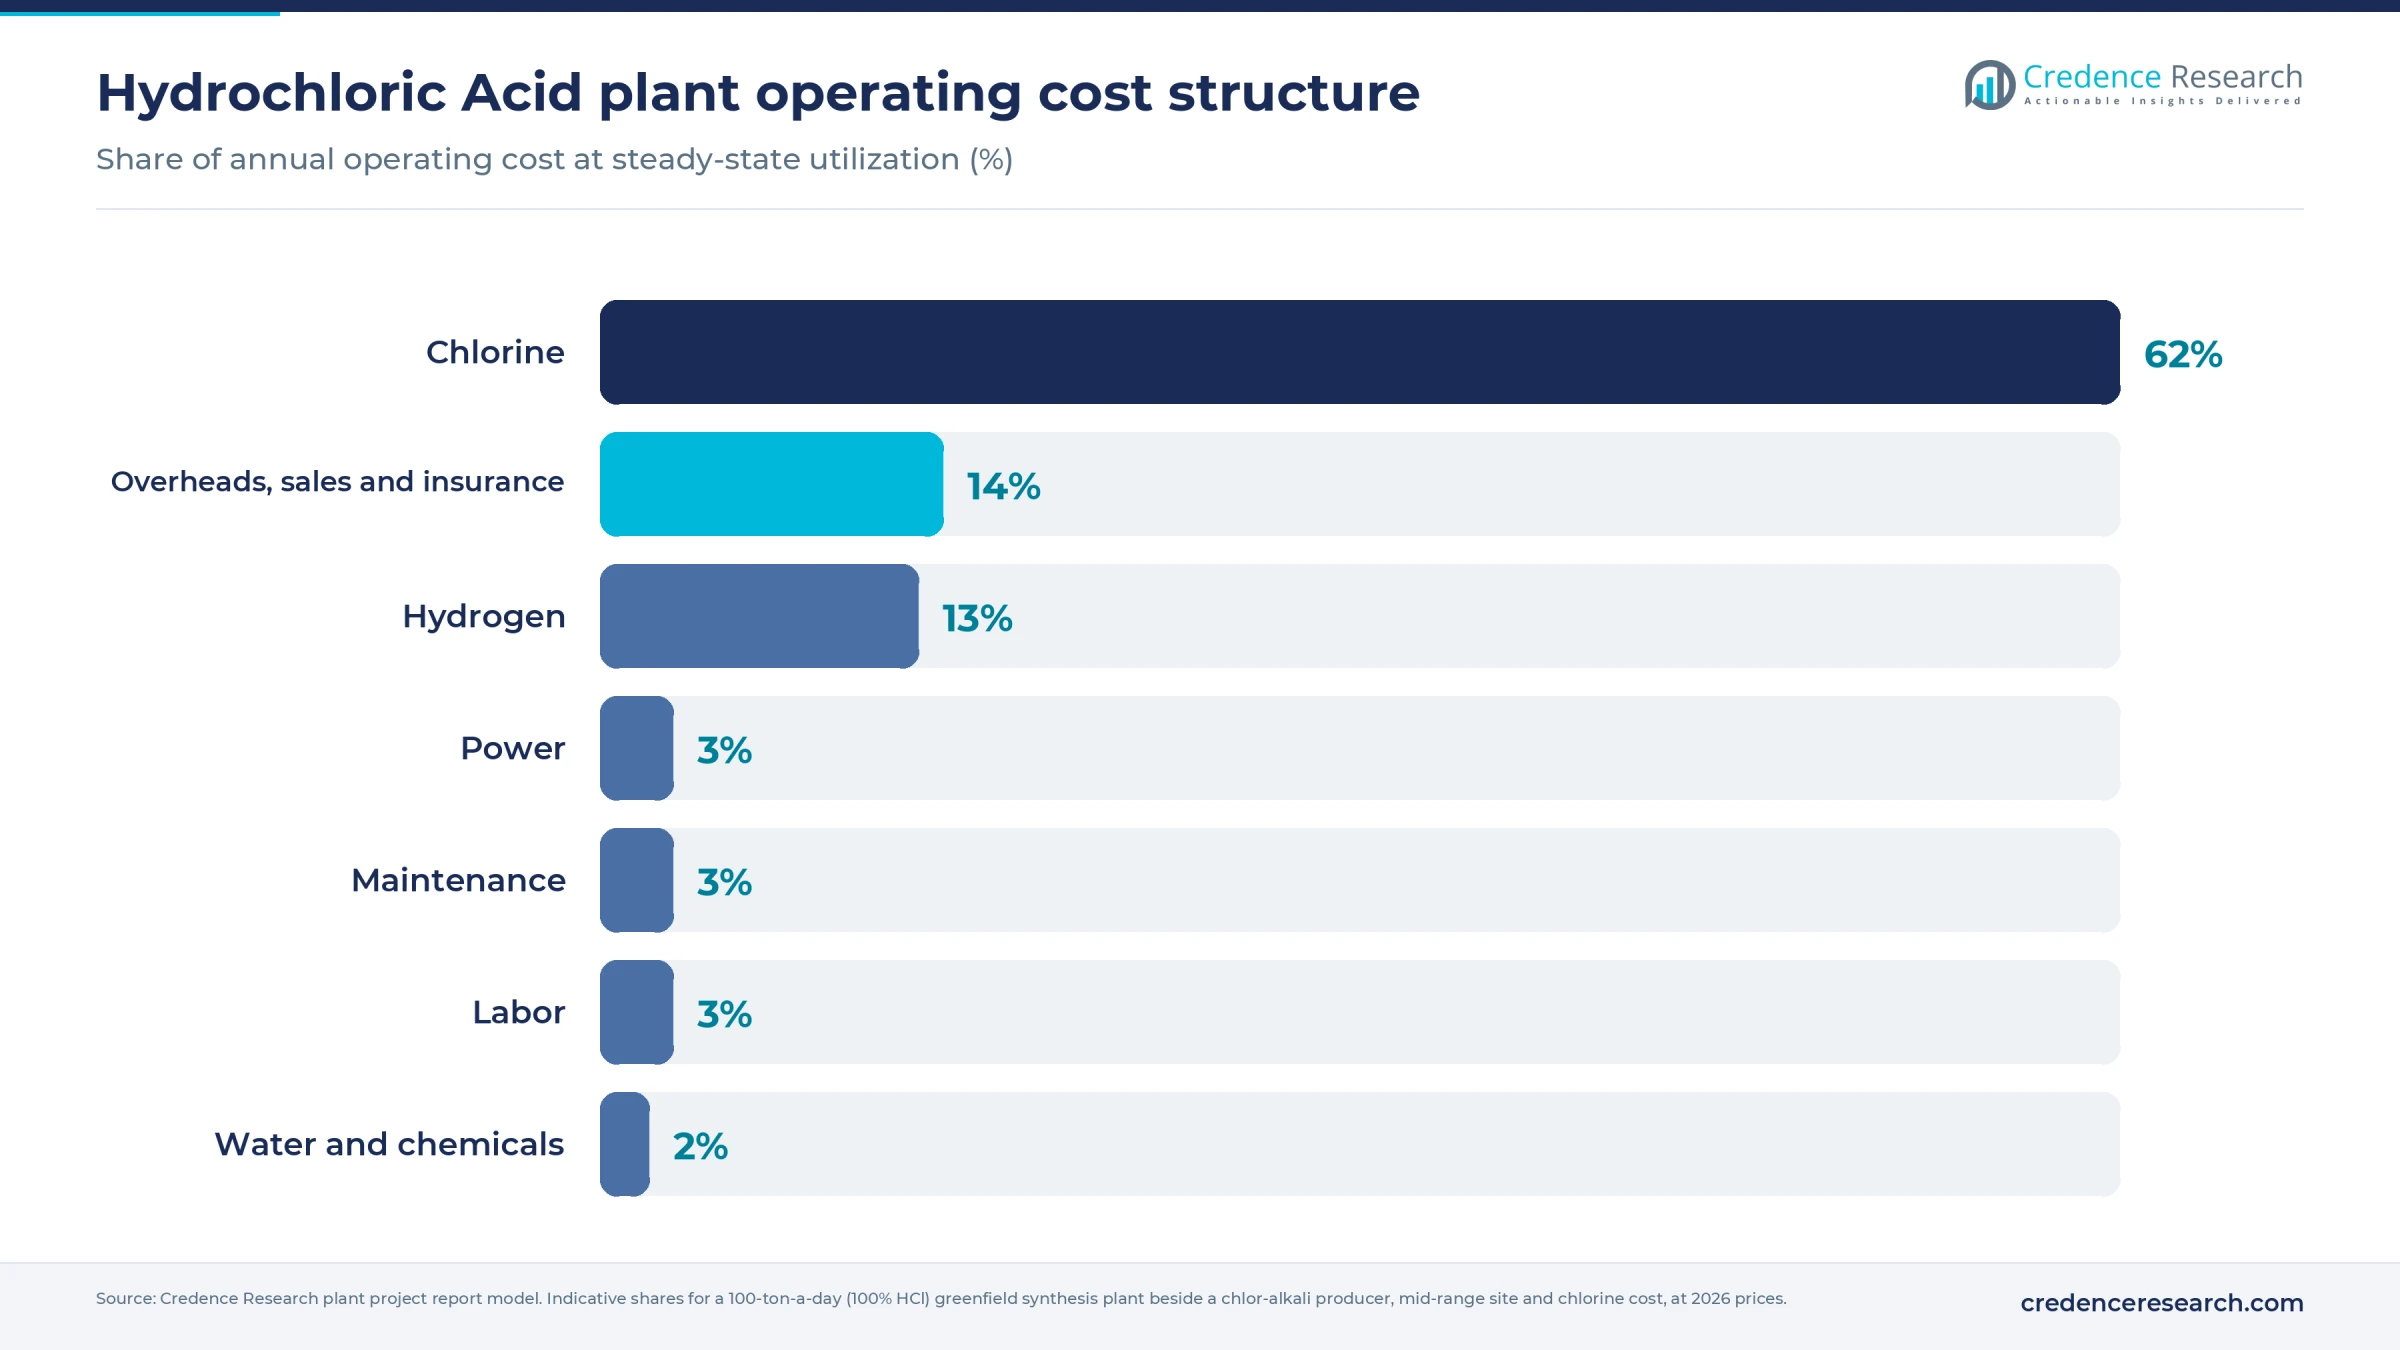
Chlorine and hydrogen make up about 75% of operating cost at the central case, so the transfer price agreed with the neighboring producer decides the project more than any equipment choice. The full report can be customized to any country or region.
Machinery and raw materials for a hydrochloric acid plant
The main equipment groups are listed below; ratings, makes and the full schedule are in the report.
- Chlorine receiving with pipeline metering or an evaporator, knockout pots and pressure control
- Hydrogen blower, flame arrestors and ratio control valves
- Burners, graphite combustion chambers and gas coolers, with optional steam recovery
- Falling-film graphite absorbers, tail gas scrubbers and an emergency caustic scrubber
- Demineralized water plant, cooling tower and chilled water for high-strength acid
- Rubber-lined or fiberglass storage tanks, lined pumps and truck and rail loading arms
- Chlorine and hydrogen detectors, burner management and safety instrumented systems, and a laboratory
At 90% utilization, the reference plant uses about 29,000 tons of chlorine and 860 tons of hydrogen a year. Both come almost entirely from chlor-alkali electrolysis, so sourcing follows the main producing regions: China, the U.S. Gulf Coast, Western Europe, Japan and South Korea, the Gujarat coast in India and Saudi Arabia. Chlorine rarely moves far, and Comtrade records only about 450,000 tons of chlorine exports in 2025, and the largest flow, from Canada, was valued near USD 775 per ton. That is why the plant must sit next to a chlorine source rather than buy liquid chlorine on the open market. Demineralized water, about 0.67 ton per ton of 33% acid, is the only other bulk input. Makers of water treatment chemicals and oilfield chemicals are common merchant outlets.
Hydrochloric acid business profit margin and ROI
Gross margin is estimated at 30–55%, measured as the acid price minus chlorine, hydrogen and direct conversion cost, as a share of the acid price. The build uses an assumed ex-works price of USD 115–140 per ton of 33% acid, near 2025 export unit values of about USD 107 from Belgium and USD 134 from Germany and well below North American levels near USD 220. Chlorine is charged at an assumed transfer price of USD 140–180 per ton, or about USD 45–58 per ton of acid, and hydrogen at an assumed USD 1,000–1,300 per ton, or about USD 10–13. Direct conversion cost for power, water, labor and maintenance is assumed at USD 9–10.50 per ton.
At 90% utilization, or about 90,000 tons, revenue is near USD 11.5 million. Annual cash profit after an assumed USD 0.8–1.2 million of overheads is about USD 1.9–6.1 million, which puts payback at about 2–8 years on mid-range CapEx of USD 14 million.
The main sensitivity is the chlorine charge. Each USD 50 per ton change moves cost by about USD 16 per ton of acid, or about USD 1.4 million a year. At merchant liquid chlorine prices the synthesis route stops paying, which is why most units are built by chlor-alkali producers that need an outlet for surplus chlorine.
| Metric | Value |
|---|---|
| Gross margin | 30–55% |
| Payback period | 2–8 years |
| IRR (post-tax) | Available in report |
| NPV | Available in report |
| Return on investment | Available in report |
| DSCR | Available in report |
| Break-even utilization | Available in report |
How to start a hydrochloric acid business, licenses and approvals
Approval steps follow a common path: company and tax registration, industrial zoning and building permits, an air permit covering hydrogen chloride and chlorine emissions, wastewater discharge approval, process safety and fire clearances for chlorine and hydrogen handling, pressure equipment certification, chemical registration, dangerous goods transport compliance and import registration for equipment. Hydrochloric acid is a controlled drug precursor in many markets, so sales records and customer screening apply.
| Market | Key approvals for a hydrochloric acid plant |
|---|---|
| United States | State air construction permit and Title V permit where required; EPA hazardous air pollutant standards for hydrochloric acid production, 40 CFR 63 Subpart NNNNN, at major sources; NPDES discharge permit; OSHA process safety management and EPA risk management plans for chlorine and anhydrous hydrogen chloride above threshold quantities; DOT hazardous materials rules; DEA List II chemical rules; FDA GRAS status under 21 CFR 182.1057 for food-grade acid |
| European Union | Integrated permit under the Industrial Emissions Directive, applying best available techniques for chlor-alkali and large volume inorganic chemicals; REACH registration and CLP labeling; Seveso III duties for chlorine inventories; Category 3 drug precursor rules under Regulations (EC) 273/2004 and 111/2005; E 507 food additive specifications under Regulation (EU) 231/2012 |
| India | Consent to establish and operate from the state pollution control board under the Air and Water Acts; factory license and plan approval; PESO licenses for chlorine and hydrogen storage under the Static and Mobile Pressure Vessels (Unfired) Rules, 2016; hazardous chemical duties under the MSIHC Rules, 1989; BIS specification IS 265 for commercial acid |
The process safety review usually sets the timeline, since regulators examine chlorine inventories and emergency scrubbing.
Key hydrochloric acid manufacturers and recent developments
Most hydrochloric acid is sold by chlor-alkali, vinyl and isocyanate producers. Olin, OxyChem and Westlake in North America, BASF, Covestro, INOVYN and Nobian in Europe, Tosoh and Tokuyama in Japan, and large Chinese chlor-alkali groups supply much of the merchant market. Indian producers include Gujarat Alkalies and Chemicals, Grasim Industries, DCM Shriram and TGV SRAAC.
- April 2026: TGV SRAAC reported revised capacities in an exchange filing, including 24,038 tons a year of 100% HCl from its chloromethane units and liquid chlorine capacity raised to 279,960 tons.
- June 2026: Chlorum Solutions USA took ownership of Cargill's Eddyville, Iowa, chlor-alkali plant, which makes hydrochloric acid, caustic soda and sodium hypochlorite for Midwest customers, under a deal agreed in December 2025.
- July 2026: Gujarat Alkalies and Chemicals approved in principle an additional HCl synthesis unit at Dahej, estimated at 550 million rupees, to raise chlorine use and supply a planned phosphoric acid plant.
New acid capacity keeps coming from chlorine producers balancing their electrolysis output, not from standalone entrants.
What's inside the Hydrochloric Acid project report PDF
The report runs to 21 chapters. Open a chapter to see its sections.
1. Preface
2. Scope and Methodology
- 2.1 Objectives of the Study
- 2.2 Stakeholders
- 2.3 Research Methodology
- 2.4 Data Sources and Key Assumptions
3. Executive Summary
- 3.1 Market Snapshot
- 3.2 Project at a Glance (Capacity, CapEx, OpEx)
- 3.3 Key Financial Indicators (IRR, NPV, Payback, Break-even)
- 3.4 Feasibility Verdict
4. Product Overview
- 4.1 Hydrochloric Acid Definition and Properties
- 4.2 Grades and Specifications (BIS / ISO / ASTM)
- 4.3 HS Code and Classification
- 4.4 Key Applications
- 4.5 Substitutes
5. Global Hydrochloric Acid Market
- 5.1 Market Overview
- 5.2 Historical and Current Market Performance (Volume and Value)
- 5.3 Market Breakup by Grade / Type
- 5.4 Market Breakup by End-Use Industry
- 5.5 Market Breakup by Region
- 5.6 Market Drivers, Restraints and Trends
- 5.7 Value Chain Analysis
- 5.8 Market Forecast
6. Target Country Hydrochloric Acid Market Analysis
- 6.1 Demand and Supply Analysis
- 6.2 Installed Capacity vs Demand Gap
- 6.3 Import Dependence
- 6.4 Demand Forecast by End-Use
7. Trade Analysis
- 7.1 Imports by Volume, Value and Country
- 7.2 Exports by Volume, Value and Country
- 7.3 Trade Balance and Opportunities
8. Price Analysis
- 8.1 Historical Hydrochloric Acid Price Trends by Region
- 8.2 Raw Material / Feedstock Price Trends and Linkage
- 8.3 Price Forecast
- 8.4 Margins Across the Value Chain
9. Competitive Landscape
- 9.1 Market Structure
- 9.2 Key Players and Installed Capacities
- 9.3 Profiles of Key Players
- 9.4 Recent Developments (Expansions, M&A, New Plants)
10. Manufacturing Process and Technology
- 10.1 Comparison of Technology Routes
- 10.2 Selected Route and Process Flow Diagram
- 10.3 Unit Operations Involved
- 10.4 Chemical Reactions Involved
- 10.5 Mass Balance and Raw Material Requirements
- 10.6 Energy Balance
- 10.7 Quality Assurance Criteria and Technical Tests
- 10.8 By-products and Waste Handling
- 10.9 Technology Licensors / Providers
11. Project Details, Requirements and Costs
- 11.1 Land, Location and Site Development
- 11.1.1 Site Selection Criteria
- 11.1.2 Location Analysis
- 11.1.3 Land Requirement and Costs
- 11.1.4 Site Development Costs
- 11.2 Plant Layout
- 11.2.1 Layout Principles
- 11.2.2 Proposed Layout
- 11.2.3 Factors Influencing Layout
- 11.3 Civil Works and Buildings
- 11.4 Plant Machinery
- 11.4.1 Machinery Requirements and Specifications
- 11.4.2 Machinery Costs
- 11.4.3 Machinery Suppliers
- 11.5 Raw Materials
- 11.5.1 Requirements per Tonne of Output
- 11.5.2 Procurement and Sourcing
- 11.5.3 Costs
- 11.5.4 Suppliers
- 11.6 Packaging
- 11.6.1 Packaging Requirements
- 11.6.2 Packaging Costs
- 11.6.3 Packaging Suppliers
- 11.7 Storage and Material Handling
- 11.8 Transportation Requirements and Costs
- 11.9 Utilities
- 11.9.1 Power Requirements and Costs
- 11.9.2 Water Requirements and Costs
- 11.9.3 Steam, Fuel and Other Utilities
- 11.10 Manpower Requirements and Wages
12. Environment, Health, Safety and Sustainability
- 12.1 Effluent and Emissions Management
- 12.2 Hazard Classification and Safety Measures
- 12.3 Carbon Footprint
- 12.4 Green / Low-Carbon Process Options
13. Regulatory Procedures, Approvals and Certifications
- 13.1 Licences and Registrations
- 13.2 Environmental Clearances
- 13.3 Product Certifications (BIS, REACH, etc.)
- 13.4 Approval Timeline
14. Project Implementation Schedule
15. Project Economics
- 15.1 Capital Cost of the Project
- 15.2 Techno-Economic Parameters
- 15.3 Capacity Utilization and Ramp-up
- 15.4 Product Pricing and Margins
- 15.5 Income Projections
- 15.6 Expenditure Projections
- 15.7 Working Capital Requirement
- 15.8 Taxation
- 15.9 Depreciation
16. Financial Analysis
- 16.1 Projected Profit and Loss Account
- 16.2 Projected Cash Flow Statement
- 16.3 Projected Balance Sheet
- 16.4 Liquidity Analysis
- 16.5 Profitability Analysis (Payback, NPV, IRR, ROI)
- 16.6 Break-even Analysis
- 16.7 Debt Service Coverage Ratio (DSCR)
- 16.8 Sensitivity Analysis
- 16.9 Scenario and Uncertainty Analysis
17. Funding and Incentives
- 17.1 Means of Finance and Debt-Equity Structure
- 17.2 Loans and Financial Assistance
- 17.3 Government Schemes and Subsidies (PLI, State Policies)
18. Risk Assessment
- 18.1 Key Success Factors
- 18.2 Key Risk Factors
- 18.3 Risk Mitigation
19. Strategic Recommendations
20. Case Study of a Successful Venture
21. Appendix
- 21.1 Detailed Assumptions
- 21.2 Abbreviations
- 21.3 List of Tables and Figures
- 21.4 Sources
This page vs. the full report
| Data point | On this page (free) | In the full report |
|---|---|---|
| Total CapEx | One rounded range at one capacity | Exact figure at three capacities with a line-item breakup |
| CapEx breakup | Category shares (%) only | Cost, quantity and supplier for every machine |
| Operating cost | Share of raw materials, utilities and labor | Per-unit cost sheet with each input price and consumption |
| Profitability | Gross margin range and payback band | Exact IRR, NPV, ROI, break-even and DSCR |
| Financial statements | List of what is included | 10-year P&L, cash flow, balance sheet and Excel model |
| Sensitivity | One directional line | Full sensitivity and scenario tables |
| Process | Simplified flow diagram | Detailed process flow, mass and energy balance, operating conditions |
| Machinery | Names of the main machines | Specifications, capacity, cost and supplier list |
| Market | Headline size, growth and global demand | Segment, region, trade and price forecast tables |
| Suppliers and buyers | Supplier types and sourcing hubs | Named suppliers and buyers |
Hydrochloric Acid project report: FAQs
How much does it cost to set up a hydrochloric acid plant?
Can a hydrochloric acid plant run without its own chlorine supply?
What is the profit margin in hydrochloric acid manufacturing?
What is the payback period for a hydrochloric acid plant?
Which approvals does a hydrochloric acid plant need?
Who buys hydrochloric acid?

About the analyst
Nisha Gupta, Senior Research Analyst
Nisha Gupta is a Senior Research Analyst at Credence Research Inc. who works across industry domains, including packaging, automotive parts and machinery. Her focus is the modelling engine behind each study: she builds quantitative market databases and econometric forecasting frameworks, and developed automated Excel-based market modelling templates that cut client turnaround time by 30%.
Related market research
- Chlorine Market Size, Share, Growth and Forecast 2032
- Caustic Soda Market Size, Share, Growth and Forecast 2032
- Water Treatment Chemicals Market Size, Share and Forecast 2032
- Oilfield Chemicals Market Size, Growth, Share and Forecast 2032
- Industrial Water Treatment Chemicals Market Size, Share and Forecast 2032
- Chlorine Dioxide Market Size, Share, Trends and Forecast 2032
More plant project reports
- Paint Manufacturing Plant Project Report (DPR) 2026
- Carbon Monoxide Manufacturing Plant Project Report (DPR) 2026
- Recycled Plastic Manufacturing Plant Project Report (DPR) 2026
- Grease Manufacturing Plant Project Report (DPR) 2026
- Glycerin Manufacturing Plant Project Report (DPR) 2026
- Naphthalene Balls Manufacturing Plant Project Report (DPR) 2026