
Quick answer
Carbon monoxide is a toxic, flammable gas made mainly from natural gas or coal syngas and purified in a cryogenic cold box for acetic acid, phosgene and oxo chemicals. A greenfield steam reforming plant making 5,000 normal cubic meters an hour of CO, about 50,000 metric tons a year, plus hydrogen, needs an estimated USD 55–105 million of CapEx. Gross margin is about 35–70%, and payback is about 3–11 years.
Viable when built for an anchor chemical customer under a long-term contract with gas cost pass-through and an outlet for the hydrogen, but unsuited to speculative merchant sales because CO cannot be shipped economically.
Carbon Monoxide plant: key highlights
| Parameter | Indicative value | Note |
|---|---|---|
| Plant capacity | 5,000 Nm3/h of CO (about 50,000 metric tons a year) | Plus about 8,600 tons a year of hydrogen at 8,000 operating hours |
| Total CapEx | USD 55–105 million | Greenfield chemical-park site; low end an Asian park, top end a U.S. or EU site |
| Raw material share of operating cost | 45–80% | Natural gas feed and fuel at assumed prices; low end U.S. Gulf Coast gas, top end LNG-priced gas |
| Gross margin | 35–70% | CO and hydrogen revenue minus gas, power and consumables; contract prices assumed |
| Payback period | 3–11 years | 8,000 hours a year and region-matched CapEx; about 5–11 years in the U.S. and EU |
| IRR | Available in report | Post-tax, 10-year model |
| Break-even | Available in report | Capacity utilization basis |
Ranges assume a 5,000 Nm3/h CO steam reforming plant with CO2 recycle and about 12,000 Nm3/h of hydrogen co-product, 8,000 operating hours, greenfield chemical-park sites from Asia to the U.S. or EU, and 2026 prices. Gas, CO, hydrogen and power prices, land rates and fixed costs are assumed. CapEx is scaled from a disclosed 2016 U.S. CO project with assumed escalation. Customizable to any country or region.
What is carbon monoxide?
Carbon monoxide (CO) is a colorless, odorless and tasteless gas made of one carbon atom and one oxygen atom. It is flammable and highly toxic, binding to hemoglobin far more strongly than oxygen. Industry uses it to add carbonyl groups to other molecules.
Commercial grades run from about 98.5% for chemical feed to 99.99% for electronics and specialty uses. Most CO never leaves the complex where it is made. It moves by pipeline from a reformer or gasifier to a neighboring user, often together with hydrogen as syngas, while a small merchant trade fills cylinders and tube trailers for laboratories, electronics and calibration gases.
In the Harmonized System, carbon monoxide falls under subheading 2811.29, other inorganic oxygen compounds of non-metals, and India's tariff lists it separately at 2811.29.40. Main uses include acetic acid by methanol carbonylation, phosgene for polyurethane isocyanates and polycarbonate, oxo alcohols, formic acid and metal carbonyls. Compressed CO ships as UN1016, a Division 2.3 toxic gas with a flammable subsidiary hazard.
Carbon monoxide market overview and global demand
The global carbon monoxide market is worth about USD 6.3 billion in 2025, based on Credence Research's carbon monoxide market study, which values it at USD 6.06 billion for 2024 and projects a 3.9% CAGR to about USD 8.23 billion by 2032. Most CO is made and used inside integrated complexes and priced at cost. The U.S. National Renewable Energy Laboratory puts global production at about 150 million metric tons a year, with an average market price of about USD 0.20 per kilogram, ranging from USD 0.17 to USD 0.26 between 2014 and 2018.
Cross-border trade is negligible, and customs data under HS 2811.29 pool CO with many other compounds, so no meaningful world export figure exists. Supply is organized around pipelines and fence-line plants instead. The U.S. Gulf Coast hosts the densest network, and in May 2023 Air Products announced two Texas plants with more than 70 million standard cubic feet a day of combined capacity to feed its Gulf Coast CO pipeline, describing the Texas City unit as the largest single CO source in the world. China runs a large coal-based CO industry, where gasifiers feed acetic acid, isocyanate and coal-to-ethylene-glycol plants.
Demand follows a handful of derivatives. Acetic acid takes about 0.47 ton of CO per ton, tying CO demand to the acetic acid market. Phosgene, at about 0.28 ton of CO per ton, supplies MDI, TDI and polycarbonate resin plants in East Asia, Europe, the United States and Saudi Arabia, and new polycarbonate capacity in India adds fresh demand. Because a CO plant is tied to one or two neighboring buyers, its business case rests on a long-term supply contract rather than on spot sales.
Carbon monoxide manufacturing process
Commercial CO is made by generating a syngas rich in CO and hydrogen and then separating the CO. Steam methane reforming is the most common route outside China, often with carbon dioxide recycled to the reformer to raise the CO share. Partial oxidation of natural gas or heavy residue gives a CO-richer gas but needs oxygen from an air separation unit, while coal gasification dominates in China. Smaller volumes are recovered from blast furnace, carbide or phosphorus off-gases by pressure swing adsorption, and CO2 electrolysis is starting to serve small on-site users. The reference plant uses reforming with CO2 recycle.
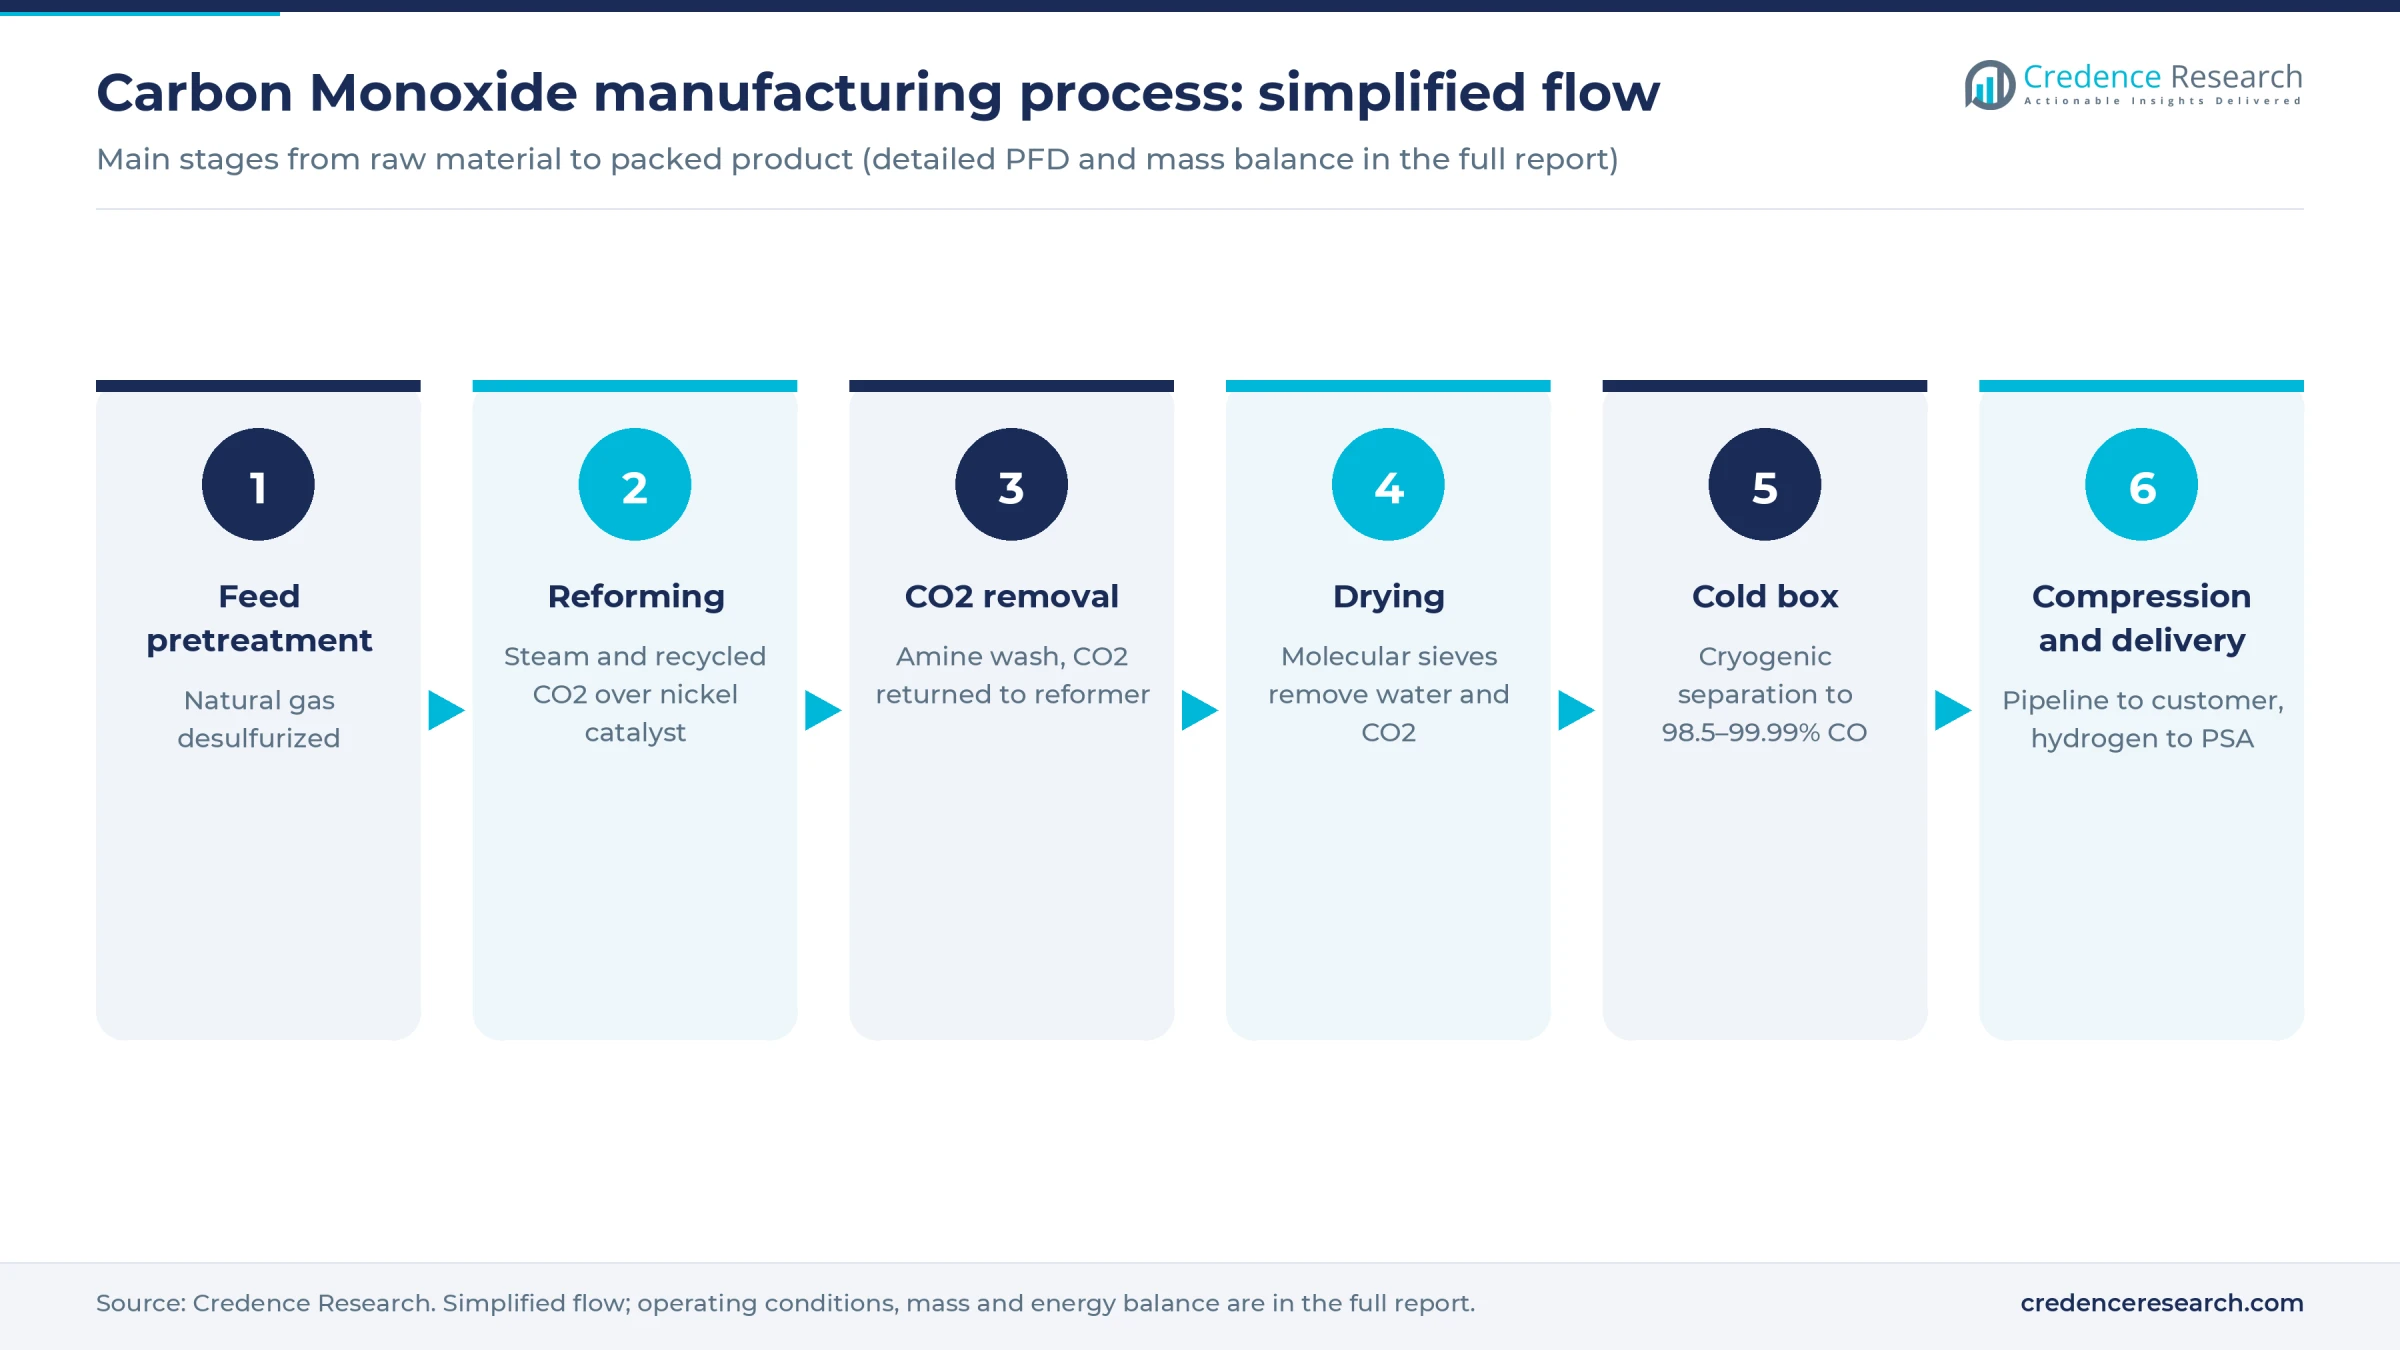
- Feed pretreatment. Natural gas is heated and passed over hydrogenation and zinc oxide beds that remove sulfur, which would poison the nickel reforming catalyst.
- Reforming. Gas and steam react in catalyst-filled tubes inside a fired furnace at about 850–950 degrees Celsius. Recycled CO2 pushes the balance toward CO, giving about 2–3 volumes of hydrogen per volume of CO.
- Heat recovery and CO2 removal. A waste heat boiler raises steam from the hot syngas, and an amine wash strips CO2, which is compressed and returned to the reformer.
- Drying. Molecular sieve adsorbers remove the last traces of water and CO2, since both would freeze inside the cold box.
- Cryogenic separation. In a cold box, partial condensation or a methane wash separates CO from hydrogen and methane at about minus 180 degrees Celsius, giving CO of 98.5% to 99.99% purity. Crude hydrogen goes to a pressure swing adsorption unit for 99.9% product.
- Compression and delivery. CO is compressed into a pipeline to the customer, and a small share can be polished further and filled into cylinders.
Process safety shapes the design more than chemistry does. Because CO has no odor, fixed detectors and personal monitors are needed site-wide. CO also reacts with nickel at low temperatures to form nickel carbonyl, an extremely toxic vapor, so reformer start-up and shutdown purges are tightly controlled. At high pressure CO can attack carbon steel and form iron carbonyl, which is why piping and compressors use stainless or suitable alloy steels.
Carbon monoxide plant setup cost
The reference plant produces 5,000 normal cubic meters an hour of CO, about 150 metric tons a day or 50,000 tons a year over 8,000 operating hours, plus about 12,000 normal cubic meters an hour of hydrogen, or 8,600 tons a year. Total CapEx is estimated at USD 55–105 million, for a greenfield chemical-park site, covering land, process units, utilities, preoperative costs and working capital.
The anchor is a disclosed U.S. project. In April 2016, Praxair announced an investment of more than USD 100 million at Geismar, Louisiana, for a CO purification train of 13 million standard cubic feet a day with a new cold box and other upgrades, equal to about 14,500 normal cubic meters an hour. Escalated to 2026 by an assumed 40–50% and scaled down with a 0.6 capacity exponent, that gives about USD 74–79 million for a 5,000-cubic-meter plant at an existing U.S. site. Assumed greenfield adders of 15–30% for land, offsites and working capital lead to USD 85–105 million for a U.S. or EU site. An Asian chemical park, assumed at 65–75% of U.S. cost, comes to about USD 55–77 million. The benchmark did not itemize its reformer scope, which is one reason the range is wide.
For the land row, the plant needs about 40,000 square meters, an assumed figure that includes safety distances around the reformer and the toxic gas inventory. At an assumed USD 15–60 per square meter, land costs USD 600,000 to USD 2.4 million, about 2% of mid-range CapEx.
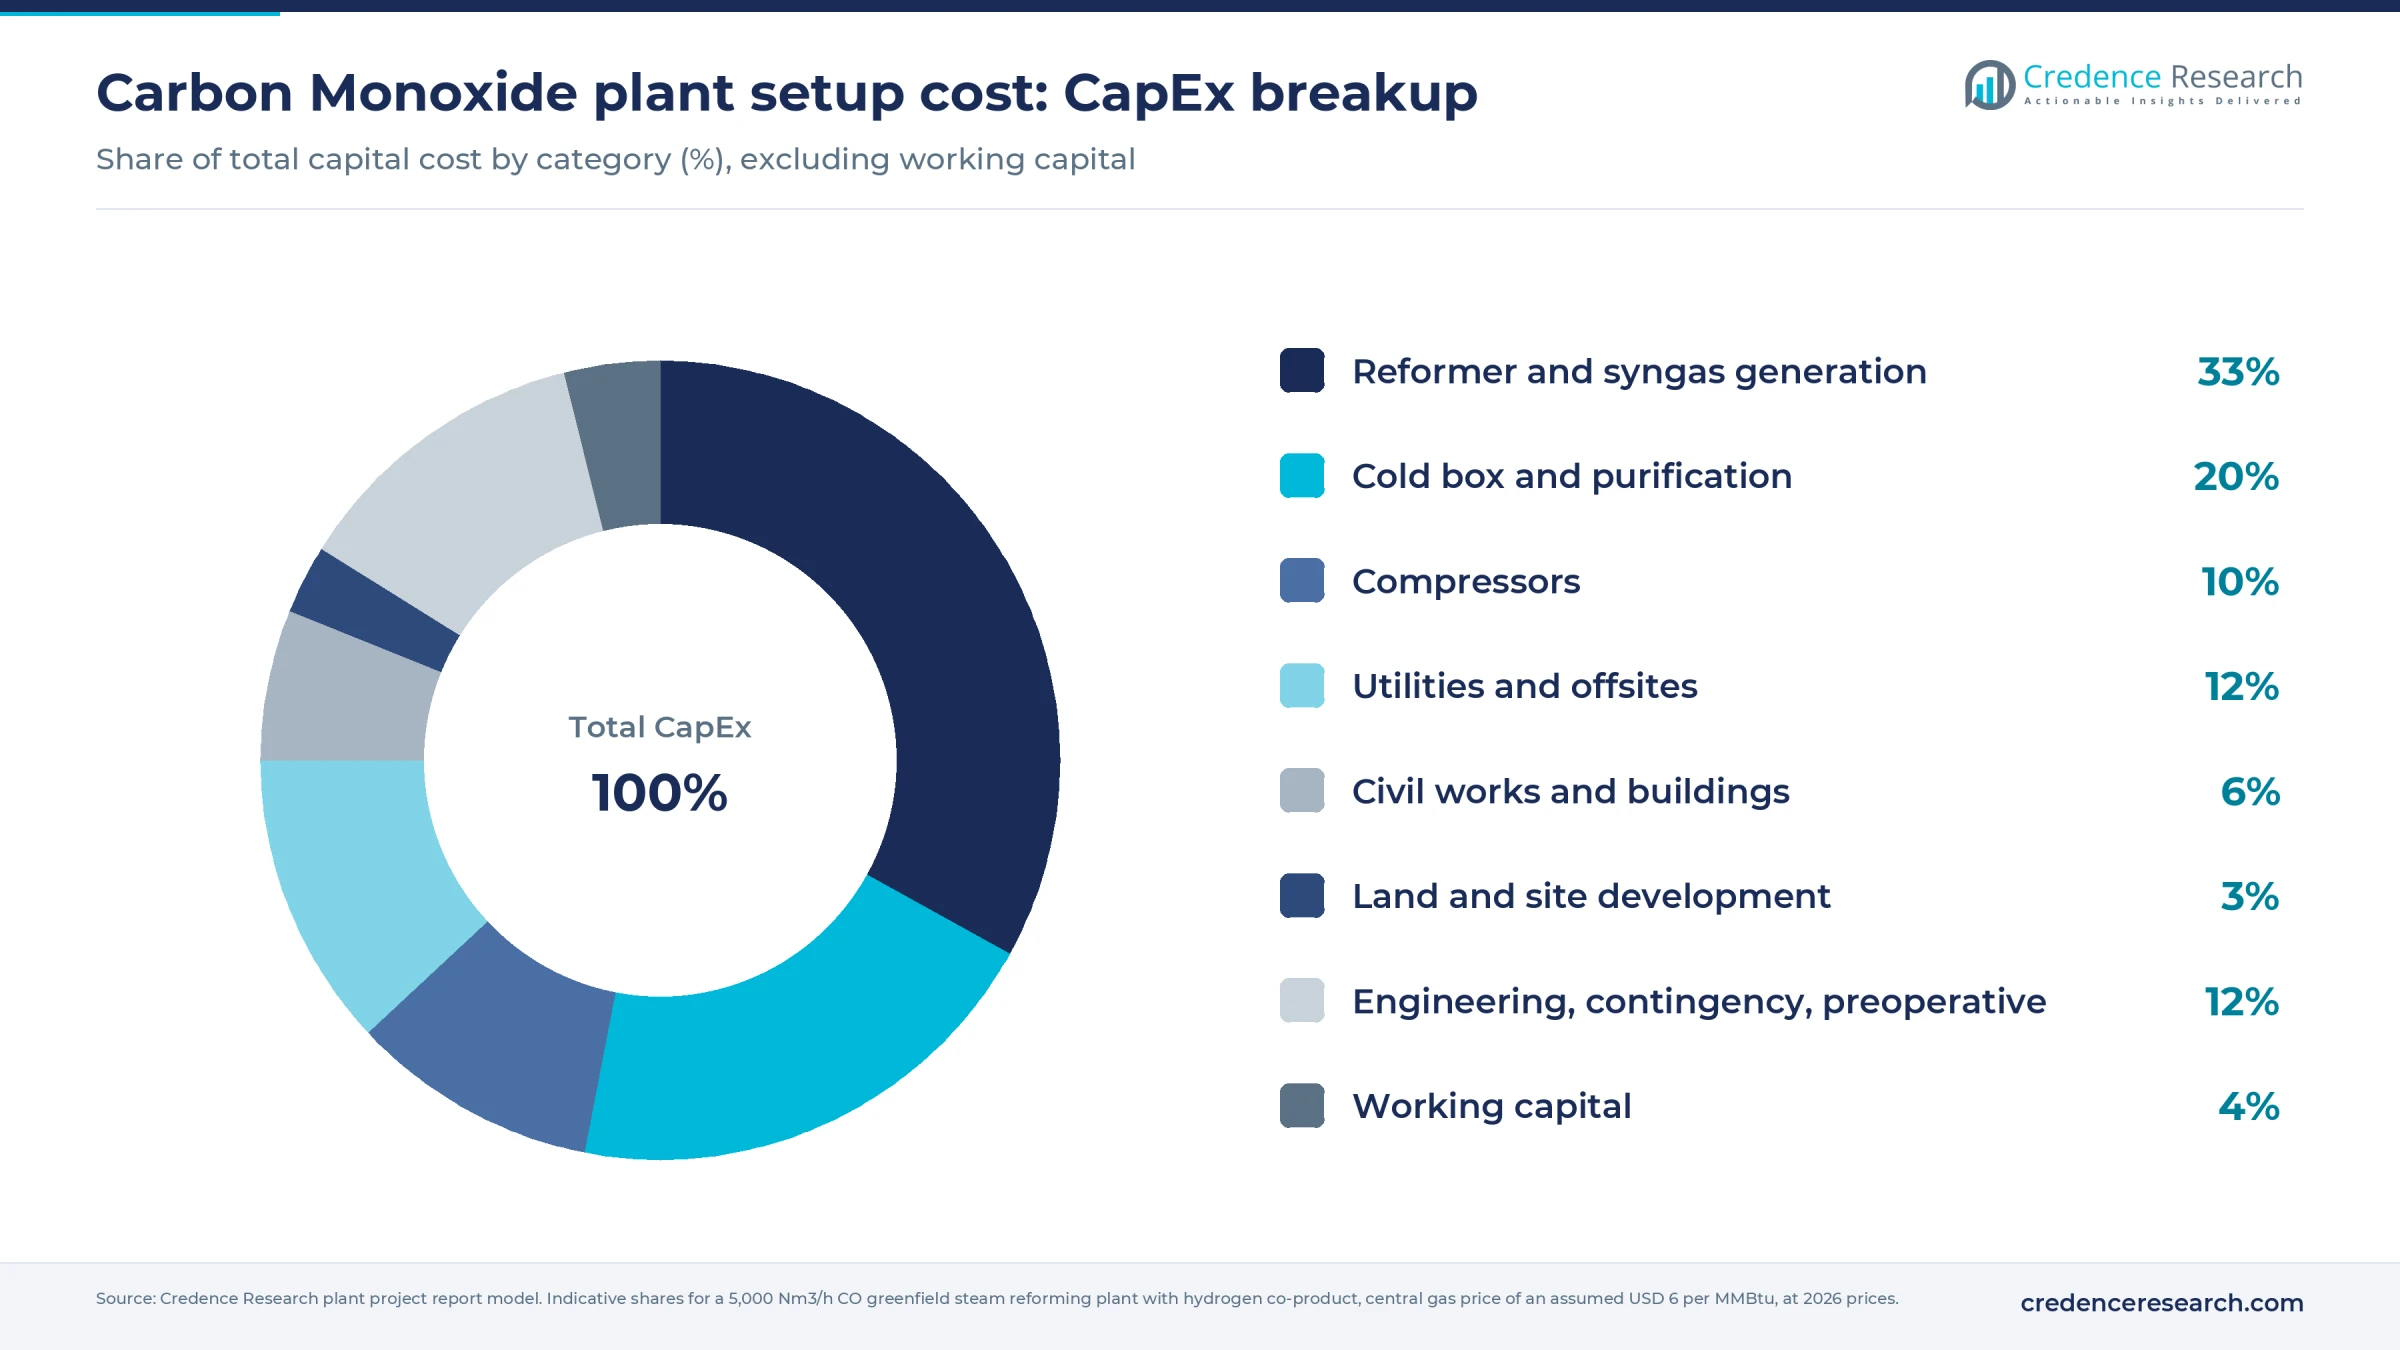
The reformer and syngas section take about a third of CapEx, and the cold box and purification about a fifth. Running cost is then dominated by one input.
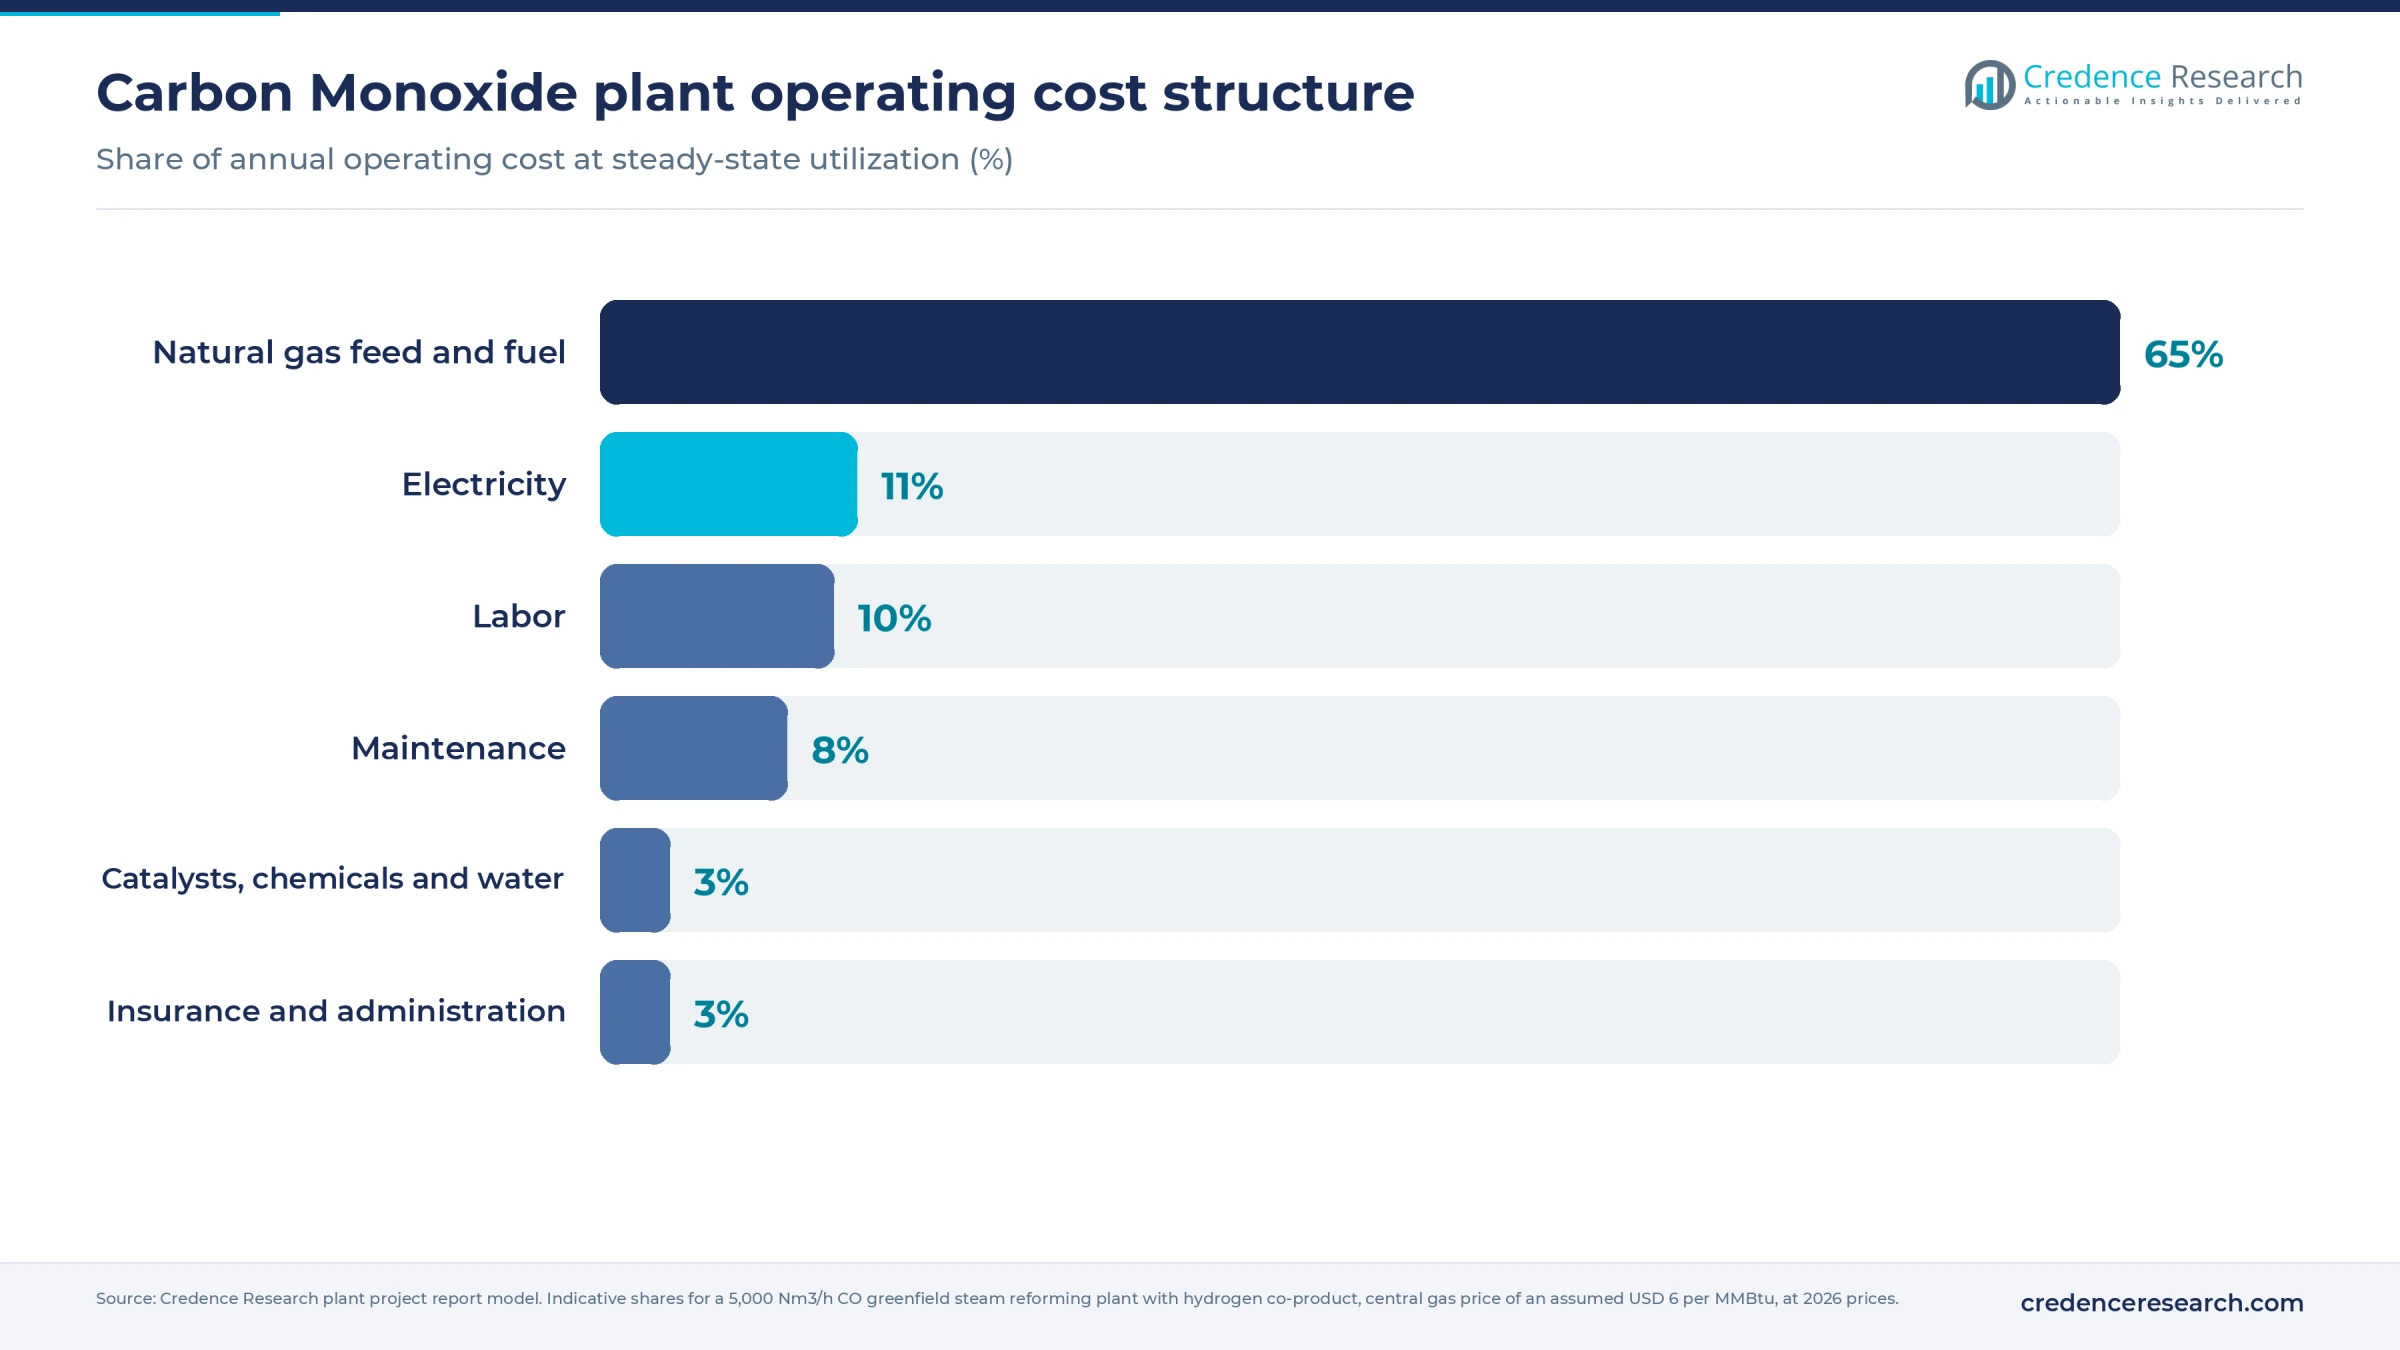
Natural gas makes up about 65% of operating cost in the central case, so the gas contract and its pass-through terms decide the project. The full report can be customized to any country or region.
Machinery and raw materials for a carbon monoxide plant
The main equipment groups are listed below; ratings, makes and the full schedule are in the report.
- Natural gas compressor, preheater, hydrogenator and zinc oxide desulfurization beds
- Steam methane reformer furnace with catalyst tubes, burners and convection section
- Waste heat boiler, steam drum, syngas coolers and boiler feed water system
- Amine CO2 absorber and regenerator with a CO2 recycle compressor
- Molecular sieve dryers with regeneration heaters
- CO cold box with plate-fin heat exchangers, separators and columns
- Hydrogen pressure swing adsorption unit
- CO product compressor, pipeline metering and an optional cylinder filling line
- Fixed CO and flammable gas detectors, flare, safety instrumented system and a laboratory gas chromatograph
At 8,000 hours, the reference plant uses an assumed 2.25 million MMBtu of natural gas a year as feed and fuel. Gas comes from the main producing basins of the United States, the Middle East, Russia and Central Asia, Norway and Australia, while LNG from the United States, Qatar and Australia sets the price in Europe and much of Asia. Coal-based plants draw on China, Indonesia and Australia, and partial oxidation plants need oxygen from an on-site air separation unit. Nickel reforming catalysts, amines and molecular sieves come from suppliers in Europe, the United States, Japan and China. The co-produced hydrogen often goes to the same customer or into a pipeline network, which links CO projects to the merchant hydrogen generation market.
Carbon monoxide business profit margin and ROI
Gross margin is estimated at 35–70%, measured as revenue from CO and hydrogen minus natural gas, power and consumables. The build uses assumed contract prices because CO rarely trades openly. At a low-cost gas site, such as the U.S. Gulf Coast or the Middle East, gas is assumed at USD 3.25–4 per MMBtu, CO at USD 300–375 per ton and hydrogen at USD 1,300–1,700 per ton. At an LNG-priced site in Europe or Asia, gas is assumed at USD 8.50–10.50, CO at USD 500–525 and hydrogen at USD 2,150–2,300. These CO prices sit above the 2014–2018 average of about USD 200 per ton because a new plant must recover its capital, unlike depreciated pipeline supply.
Revenue is about USD 26–35 million a year at the low-cost site and USD 43–46 million at the LNG-priced site. After assumed fixed costs of about USD 3–6 million for staff, maintenance and insurance, annual cash profit is about USD 9–21 million, which puts payback at about 3–11 years on region-matched CapEx. The U.S. and EU cases land at about 5–11 years and the Asian case at about 3–6 years.
Natural gas is the main sensitivity. Each USD 1 per MMBtu change moves cost by about USD 2.25 million a year, so most supply contracts pass gas cost through to the buyer and pay the producer a fixed facility fee.
| Metric | Value |
|---|---|
| Gross margin | 35–70% |
| Payback period | 3–11 years |
| IRR (post-tax) | Available in report |
| NPV | Available in report |
| Return on investment | Available in report |
| DSCR | Available in report |
| Break-even utilization | Available in report |
How to start a carbon monoxide business, licenses and approvals
Approval steps follow a common path: company and tax registration, land use and building permits, an air permit for reformer emissions, wastewater approval, process safety and fire clearances for a toxic and flammable gas, pressure equipment certification, chemical registration, and dangerous goods rules for cylinder sales. Greenhouse gas reporting or emissions trading can also apply, because a reformer releases large volumes of CO2.
| Market | Key approvals for a carbon monoxide plant |
|---|---|
| United States | State air construction permit and a Title V operating permit where thresholds are met; EPA Greenhouse Gas Reporting Program for hydrogen production under 40 CFR Part 98 Subpart P; OSHA process safety management under 29 CFR 1910.119 where flammable gas inventories exceed 10,000 pounds, and the OSHA exposure limit of 50 ppm under 29 CFR 1910.1000; DOT hazardous materials rules in 49 CFR for UN1016 cylinders and tube trailers |
| European Union | Industrial Emissions Directive permit, which lists production of carbon oxides; EU Emissions Trading System coverage for hydrogen and synthesis gas production; REACH registration and CLP labeling as a flammable, acutely toxic and reproductive-toxic gas; Seveso III duties based on toxic and flammable gas inventories; Pressure Equipment Directive; ADR rules and the Transportable Pressure Equipment Directive for cylinders |
| India | Consent to establish and operate from the state pollution control board under the Air and Water Acts; factory license and plan approval under the Factories Act; PESO licenses under the Static and Mobile Pressure Vessels (Unfired) Rules, 2016 and the Gas Cylinders Rules, 2016 for storage and filling; MSIHC Rules, 1989 duties for hazardous chemical inventories and on-site emergency plans |
Toxic release planning usually sets the timeline, since regulators examine CO inventories, detection and the area a release could reach.
Key carbon monoxide manufacturers and recent developments
Pipeline and merchant CO is led by industrial gas groups: Air Products, Linde, which absorbed Praxair, and Air Liquide across North America, Europe and Asia, plus Nippon Sanso Holdings through Matheson and Yingde Gases in China. Far more CO is made captively by chemical producers such as Celanese, Eastman, BASF, Covestro, Wanhua Chemical and LyondellBasell. Specialty gas packagers fill cylinders, and licensors such as Topsoe offer CO2 electrolysis for small on-site needs.
- May 2026: Deepak Chem Tech agreed with Praxair India, a Linde company, on an on-site HyCO plant at its planned polycarbonate complex at Dahej, Gujarat, with commissioning expected in 2028.
- June 2026: Twelve opened AirPlant One at Moses Lake, Washington, where electrolysis turns captured CO2 and water into syngas, a mix of CO and hydrogen, for jet fuel, with a first phase of 40,000–50,000 gallons a year.
- July 2026: Air Liquide said it will invest more than USD 200 million in a partial oxidation unit at Oxea's Bay City, Texas, site to supply syngas and low-carbon hydrogen, with start-up planned for early 2029.
What's inside the Carbon Monoxide project report PDF
The report runs to 21 chapters. Open a chapter to see its sections.
1. Preface
2. Scope and Methodology
- 2.1 Objectives of the Study
- 2.2 Stakeholders
- 2.3 Research Methodology
- 2.4 Data Sources and Key Assumptions
3. Executive Summary
- 3.1 Market Snapshot
- 3.2 Project at a Glance (Capacity, CapEx, OpEx)
- 3.3 Key Financial Indicators (IRR, NPV, Payback, Break-even)
- 3.4 Feasibility Verdict
4. Product Overview
- 4.1 Carbon Monoxide Definition and Properties
- 4.2 Grades and Specifications (BIS / ISO / ASTM)
- 4.3 HS Code and Classification
- 4.4 Key Applications
- 4.5 Substitutes
5. Global Carbon Monoxide Market
- 5.1 Market Overview
- 5.2 Historical and Current Market Performance (Volume and Value)
- 5.3 Market Breakup by Grade / Type
- 5.4 Market Breakup by End-Use Industry
- 5.5 Market Breakup by Region
- 5.6 Market Drivers, Restraints and Trends
- 5.7 Value Chain Analysis
- 5.8 Market Forecast
6. Target Country Carbon Monoxide Market Analysis
- 6.1 Demand and Supply Analysis
- 6.2 Installed Capacity vs Demand Gap
- 6.3 Import Dependence
- 6.4 Demand Forecast by End-Use
7. Trade Analysis
- 7.1 Imports by Volume, Value and Country
- 7.2 Exports by Volume, Value and Country
- 7.3 Trade Balance and Opportunities
8. Price Analysis
- 8.1 Historical Carbon Monoxide Price Trends by Region
- 8.2 Raw Material / Feedstock Price Trends and Linkage
- 8.3 Price Forecast
- 8.4 Margins Across the Value Chain
9. Competitive Landscape
- 9.1 Market Structure
- 9.2 Key Players and Installed Capacities
- 9.3 Profiles of Key Players
- 9.4 Recent Developments (Expansions, M&A, New Plants)
10. Manufacturing Process and Technology
- 10.1 Comparison of Technology Routes
- 10.2 Selected Route and Process Flow Diagram
- 10.3 Unit Operations Involved
- 10.4 Chemical Reactions Involved
- 10.5 Mass Balance and Raw Material Requirements
- 10.6 Energy Balance
- 10.7 Quality Assurance Criteria and Technical Tests
- 10.8 By-products and Waste Handling
- 10.9 Technology Licensors / Providers
11. Project Details, Requirements and Costs
- 11.1 Land, Location and Site Development
- 11.1.1 Site Selection Criteria
- 11.1.2 Location Analysis
- 11.1.3 Land Requirement and Costs
- 11.1.4 Site Development Costs
- 11.2 Plant Layout
- 11.2.1 Layout Principles
- 11.2.2 Proposed Layout
- 11.2.3 Factors Influencing Layout
- 11.3 Civil Works and Buildings
- 11.4 Plant Machinery
- 11.4.1 Machinery Requirements and Specifications
- 11.4.2 Machinery Costs
- 11.4.3 Machinery Suppliers
- 11.5 Raw Materials
- 11.5.1 Requirements per Tonne of Output
- 11.5.2 Procurement and Sourcing
- 11.5.3 Costs
- 11.5.4 Suppliers
- 11.6 Packaging
- 11.6.1 Packaging Requirements
- 11.6.2 Packaging Costs
- 11.6.3 Packaging Suppliers
- 11.7 Storage and Material Handling
- 11.8 Transportation Requirements and Costs
- 11.9 Utilities
- 11.9.1 Power Requirements and Costs
- 11.9.2 Water Requirements and Costs
- 11.9.3 Steam, Fuel and Other Utilities
- 11.10 Manpower Requirements and Wages
12. Environment, Health, Safety and Sustainability
- 12.1 Effluent and Emissions Management
- 12.2 Hazard Classification and Safety Measures
- 12.3 Carbon Footprint
- 12.4 Green / Low-Carbon Process Options
13. Regulatory Procedures, Approvals and Certifications
- 13.1 Licences and Registrations
- 13.2 Environmental Clearances
- 13.3 Product Certifications (BIS, REACH, etc.)
- 13.4 Approval Timeline
14. Project Implementation Schedule
15. Project Economics
- 15.1 Capital Cost of the Project
- 15.2 Techno-Economic Parameters
- 15.3 Capacity Utilization and Ramp-up
- 15.4 Product Pricing and Margins
- 15.5 Income Projections
- 15.6 Expenditure Projections
- 15.7 Working Capital Requirement
- 15.8 Taxation
- 15.9 Depreciation
16. Financial Analysis
- 16.1 Projected Profit and Loss Account
- 16.2 Projected Cash Flow Statement
- 16.3 Projected Balance Sheet
- 16.4 Liquidity Analysis
- 16.5 Profitability Analysis (Payback, NPV, IRR, ROI)
- 16.6 Break-even Analysis
- 16.7 Debt Service Coverage Ratio (DSCR)
- 16.8 Sensitivity Analysis
- 16.9 Scenario and Uncertainty Analysis
17. Funding and Incentives
- 17.1 Means of Finance and Debt-Equity Structure
- 17.2 Loans and Financial Assistance
- 17.3 Government Schemes and Subsidies (PLI, State Policies)
18. Risk Assessment
- 18.1 Key Success Factors
- 18.2 Key Risk Factors
- 18.3 Risk Mitigation
19. Strategic Recommendations
20. Case Study of a Successful Venture
21. Appendix
- 21.1 Detailed Assumptions
- 21.2 Abbreviations
- 21.3 List of Tables and Figures
- 21.4 Sources
This page vs. the full report
| Data point | On this page (free) | In the full report |
|---|---|---|
| Total CapEx | One rounded range at one capacity | Exact figure at three capacities with a line-item breakup |
| CapEx breakup | Category shares (%) only | Cost, quantity and supplier for every machine |
| Operating cost | Share of raw materials, utilities and labor | Per-unit cost sheet with each input price and consumption |
| Profitability | Gross margin range and payback band | Exact IRR, NPV, ROI, break-even and DSCR |
| Financial statements | List of what is included | 10-year P&L, cash flow, balance sheet and Excel model |
| Sensitivity | One directional line | Full sensitivity and scenario tables |
| Process | Simplified flow diagram | Detailed process flow, mass and energy balance, operating conditions |
| Machinery | Names of the main machines | Specifications, capacity, cost and supplier list |
| Market | Headline size, growth and global demand | Segment, region, trade and price forecast tables |
| Suppliers and buyers | Supplier types and sourcing hubs | Named suppliers and buyers |
Carbon Monoxide project report: FAQs
How much does it cost to set up a carbon monoxide plant?
Which process is best for carbon monoxide production?
What is the profit margin in carbon monoxide manufacturing?
What is the payback period for a carbon monoxide plant?
Which approvals does a carbon monoxide plant need?
Who buys carbon monoxide?

About the analyst
Nisha Gupta, Senior Research Analyst
Nisha Gupta is a Senior Research Analyst at Credence Research Inc. who works across industry domains, including packaging, automotive parts and machinery. Her focus is the modelling engine behind each study: she builds quantitative market databases and econometric forecasting frameworks, and developed automated Excel-based market modelling templates that cut client turnaround time by 30%.
Related market research
- Carbon Monoxide Market Size, Share and Forecast 2032
- Acetic Acid Market Size, Growth, Share, Trends and Forecast 2032
- Polycarbonate Market Size, Share, Growth and Forecast 2032
- Chemical Merchant Hydrogen Generation Market Size, Growth and Forecast 2032
- Toluene Diisocyanates Market Size, Growth, Share and Forecast 2032
- Carbon Monoxide Gas Sensors Market Size, Share and Forecast 2032
More plant project reports
- Paint Manufacturing Plant Project Report (DPR) 2026
- Hydrochloric Acid Manufacturing Plant Project Report (DPR) 2026
- Recycled Plastic Manufacturing Plant Project Report (DPR) 2026
- Grease Manufacturing Plant Project Report (DPR) 2026
- Glycerin Manufacturing Plant Project Report (DPR) 2026
- Naphthalene Balls Manufacturing Plant Project Report (DPR) 2026