
Quick answer
A paint plant disperses titanium dioxide and extenders in water, then blends in an acrylic or vinyl-acrylic emulsion binder and additives to make water-based decorative wall paint. A 30 million liter a year plant needs fixed CapEx of about USD 15–23 million at an Asian industrial park and an assumed USD 30–50 million at a U.S. or EU site. Gross margin runs about 35–45% at 2026 prices, and midpoint payback takes about 3.5–5.5 years.
Viable for a producer with a dealer network, tinting systems and a regional brand plan; risky for a newcomer that expects the plant alone to win shelf space from entrenched national brands.
Paint plant: key highlights
| Parameter | Indicative value | Note |
|---|---|---|
| Plant capacity | 30 million liters a year (about 40,000 TPA) | Water-based decorative emulsions and primers, two shifts over 300 days, about 1.35 kg per liter |
| Total CapEx | USD 15–23 million | Asian industrial park; assumed USD 30–50 million at a U.S. or EU site; excludes working capital |
| Raw material share of operating cost | 46–52% | Titanium dioxide, binder emulsion, extenders and additives, with selling and dealer support in total cost |
| Gross margin | 35–45% | After materials, packaging and conversion; assumed net realization of USD 1.40–1.90 per kg |
| Payback period | 3.5–5.5 years | Midpoint margin at 60% utilization, on CapEx plus working capital margin; past 8 years near a 35% margin |
| IRR | Available in report | Post-tax, 10-year model |
| Break-even | Available in report | Capacity utilization basis |
Ranges assume a 30 million liter a year water-based decorative paint plant on 4 hectares at an Asian industrial park, 2026 prices, 60% utilization in the payback case, assumed titanium dioxide of USD 2,600–3,200 per tonne, assumed binder emulsion of USD 1,100–1,400 per tonne and assumed net realization of USD 1.40–1.90 per kg. Currency at assumed RM 4.70, IDR 16,700 and EUR 0.855 per USD. U.S. and EU costs are assumed multiples. Customizable to any country.
What is paint?
Paint is a liquid coating that dries into a thin, colored film to decorate and protect a surface. Decorative or architectural paint, the kind used on walls, ceilings, facades, doors and trim, combines four building blocks: a binder that forms the film, pigments that give color and hiding power, extenders that add bulk and control sheen, and a liquid carrier, along with small doses of additives.
This report covers a water-based decorative plant. Its range runs from interior matt and silk emulsions to exterior acrylic facade paints, water-based primers and undercoats, sold in white and tintable bases. Solvent-borne alkyd enamels and wood varnishes are left out, because they need flammable solvent storage and explosion-proof equipment.
Tariff treatment follows the carrier and the binder. Acrylic and vinyl-acrylic emulsion paints, the core of this plant's output, fall under HS code 320910, paints and varnishes based on acrylic or vinyl polymers dispersed or dissolved in an aqueous medium. Water-based paints on other synthetic polymers go to 320990, solvent-borne paints to heading 3208, and distempers and other paints to 321000. Buyers include homeowners and painting contractors through dealers and home centers and property developers.
Paint market overview and global demand
The global decorative paints market works out to about USD 82.5 billion in 2025, based on the Credence Research decorative paints and coatings market report's USD 78.15 billion for 2024 and a 5.53% CAGR, rising to about USD 120.2 billion by 2032. Decorative products are the largest slice of the wider paints and coatings market, which Credence Research put at USD 214.5 billion in 2024.
Paint is heavy, mostly water and low in value per kilogram, so most of it is made close to where it is applied. Trade data still show the price spread between markets. European Union exporters shipped about 267,000 tonnes of HS 320910 paints worth about USD 805 million in 2023, an average of about USD 3.0 per kilogram, with the United Kingdom, Switzerland, China and the U.S. as top buyers, World Bank WITS data show. Turkey, which sells mainly to Iraq, Russia and Georgia, shipped about 46,800 tonnes at about USD 1.6 per kilogram. That gap marks the distance between premium European brands and value brands in nearby emerging markets.
In mature markets such as the U.S., Western Europe and Japan, repainting of existing homes drives most volume, so sales track home resales and remodeling more than new construction. In China, the largest producer, paint for new housing has weakened with the property slowdown, while India, Southeast Asia, the Middle East and Africa add volume through urbanization and first-time painting of homes. Volatile organic compound limits keep pushing the mix toward waterborne coatings, and emulsions now dominate interior wall paint in most regions.
Paint manufacturing process
Water-based paint is made in batches at room temperature, with no chemical reaction inside the plant. The binder arrives as a ready-made polymer emulsion, so the plant's skill lies in dispersing pigment well and holding each batch to a tight color and viscosity window. Poor dispersion wastes titanium dioxide, the costliest ingredient, because clumped particles scatter less light.
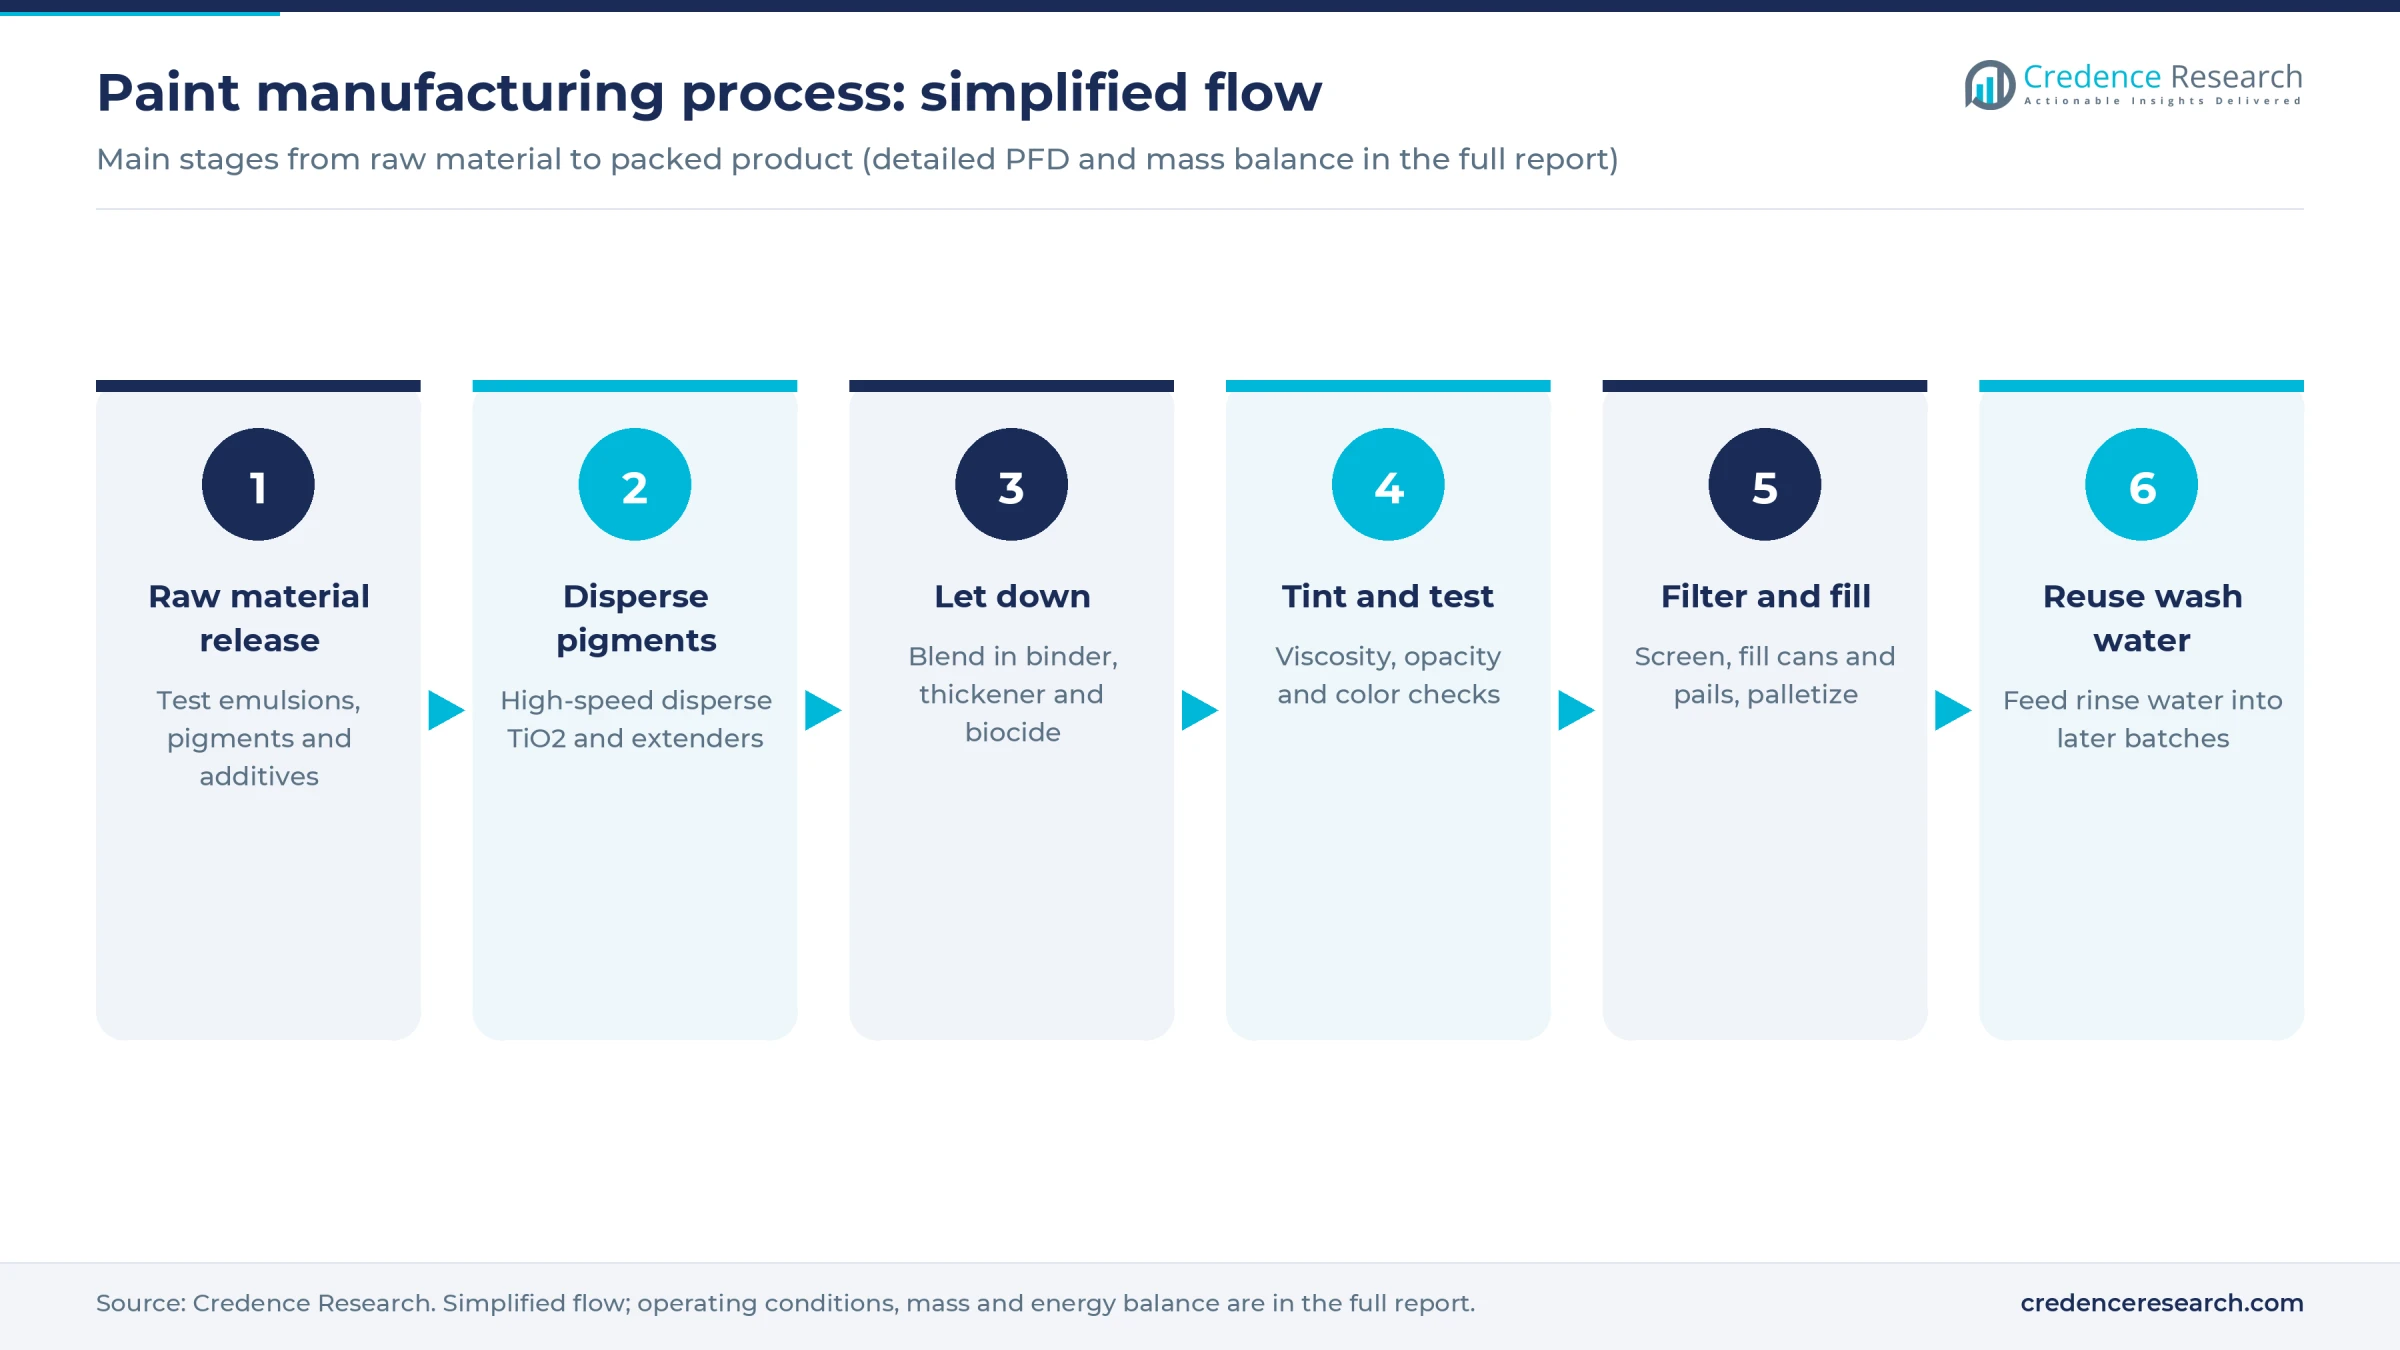
- Raw material release. The lab checks solids content, pH and viscosity of incoming emulsions, the brightness and oil absorption of titanium dioxide and extenders, and the strength of thickeners and biocides.
- Premix and high-speed dispersion. Water, dispersant, wetting agent, defoamer and part of the thickener are charged to a dispersion vessel. Titanium dioxide and extenders such as calcium carbonate, kaolin and talc are fed under a high-speed disperser running at a blade tip speed of roughly 18–25 meters per second until the mill base reaches its target fineness on a Hegman gauge.
- Let-down. The mill base moves to a larger tank with slow agitation. Acrylic or vinyl-acrylic emulsion, coalescing agent, the rest of the water, associative or cellulosic thickener, in-can preservative and a pH adjuster go in by sequence, since dumping emulsion into an unstable mill base can shock it into grit.
- Tinting and quality control. Each batch is checked for Krebs viscosity, density, pH, opacity, gloss and color against a standard with a spectrophotometer, then shaded with colorant if needed. Many plants make white and tint bases for in-store tinting machines rather than hundreds of ready-mixed colors.
- Filtration and filling. Paint passes through vibrating screens or bag filters and is filled into 1, 4, 10 and 20 liter containers, then labeled and palletized.
- Wash water reuse. Rinse water from tanks is fed back into later batches of similar color, which cuts the effluent load.
Batches typically run 5,000–20,000 liters, and the dispersion step takes about one to two hours. Because the process is cold and mostly mechanical, power and labor are small costs, and output is set by the number of let-down tanks and filling lines rather than by any reactor.
Paint plant setup cost
The indicative build is a 30 million liter a year water-based decorative paint plant, about 100,000 liters a day over 300 days on two shifts, or roughly 40,000 tonnes a year at about 1.35 kilograms per liter. Fixed CapEx comes to about USD 15–23 million at an Asian industrial park and an assumed USD 30–50 million at a U.S. or EU site, where buildings, automation and labor cost more. Working capital of about USD 8–11 million is excluded, and the full report can be recast for any country.
Disclosed plants anchor this estimated range. SMART Asia Chemical opened an RM100 million plant in Perak, Malaysia, in May 2024 that added 27 million liters of yearly capacity for decorative paints and protective coatings, the Malaysian Investment Development Authority reported. That is about USD 21 million, or about USD 22.6 million scaled to 30 million liters with the six-tenths rule. Jotun's IDR 1 trillion water-based plant in Cikarang, Indonesia, about USD 60 million for projected site capacity of 100 million liters, scales to about USD 29 million. Asian paints' EUR 217 million greenfield plant at Indore, India, adding 400 million liters, works out to about USD 0.64 per liter of yearly capacity, or USD 19 million at this size on a straight-line basis.
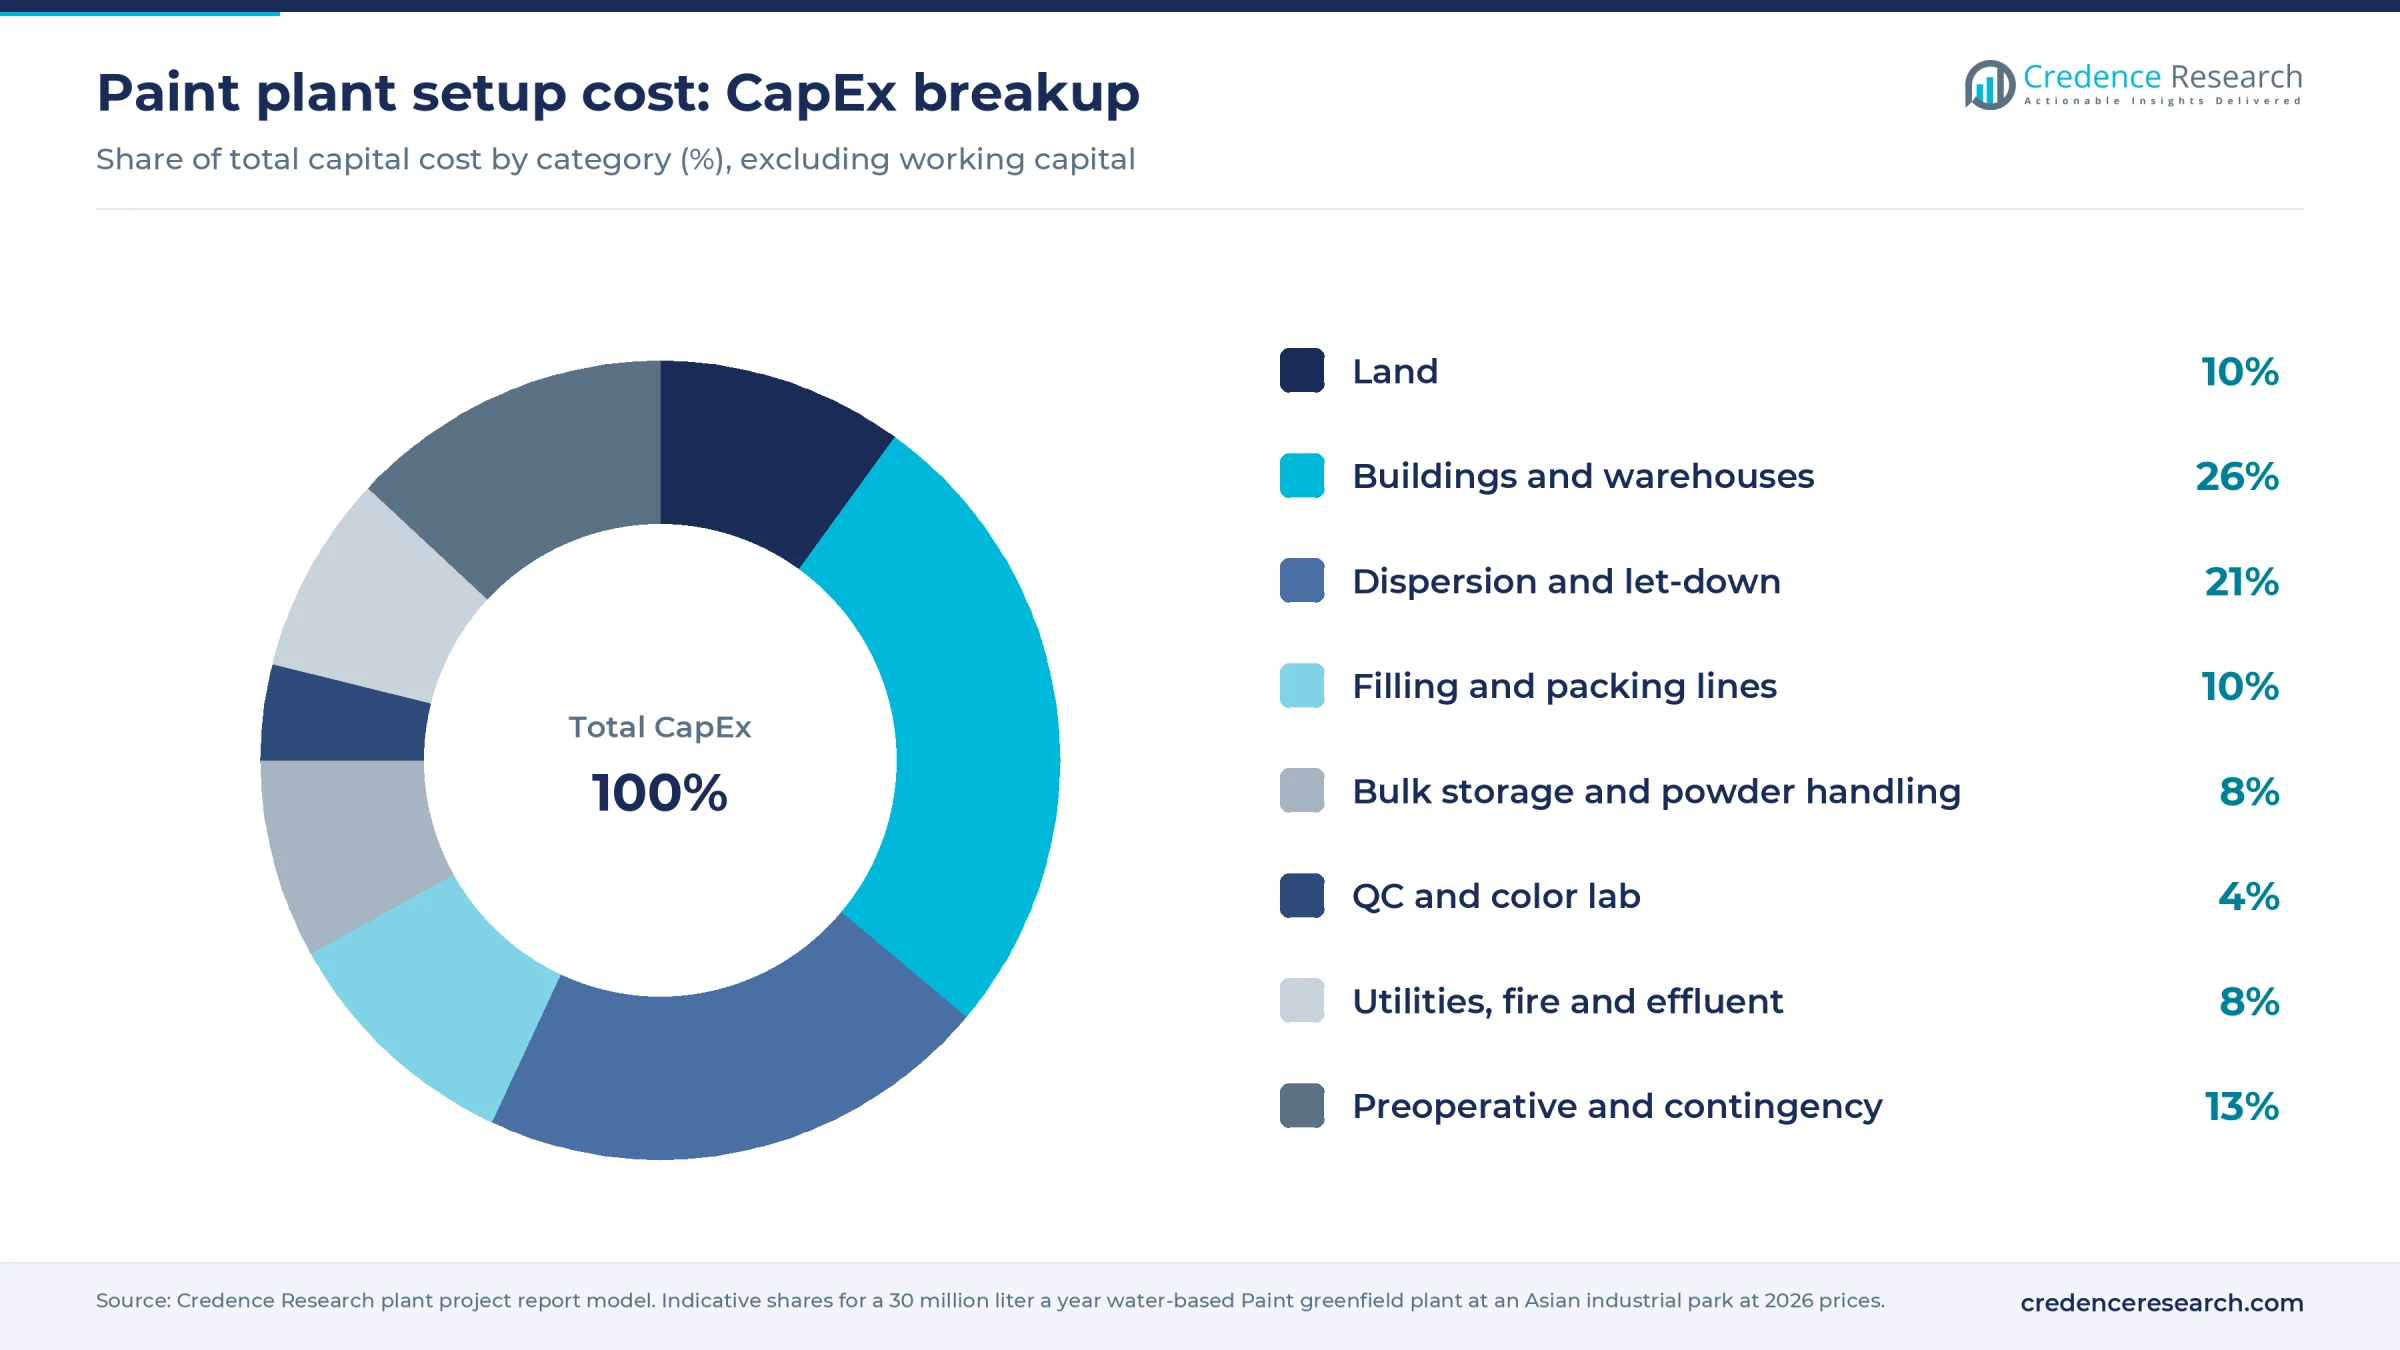
Land shows how each row was built. At an assumed USD 35–55 per square meter, a 4 hectare plot costs about USD 1.4–2.2 million, or about 10% of CapEx at the midpoint. Buildings and warehouses take the largest share, about 26%, since finished paint needs large covered storage, followed by dispersion and let-down equipment at 21%.
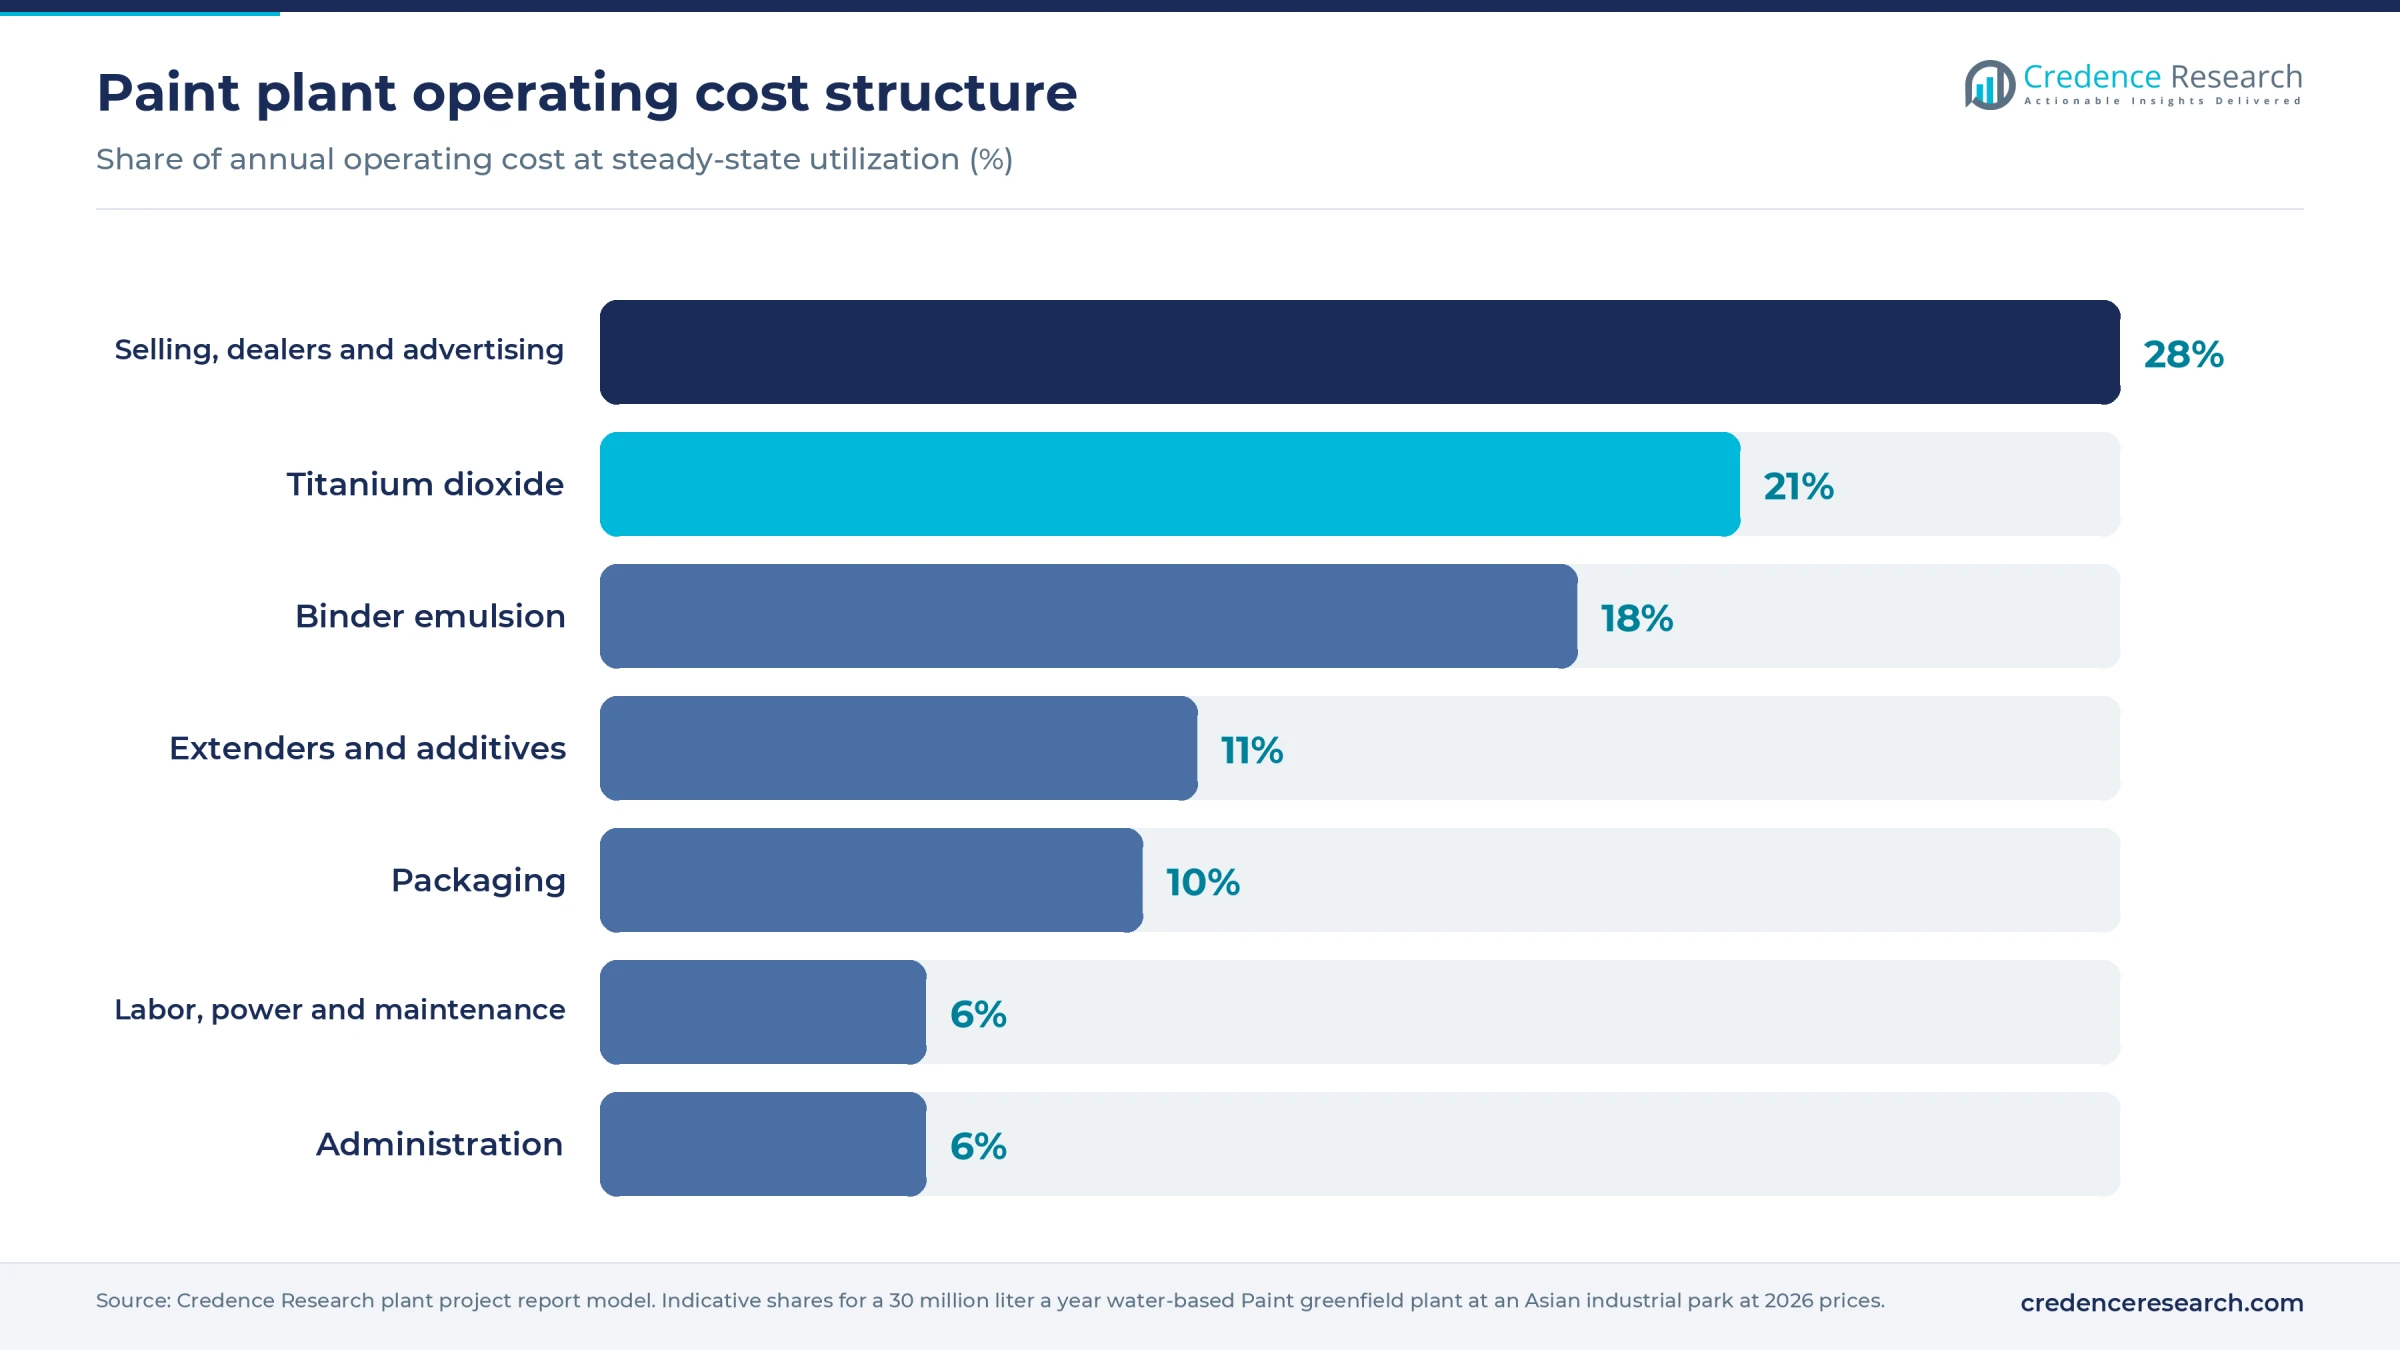
Selling, dealer support and advertising take about 28% of cash cost for a brand sold through retail. Titanium dioxide takes about 21% and binder emulsion about 18%. Each USD 500 per tonne change in titanium dioxide moves cost by about USD 0.05 per kilogram of paint, or roughly 3 margin points.
Machinery and raw materials for a paint plant
The core line includes high-speed dispersers with variable-speed drives, dispersion vessels of 2,000–5,000 liters, let-down tanks of 10,000–20,000 liters with low-shear agitators, a horizontal bead mill for colorant pastes, and powder handling with bag-dump stations, dust collectors and screw conveyors. Bulk tanks hold binder emulsions and process water, moved by diaphragm or lobe pumps that do not shear the emulsion. Finishing needs vibrating screens or bag filters, automatic filling and capping lines for cans and pails, labeling and palletizing. The lab needs a Stormer viscometer, spectrophotometer, gloss meter, opacity charts, a scrub tester and a weathering cabinet.
Titanium dioxide is the critical input. China held about 6.0 million tonnes of the world's 9.9 million tonnes of pigment capacity at the end of 2025, the U.S. Geological Survey estimates, with the U.S., Mexico, Germany, Japan, Australia and Saudi Arabia making most of the rest, so titanium dioxide prices follow Chinese output. Acrylic and styrene-acrylic emulsions are made near most large markets from monomers produced in China, the U.S., Western Europe and Southeast Asia, and waterborne acrylic resin makers often build next to paint clusters. Calcium carbonate is quarried and ground locally almost everywhere, while kaolin comes largely from the U.S. Southeast, Brazil and the UK, and talc from China, India and Finland.
Paint business profit margin and ROI
Paint is a brand and distribution business wrapped around a simple process. Ingredients are cheap per liter compared with the shelf price, so gross margin looks high, but much of it goes to dealer discounts, tinting machines placed in stores, painter loyalty schemes and advertising. The model uses an assumed net ex-factory realization of USD 1.40–1.90 per kilogram for a mid-market range of interior and exterior emulsions, bracketing Turkey's 2023 export unit value of about USD 1.6 and well below the EU average near USD 3.0. Inputs are priced at an assumed USD 2,600–3,200 per tonne for titanium dioxide and an assumed USD 1,100–1,400 per tonne for binder emulsion.
On that basis, gross margin after materials, packaging and plant conversion runs about 35–45%, with about 44% at the midpoint. Selling and distribution then take about 24% of sales and administration about 5%, leaving an operating margin near 15%.
New brands fill plants slowly, so the payback case uses 60% utilization. At the midpoint, the plant earns about USD 4.8 million a year in post-tax cash profit. On CapEx plus a working capital margin of about USD 2 million, payback falls at about 3.5–5.5 years. If gross margin slips to about 35% through discounting or a titanium dioxide spike, payback stretches past 8 years.
| Financial metric | Status |
|---|---|
| IRR | Available in report |
| NPV | Available in report |
| ROI | Available in report |
| DSCR | Available in report |
How to start a paint business, licenses and approvals
A paint plant needs business and tax registration, land use and building permits, an environmental permit covering dust from powder handling, wash water and sludge, fire and occupational safety approval, and chemical inventory compliance for every substance used. Finished paint needs a safety data sheet and hazard label, compliance with volatile organic compound limits for each product category, lead limits for decorative paint, and approved in-can preservatives. Export and import registration applies to traded paint. A water-based plant avoids most of the flammable liquid licensing that solvent paint plants face.
| Market | Key approvals for water-based decorative paint |
|---|---|
| United States | EPA National Volatile Organic Compound Emission Standards for Architectural Coatings, 40 CFR Part 59 Subpart D, for manufacturers and importers; stricter state and air district limits based on CARB's suggested control measure, such as South Coast AQMD Rule 1113; CPSC ban on lead-containing paint above 90 ppm, 16 CFR Part 1303; TSCA inventory compliance; OSHA Hazard Communication Standard labels and safety data sheets |
| European Union | VOC limits by product category under Directive 2004/42/EC, for example 30 grams per liter for water-based interior matt wall paint, with VOC content on the label; REACH registration and downstream user duties; CLP classification and labeling; Biocidal Products Regulation (EU) No 528/2012 for in-can preservatives; optional EU Ecolabel |
| India | Regulation of Lead Contents in Household and Decorative paints Rules, 2016, with a 90 ppm limit, a lead content label and annual testing, with CPCB as nodal agency; state pollution control board consent to establish and operate; authorization under the Hazardous and Other Wastes Rules, 2016; factory license; IS 15489 for plastic emulsion paint as the usual BIS quality reference |
Key paint manufacturers and recent developments
The global tier includes Sherwin-Williams, PPG, AkzoNobel, Nippon paint, Asian paints, Jotun, Kansai paint and Benjamin Moore, with Berger paints, Birla Opus and Indigo paints in India, SKSHU paint and Carpoly in China, Comex in Mexico, Brillux and Tikkurila in Europe, and Crown paints in Kenya. Hundreds of regional makers compete on price in economy emulsions, while leaders win on brand, tinting networks and painter relationships.
- April 2026. Jotun inaugurated an IDR 1 trillion water-based paint factory in Cikarang, West Java, projected to lift its capacity there to 100 million liters a year, West Java's investment office reported.
- September 2026. Sherwin-Williams opened its expanded architectural paint and coatings plant in Statesville, North Carolina, described as its largest in North America, part of a project first budgeted at no less than USD 300 million, PCI Magazine reported.
- October 2026. AkzoNobel agreed to sell its decorative paints business in Vietnam, Indonesia, Malaysia, Thailand, Singapore, Papua New Guinea and Australia to Nippon paint at an enterprise value of about USD 1.35 billion, two months after AkzoNobel and Axalta shareholders approved their merger.
What's inside the Paint project report PDF
The report runs to 21 chapters. Open a chapter to see its sections.
1. Preface
2. Scope and Methodology
- 2.1 Objectives of the Study
- 2.2 Stakeholders
- 2.3 Research Methodology
- 2.4 Data Sources and Key Assumptions
3. Executive Summary
- 3.1 Market Snapshot
- 3.2 Project at a Glance (Capacity, CapEx, OpEx)
- 3.3 Key Financial Indicators (IRR, NPV, Payback, Break-even)
- 3.4 Feasibility Verdict
4. Product Overview
- 4.1 Paint Definition and Properties
- 4.2 Grades and Specifications (BIS / ISO / ASTM)
- 4.3 HS Code and Classification
- 4.4 Key Applications
- 4.5 Substitutes
5. Global Paint Market
- 5.1 Market Overview
- 5.2 Historical and Current Market Performance (Volume and Value)
- 5.3 Market Breakup by Grade / Type
- 5.4 Market Breakup by End-Use Industry
- 5.5 Market Breakup by Region
- 5.6 Market Drivers, Restraints and Trends
- 5.7 Value Chain Analysis
- 5.8 Market Forecast
6. Target Country Paint Market Analysis
- 6.1 Demand and Supply Analysis
- 6.2 Installed Capacity vs Demand Gap
- 6.3 Import Dependence
- 6.4 Demand Forecast by End-Use
7. Trade Analysis
- 7.1 Imports by Volume, Value and Country
- 7.2 Exports by Volume, Value and Country
- 7.3 Trade Balance and Opportunities
8. Price Analysis
- 8.1 Historical Paint Price Trends by Region
- 8.2 Raw Material / Feedstock Price Trends and Linkage
- 8.3 Price Forecast
- 8.4 Margins Across the Value Chain
9. Competitive Landscape
- 9.1 Market Structure
- 9.2 Key Players and Installed Capacities
- 9.3 Profiles of Key Players
- 9.4 Recent Developments (Expansions, M&A, New Plants)
10. Manufacturing Process and Technology
- 10.1 Comparison of Technology Routes
- 10.2 Selected Route and Process Flow Diagram
- 10.3 Unit Operations Involved
- 10.4 Chemical Reactions Involved
- 10.5 Mass Balance and Raw Material Requirements
- 10.6 Energy Balance
- 10.7 Quality Assurance Criteria and Technical Tests
- 10.8 By-products and Waste Handling
- 10.9 Technology Licensors / Providers
11. Project Details, Requirements and Costs
- 11.1 Land, Location and Site Development
- 11.1.1 Site Selection Criteria
- 11.1.2 Location Analysis
- 11.1.3 Land Requirement and Costs
- 11.1.4 Site Development Costs
- 11.2 Plant Layout
- 11.2.1 Layout Principles
- 11.2.2 Proposed Layout
- 11.2.3 Factors Influencing Layout
- 11.3 Civil Works and Buildings
- 11.4 Plant Machinery
- 11.4.1 Machinery Requirements and Specifications
- 11.4.2 Machinery Costs
- 11.4.3 Machinery Suppliers
- 11.5 Raw Materials
- 11.5.1 Requirements per Tonne of Output
- 11.5.2 Procurement and Sourcing
- 11.5.3 Costs
- 11.5.4 Suppliers
- 11.6 Packaging
- 11.6.1 Packaging Requirements
- 11.6.2 Packaging Costs
- 11.6.3 Packaging Suppliers
- 11.7 Storage and Material Handling
- 11.8 Transportation Requirements and Costs
- 11.9 Utilities
- 11.9.1 Power Requirements and Costs
- 11.9.2 Water Requirements and Costs
- 11.9.3 Steam, Fuel and Other Utilities
- 11.10 Manpower Requirements and Wages
12. Environment, Health, Safety and Sustainability
- 12.1 Effluent and Emissions Management
- 12.2 Hazard Classification and Safety Measures
- 12.3 Carbon Footprint
- 12.4 Green / Low-Carbon Process Options
13. Regulatory Procedures, Approvals and Certifications
- 13.1 Licences and Registrations
- 13.2 Environmental Clearances
- 13.3 Product Certifications (BIS, REACH, etc.)
- 13.4 Approval Timeline
14. Project Implementation Schedule
15. Project Economics
- 15.1 Capital Cost of the Project
- 15.2 Techno-Economic Parameters
- 15.3 Capacity Utilization and Ramp-up
- 15.4 Product Pricing and Margins
- 15.5 Income Projections
- 15.6 Expenditure Projections
- 15.7 Working Capital Requirement
- 15.8 Taxation
- 15.9 Depreciation
16. Financial Analysis
- 16.1 Projected Profit and Loss Account
- 16.2 Projected Cash Flow Statement
- 16.3 Projected Balance Sheet
- 16.4 Liquidity Analysis
- 16.5 Profitability Analysis (Payback, NPV, IRR, ROI)
- 16.6 Break-even Analysis
- 16.7 Debt Service Coverage Ratio (DSCR)
- 16.8 Sensitivity Analysis
- 16.9 Scenario and Uncertainty Analysis
17. Funding and Incentives
- 17.1 Means of Finance and Debt-Equity Structure
- 17.2 Loans and Financial Assistance
- 17.3 Government Schemes and Subsidies (PLI, State Policies)
18. Risk Assessment
- 18.1 Key Success Factors
- 18.2 Key Risk Factors
- 18.3 Risk Mitigation
19. Strategic Recommendations
20. Case Study of a Successful Venture
21. Appendix
- 21.1 Detailed Assumptions
- 21.2 Abbreviations
- 21.3 List of Tables and Figures
- 21.4 Sources
This page vs. the full report
| Data point | On this page (free) | In the full report |
|---|---|---|
| Total CapEx | One rounded range at one capacity | Exact figure at three capacities with a line-item breakup |
| CapEx breakup | Category shares (%) only | Cost, quantity and supplier for every machine |
| Operating cost | Share of raw materials, utilities and labor | Per-unit cost sheet with each input price and consumption |
| Profitability | Gross margin range and payback band | Exact IRR, NPV, ROI, break-even and DSCR |
| Financial statements | List of what is included | 10-year P&L, cash flow, balance sheet and Excel model |
| Sensitivity | One directional line | Full sensitivity and scenario tables |
| Process | Simplified flow diagram | Detailed process flow, mass and energy balance, operating conditions |
| Machinery | Names of the main machines | Specifications, capacity, cost and supplier list |
| Market | Headline size, growth and global demand | Segment, region, trade and price forecast tables |
| Suppliers and buyers | Supplier types and sourcing hubs | Named suppliers and buyers |
Paint project report: FAQs
How much does it cost to set up a paint manufacturing plant?
What raw materials are used to make water-based paint?
Is paint manufacturing profitable?
What is the HS code for water-based paint?
What licenses are needed to start a paint business?
Why does titanium dioxide matter so much in paint costs?

About the analyst
Nisha Gupta, Senior Research Analyst
Nisha Gupta is a Senior Research Analyst at Credence Research Inc. who works across industry domains, including packaging, automotive parts and machinery. Her focus is the modelling engine behind each study: she builds quantitative market databases and econometric forecasting frameworks, and developed automated Excel-based market modelling templates that cut client turnaround time by 30%.
Related market research
- Decorative Paints and Coatings Market Size, Growth, Share and Forecast 2032
- Paints and Coatings Market Size, Growth, Share and Forecast 2032
- Waterborne Coatings Market Size, Trends, Share & Forecast 2032
- Titanium Dioxide Market Size, Share and Growth Report 2032
- Waterborne Acrylic Resin Market Size, Growth and Forecast 2032
- Waterborne Coating Additives Market Size, Growth and Forecast 2032
More plant project reports
- Carbon Monoxide Manufacturing Plant Project Report (DPR) 2026
- Hydrochloric Acid Manufacturing Plant Project Report (DPR) 2026
- Recycled Plastic Manufacturing Plant Project Report (DPR) 2026
- Grease Manufacturing Plant Project Report (DPR) 2026
- Glycerin Manufacturing Plant Project Report (DPR) 2026
- Naphthalene Balls Manufacturing Plant Project Report (DPR) 2026