
Quick answer
A paper bag manufacturing plant converts kraft paper reels into printed square-bottom, handle and food bags. A mid-size unit making about 200 million bags a year, roughly 9,000 metric tons, needs an estimated USD 6–10 million of CapEx. Kraft paper and other materials take about 75–80% of operating cost, leaving a gross margin of 23–32% at an assumed mid-market price. Payback is about 3–6 years at 85% utilization.
Viable for a converter with secure kraft supply and contracted retail or food buyers, provided printed handle bags make up most of the mix and paper costs can be passed through.
Paper Bag plant: key highlights
| Parameter | Indicative value | Note |
|---|---|---|
| Plant capacity | About 200 million bags per year | About 9,000 metric tons of printed square-bottom bags from six machines |
| Total CapEx | USD 6–10 million | Greenfield, Asian machinery basis; European lines or U.S. and EU sites at or above the top |
| Raw material share of operating cost | 75–80% | Kraft paper is about 71%; handles, glue, ink and packing add the rest |
| Gross margin | 23–32% | Selling price minus materials and direct conversion, at an assumed mid-market price |
| Payback period | 3–6 years | At 85% utilization and mid-range CapEx of about USD 8 million |
| IRR | Available in report | Post-tax, 10-year model |
| Break-even | Available in report | Capacity utilization basis |
Ranges assume about 200 million printed square-bottom bags (about 9,000 metric tons) a year from six machines, a greenfield Asian industrial park (U.S. and EU costs higher), 2026 prices, 85% utilization, listed Asian machine prices, assumed press, building and land costs, bag kraft at USD 850–980 per metric ton and an assumed average price of USD 1.60 per kilogram of bags. Customizable to any country.
What is a paper bag?
A paper bag is a flexible container made by folding, gluing and closing a tube of kraft or recycled paper at one end. A bag plant is a converter: it buys paper in reels and turns it into finished bags, and it does not run a paper machine. Three product families dominate, and each needs its own machinery. Small flat and satchel bags serve bakeries, pharmacies and takeaway food. Self-opening square (SOS) and block-bottom bags, with or without twisted or flat paper handles, carry groceries, retail goods and restaurant deliveries. Multiwall sacks of two to four plies hold 10–50 kg of cement, flour, feed or chemicals.
Customs schedules split these groups by size. HS subheading 4819.30 covers sacks and bags with a base width of 40 cm or more, which captures most industrial sacks, while 4819.40 covers other sacks and bags, including cones, where most retail carrier and food bags fall. A plant making both should follow trade under both codes. Grocers, fashion and specialty retailers, quick-service restaurants, delivery platforms, bakeries and building-material producers are the main buyers.
Paper bag market overview and global demand
Credence Research values the global paper bags market at USD 5.85 billion in 2024 and forecasts USD 8.25 billion by 2032, a 4.4% CAGR. Carried forward at that rate, the market is about USD 6.1 billion in 2025, a figure derived from the 2024 value rather than separately published. Value figures understate the physical scale of the trade, because most bags sell for a few cents each.
Demand runs on two different engines. Retail and food bags grow with rules against plastic carriers. California's SB 1053 limited grocery and similar stores to recycled paper checkout bags from January 2026, at a minimum charge of 10 cents, and CalRecycle says those bags must contain at least 50% postconsumer fiber from January 2028. India has barred plastic carry bags thinner than 120 microns since December 2022, and many African and Asian states have similar bans. Industrial sacks follow construction and farming instead. EUROSAC statistics show European producers delivered about 5.2 billion paper sacks in 2023, with building materials other than cement taking about 36% and cement about 22%. Trade journal EUWID reported deliveries of about 5.69 billion units in 2025, up 2.7% on 2024.
North America and Western Europe are the largest markets by value, while South and Southeast Asia, the Middle East and Africa add the most new volume. Bags are bulky for their value, so converters mostly serve customers within a few hundred kilometers, and imports mainly cover plain stock bags. Paper supply, covered in the sack kraft paper market report, sets the cost floor for every converter.
Paper bag manufacturing process from kraft reel to finished bag
Paper bag making is a dry, mechanical conversion. The inputs are paper, starch or PVA glue, water-based ink and handle material, and the main waste is clean trim that goes back to paper mills as recovered fiber. The steps below describe a plant that prints its own reels, which lets a converter sell branded bags rather than only plain stock.
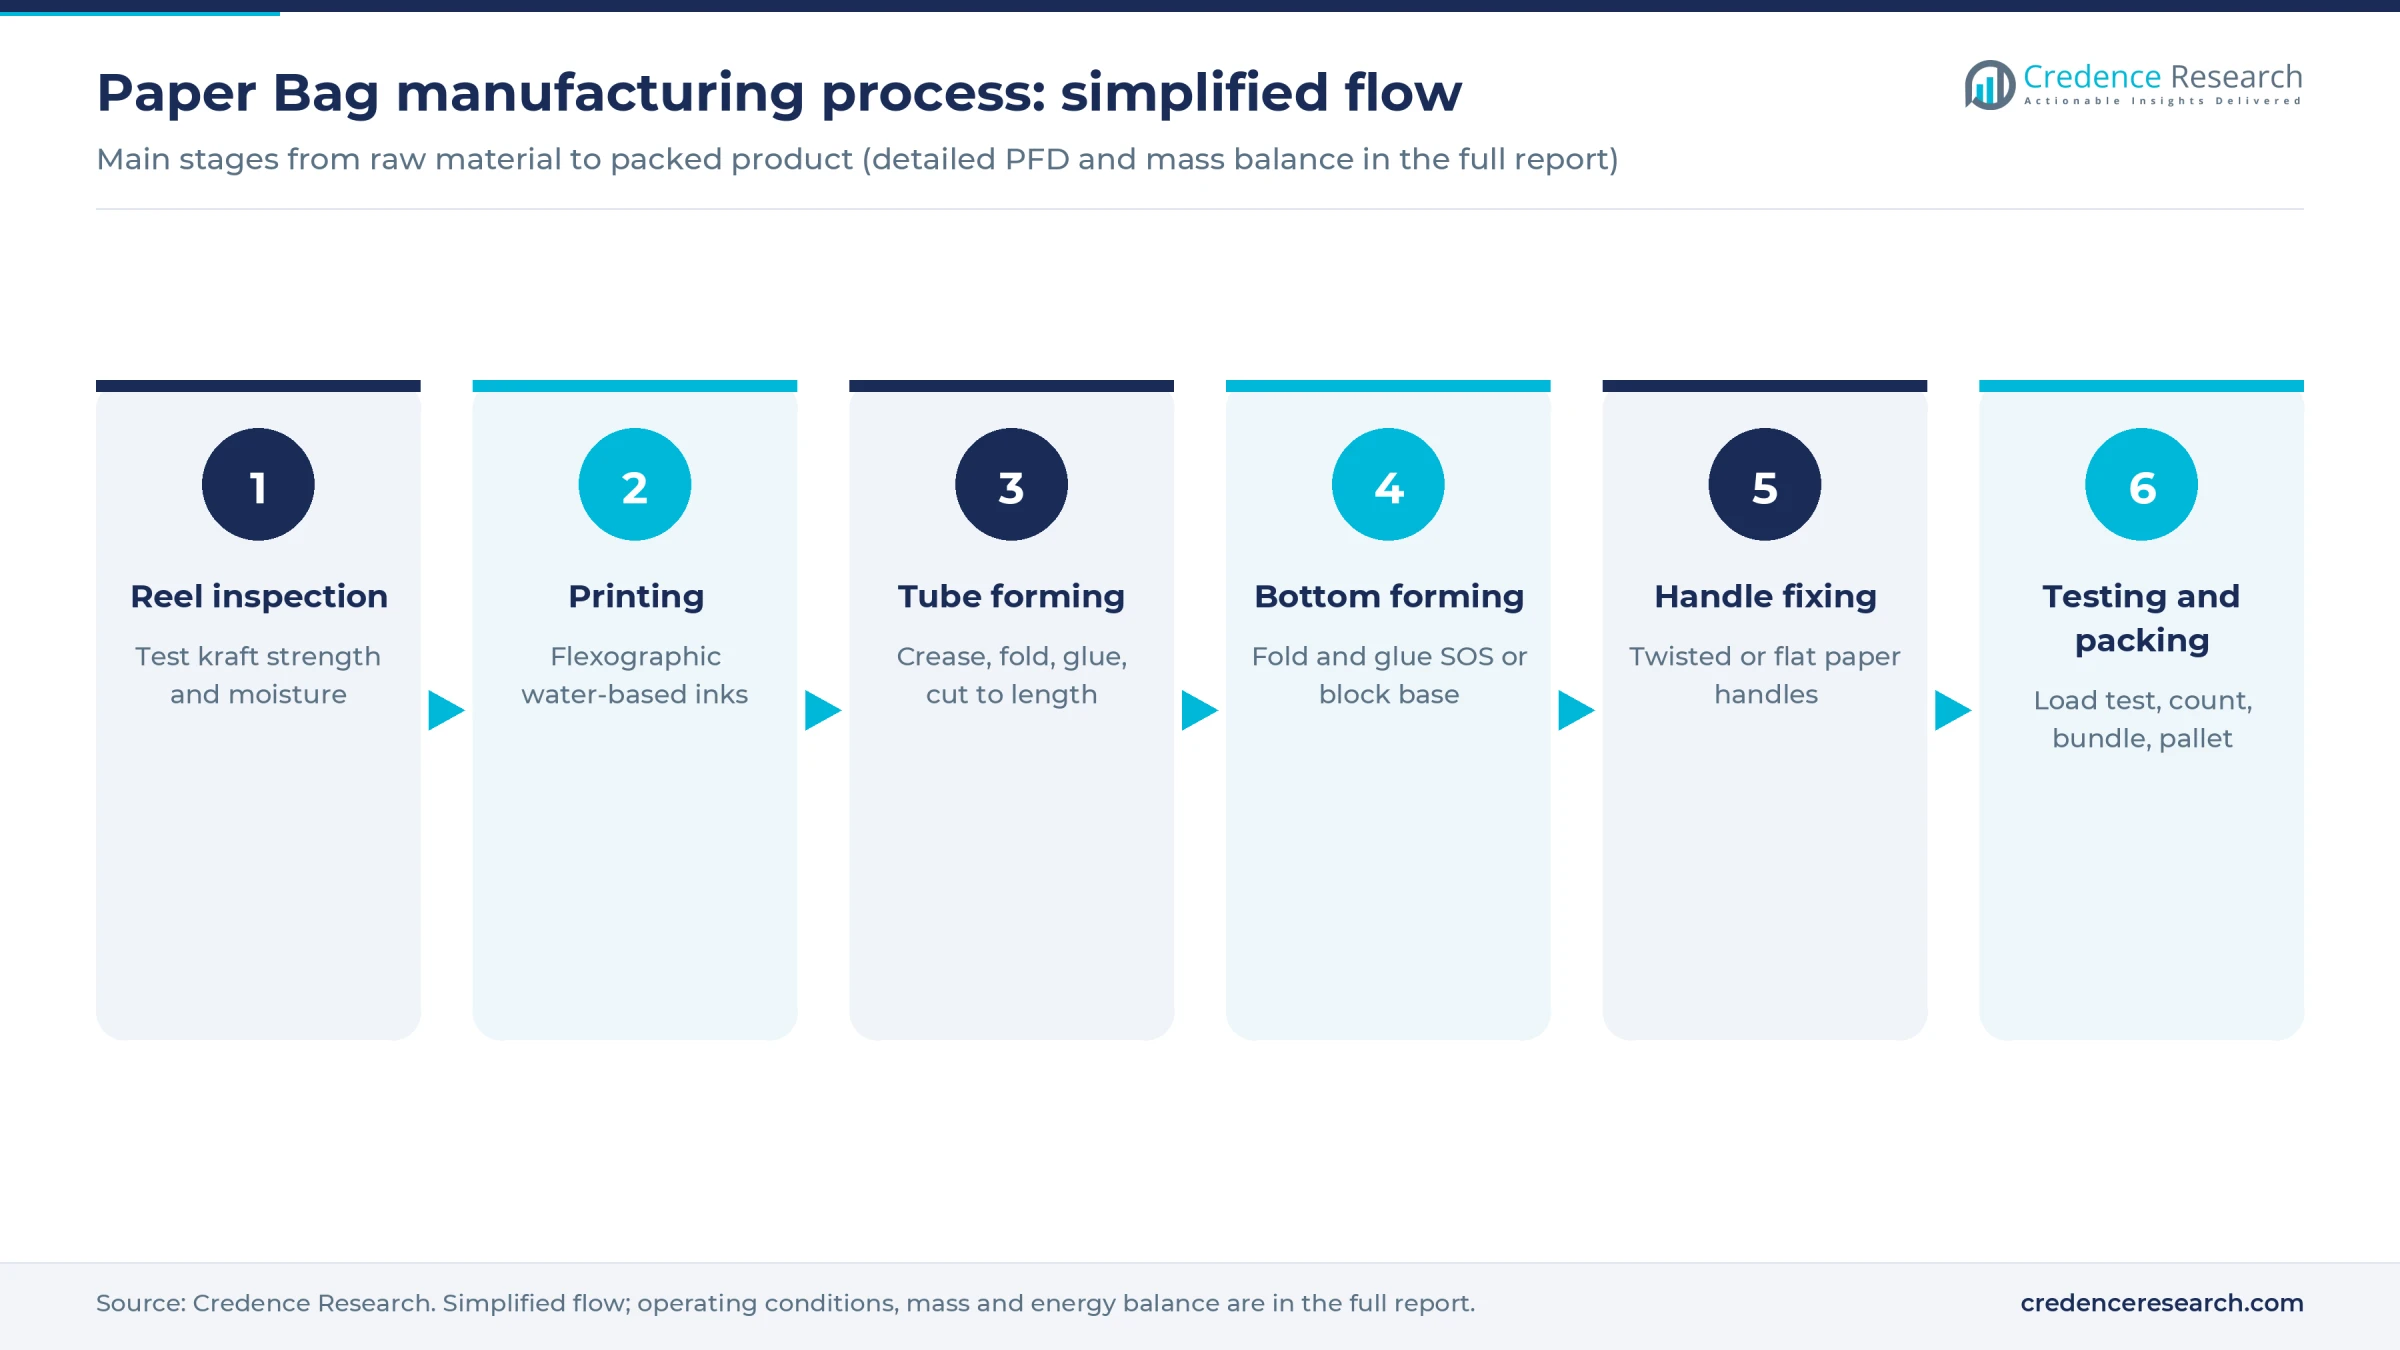
- Reel inspection and conditioning. Incoming kraft is checked for basis weight, tensile and tear strength, moisture and recycled content. Paper that is too dry cracks along the folds, so reels are often conditioned before use.
- Flexographic printing. Reel-to-reel presses apply one to six colors of water-based ink. Low-migration inks are specified where the bag will touch unwrapped food.
- Tube forming. On the bag machine the web is creased, folded into a gusseted tube and glued along a lengthwise seam, then cut to length by a serrated or rotary knife.
- Bottom forming. The open end is folded and glued into a flat, SOS or block bottom. Bottom glue placement decides whether a grocery bag survives a heavy load, so lines carry glue-detection sensors.
- Handle making and fixing. Twisted paper cord or flat paper strip is formed into handles, glued to reinforcing patches and fixed inside the top of the bag, either inline or on a separate handle machine.
- Testing and packing. Samples are load and drop tested, then bags are counted, bundled, banded and palletized.
Multiwall sacks take a different route. A tuber pulls several plies together into a stepped tube, and a bottomer forms pasted valve or open-mouth ends, so a sack line cannot simply be switched to retail bags. On handle lines, glue setting time, handle-unit speed and print changeovers usually set effective output, which is why these machines run well below their brochure speeds.
Paper bag plant setup cost
The reference plant is a greenfield converting unit making about 200 million printed square-bottom bags a year, most with twisted or flat paper handles. That output assumes six bag machines with inline handle units averaging about 90 bags a minute over roughly 6,600 hours a year, and an average bag weight near 45 grams, or about 9,000 metric tons of finished bags. At this scale, total CapEx is estimated at USD 6–10 million, including land, buildings, utilities, preoperative costs and a working capital margin.
The estimate is built bottom-up from equipment prices. Fully automatic square-bottom machines with inline twisted handles are listed by Chinese makers at about USD 120,000 each, while presses, reel handling, balers and packing equipment are assumed costs. A disclosed U.S. plant offers a cross-check: Ronpak's Shreveport, Louisiana, bag and food-wrap facility cost USD 16.8 million in 2013 and was producing about 20,000 tons a year, or roughly USD 840 per annual ton, which implies about USD 7.6 million at this plant's 9,000-ton scale. European machinery costs several times more per line; Mondi invested EUR 7 million in 2020 to add a single sack line at its Nyíregyháza, Hungary, plant. European lines or a U.S. or EU site move the total to or above the top of the range.
For the land row, the plant needs about 12,000 square meters for the building, reel store, finished goods and truck access. At an assumed USD 30–100 per square meter in an Asian industrial park, land costs about USD 360,000–1.2 million, near 10% of CapEx. U.S. and European land prices vary far more by location, so the full report prices the chosen site.
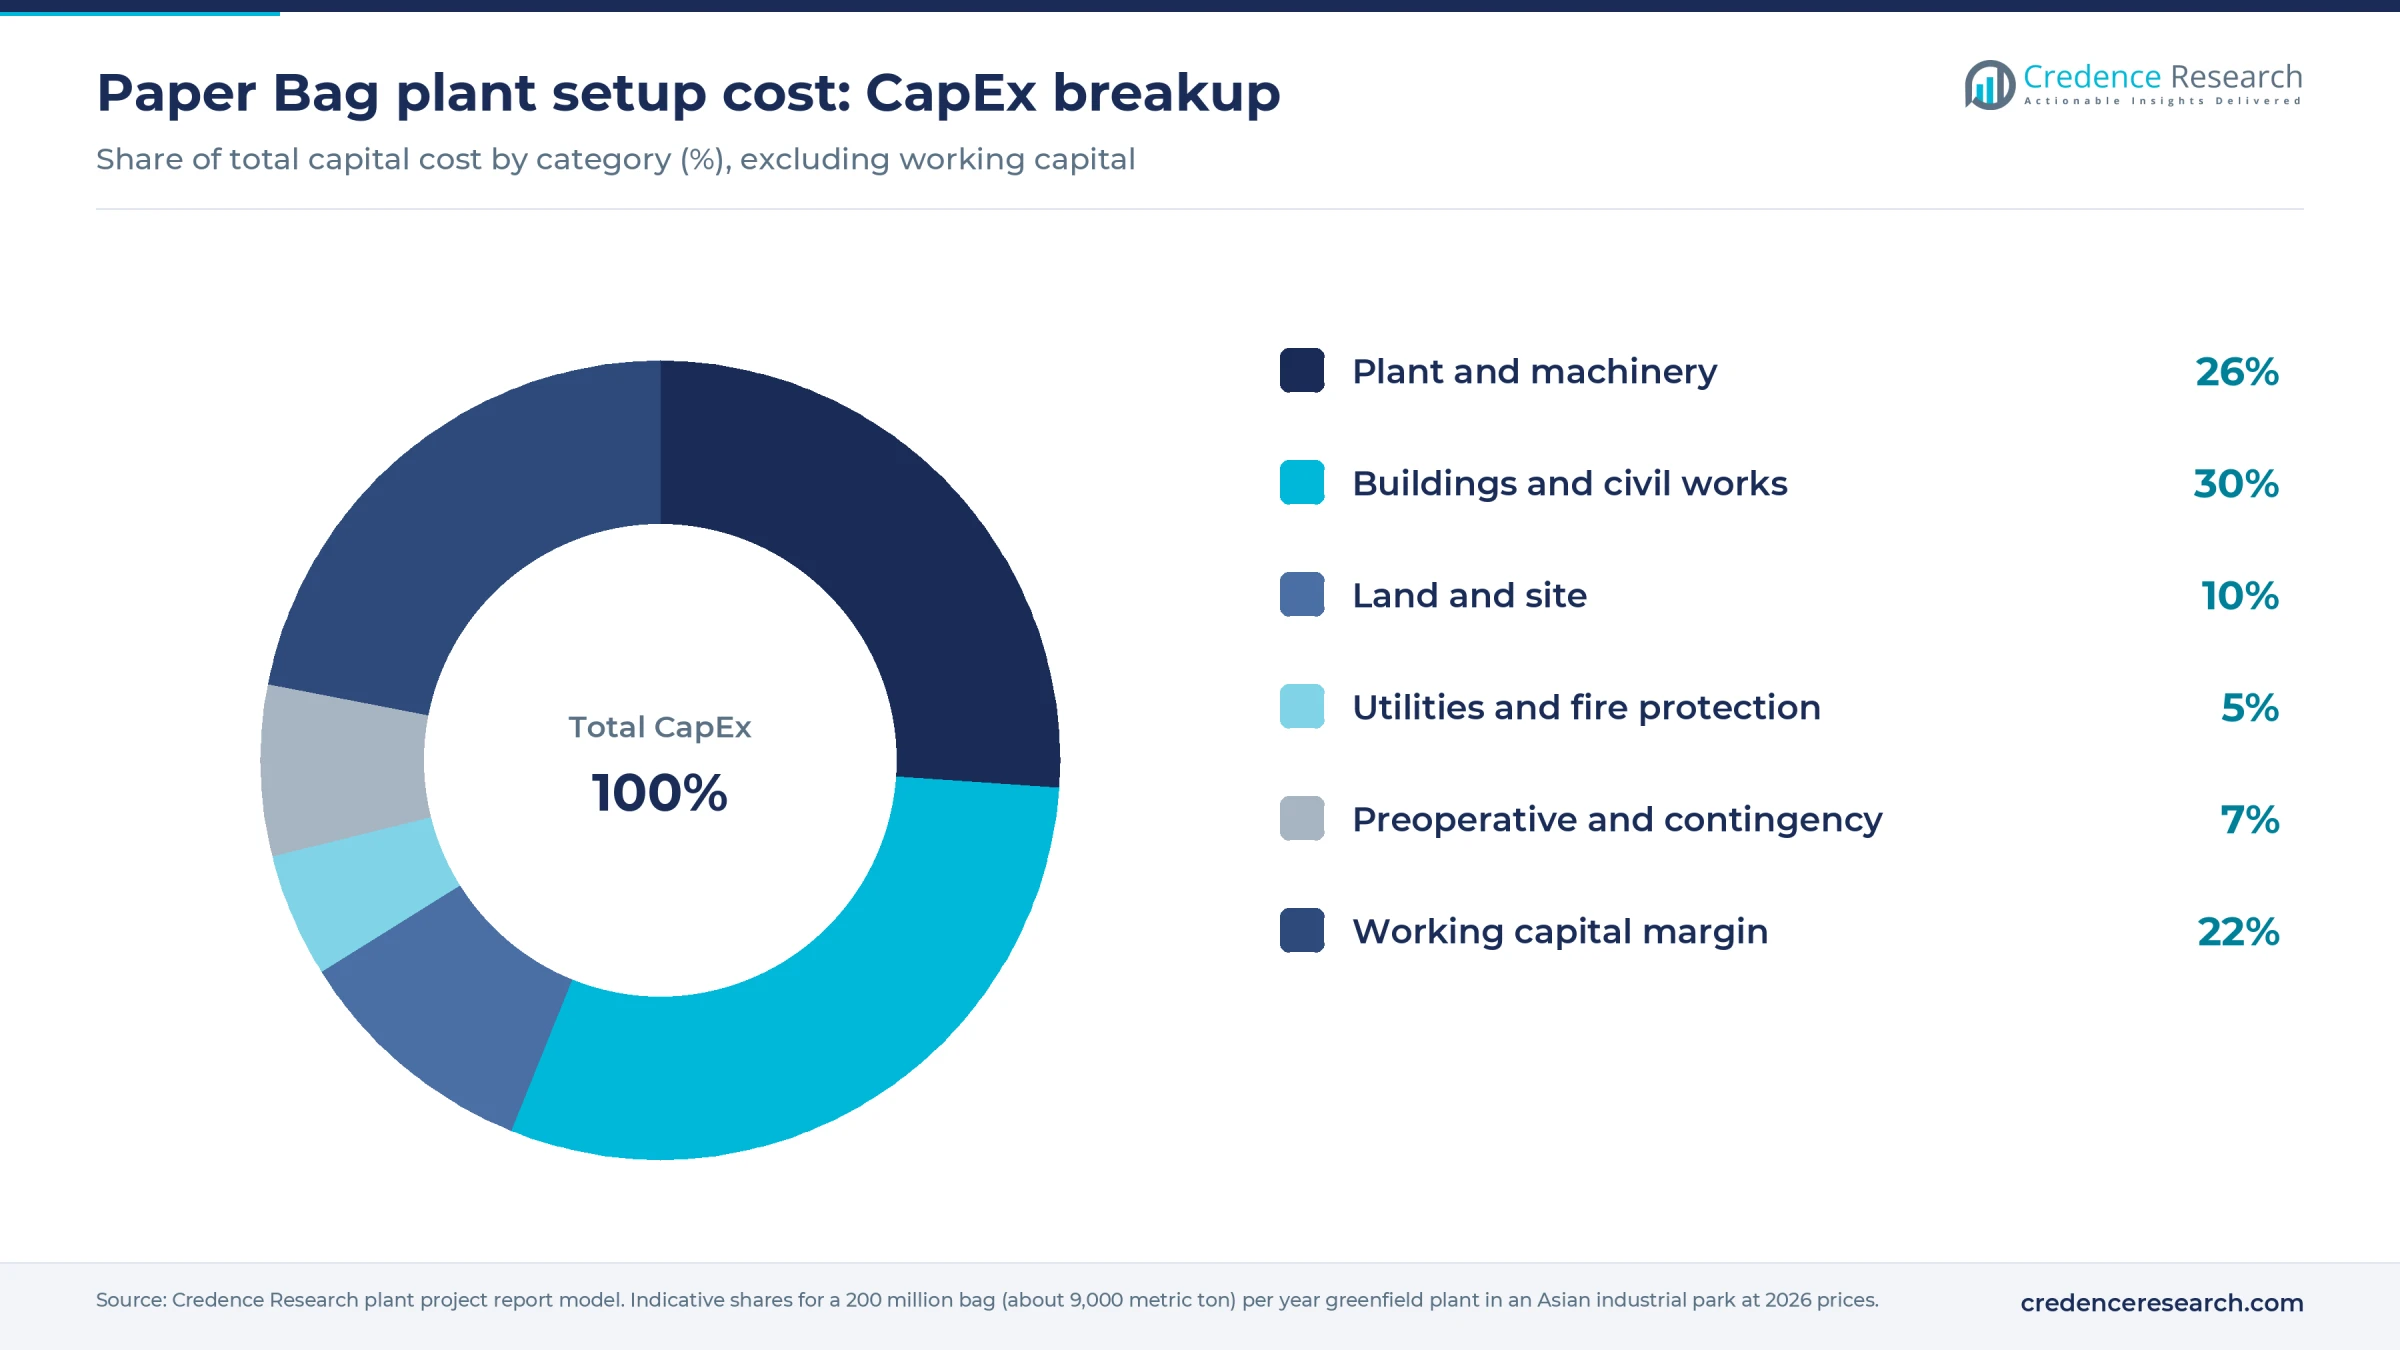
Buildings take about 30% of CapEx and plant and machinery about 26%, a ratio that reflects low-cost Asian machines and the floor space that bulky bags and reels demand. Working capital is about 22%, because paper is bought in truck or container lots.
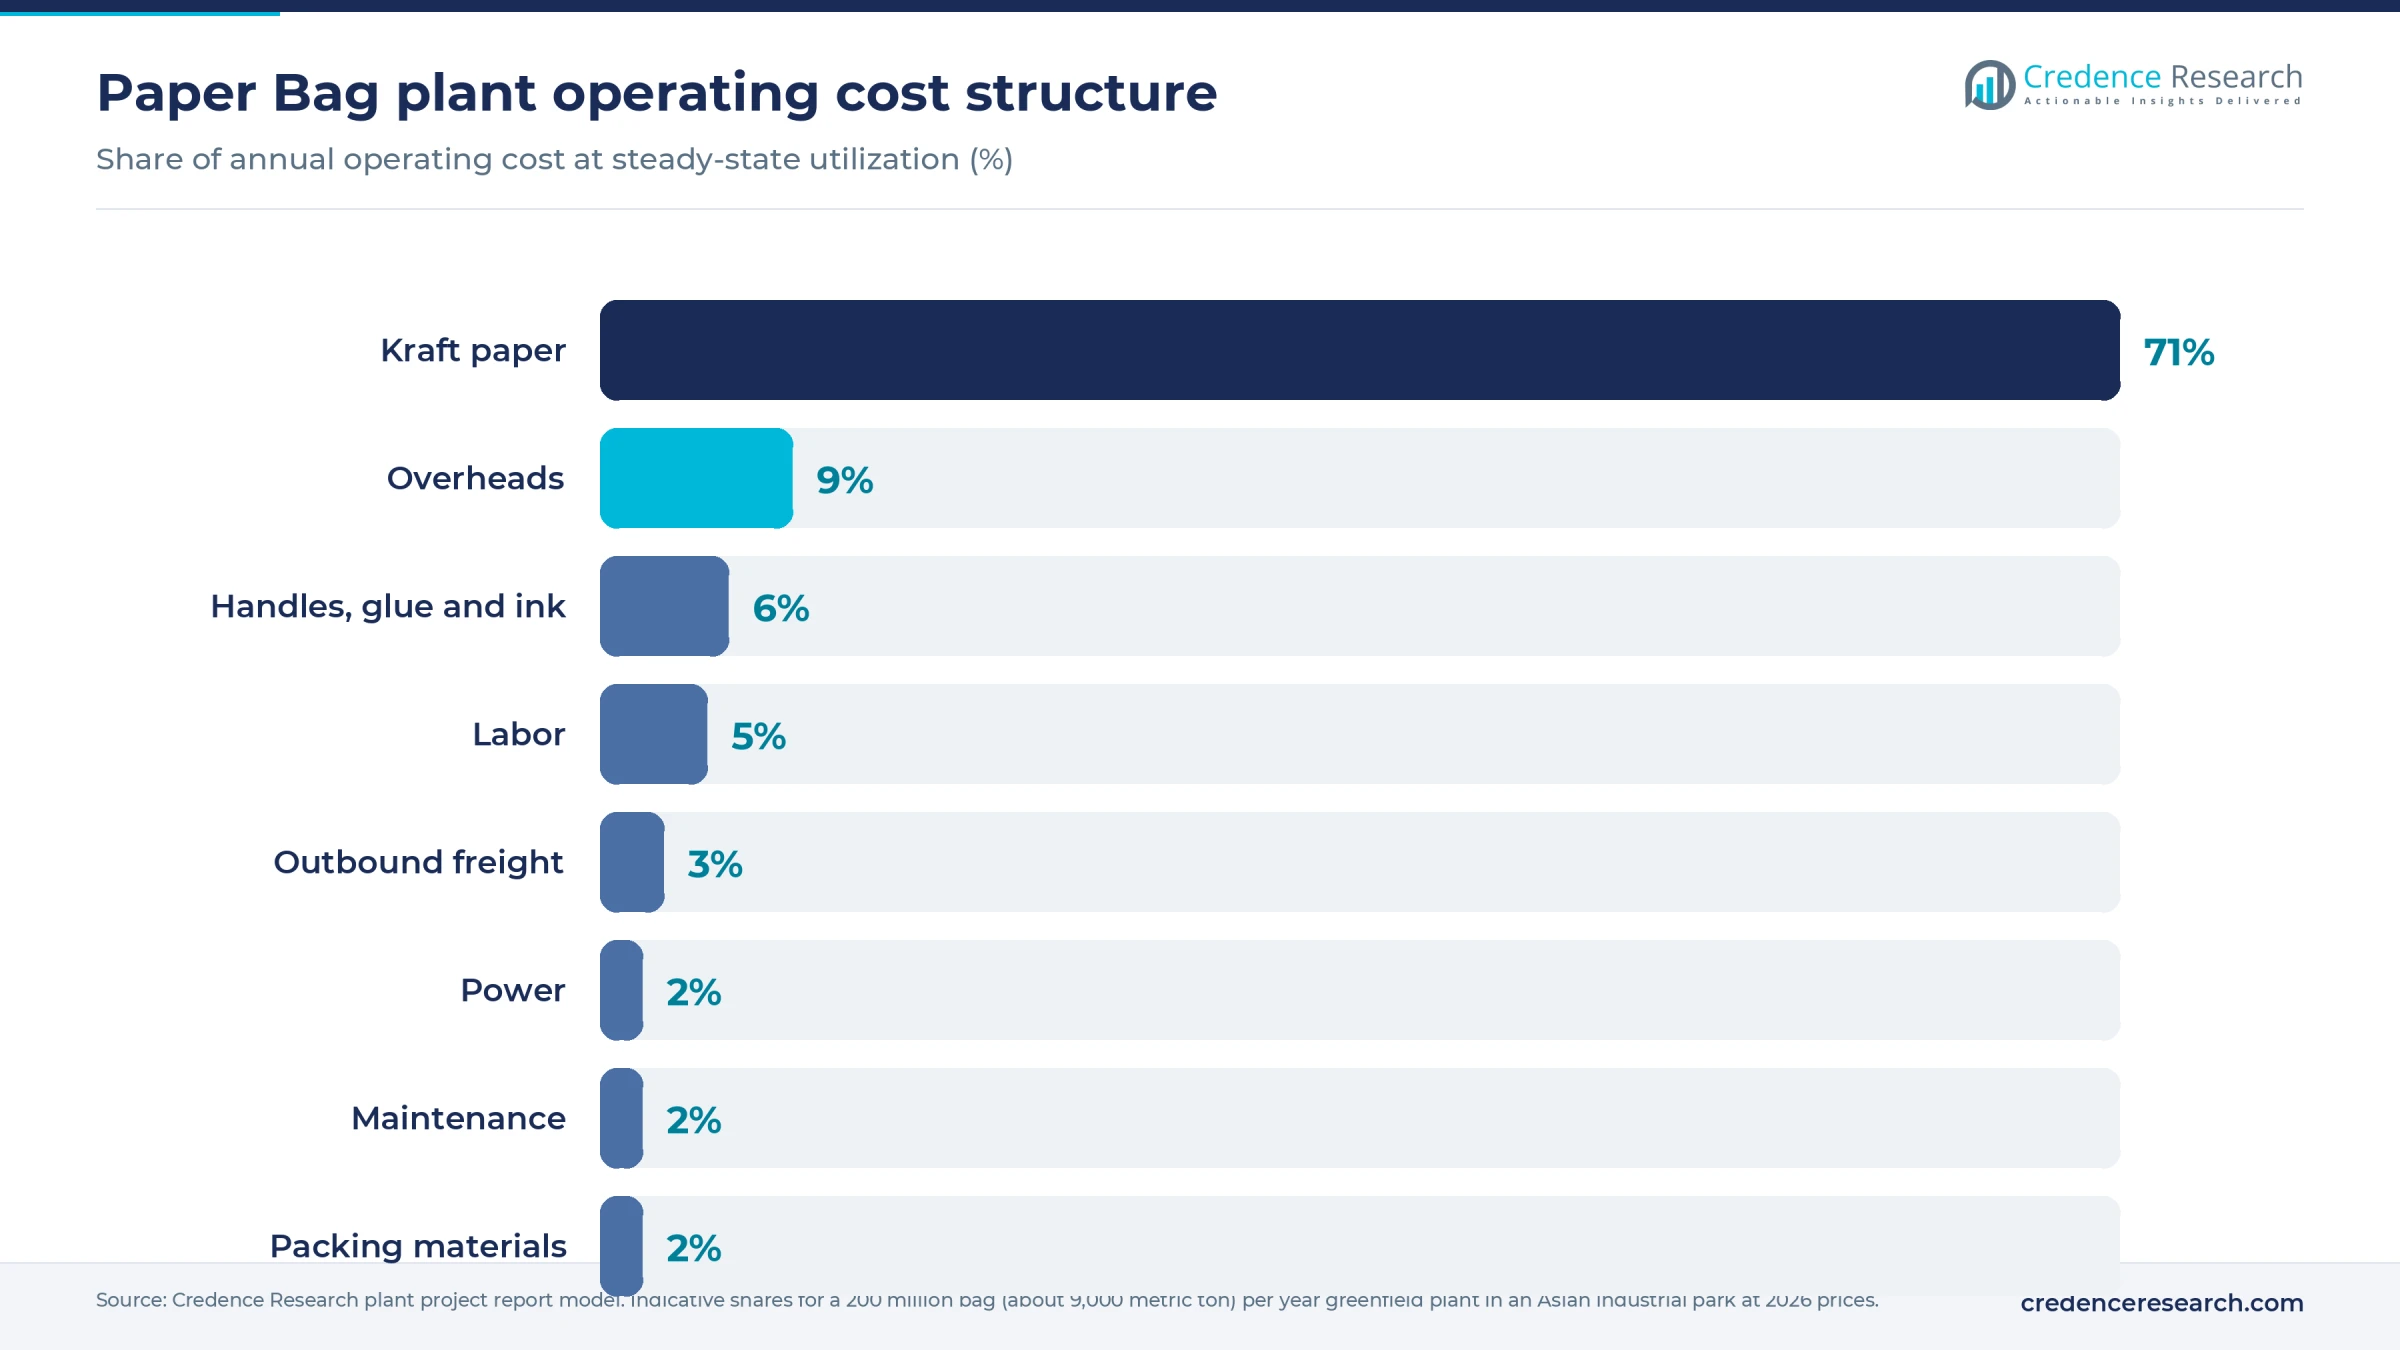
Kraft paper dominates operating cost at about 71%, so paper contracts matter more than labor or power. The full report rebuilds these shares for any country.
Machinery and raw materials for a paper bag plant
The main equipment groups are listed below; makes, speeds and the costed schedule are in the report.
- Reel stands, splicers and paper conditioning
- Stack or central-impression flexographic presses with plate making
- Square-bottom and SOS bag machines with tube forming and bottoming units
- Inline or off-line twisted and flat handle units, plus paper cord twisting machines
- Glue preparation for starch and PVA adhesives
- Counting, bundling, banding and palletizing equipment
- Compressors, trim extraction, balers, fire protection and a test lab for tensile, tear and load checks
Unbleached kraft for bags comes mainly from mills in Sweden and Finland, the southern U.S., Brazil, Austria and Central Europe, and increasingly from China and India, where recycled-fiber bag kraft is common. Starch adhesives are made from corn, potato or tapioca grown in the U.S., Europe and Thailand, and water-based inks come from global ink makers with regional plants.
The reference plant buys about 8,000 metric tons of paper a year at 85% utilization. Grocery buyers in regulated markets increasingly specify recycled content, while food and sack buyers want virgin fiber for strength, so a plant serving both needs two qualified paper streams and separate stock control.
Paper bag business profit margin and ROI
Gross margin for the reference plant is estimated at 23–32%, measured as selling price minus paper, handle materials, glue, ink and direct conversion cost. The build uses an assumed average price of about USD 1.60 per kilogram of finished bags for a mix of printed handle bags and plain SOS bags. That sits above a published Indian offer of USD 1.25 per kilogram for plain kraft bags, because printed retail bags carry a premium. Bag kraft is taken at USD 850–980 per metric ton, in line with a published FOB offer of USD 950 for European-mill kraft, and conversion costs are assumed.
At 85% utilization, about 7,650 metric tons sold, revenue is about USD 12.2 million. After assumed packing, freight and overheads, annual cash profit is about USD 1.4–2.5 million, which puts payback at about 3–6 years on mid-range CapEx of about USD 8 million.
Paper price is the swing factor. Each USD 100 per ton rise in kraft cost removes six to seven points of gross margin unless contracts pass it through, and large grocers often resist repricing for months. Printed handle bags for fashion and specialty retail earn the best margins, while plain grocery bags compete on price with imports.
| Metric | Value |
|---|---|
| Gross margin | 23–32% |
| Payback period | 3–6 years |
| IRR (post-tax) | Available in report |
| NPV | Available in report |
| Return on investment | Available in report |
| DSCR | Available in report |
| Break-even utilization | Available in report |
How to start a paper bag business with licenses and approvals
The approval path is similar in most jurisdictions: register the company and tax accounts, confirm land-use zoning, obtain building and fire permits, secure any environmental permit covering ink emissions, dust and waste paper, and follow factory and occupational safety rules for knives and handle units. Bags that touch food need documented food-contact compliance for paper, glue and ink, and many retailers also ask for FSC or PEFC chain-of-custody certification. Exporters also need import-export registration and customs codes. Bag rules now act as product rules as well as waste rules, so recycled content, labeling and grease-barrier chemistry should be checked for each target market before paper grades are fixed.
| Market | Product and food-contact rules | Plant permits |
|---|---|---|
| United States | FDA food-contact rules for paper, including 21 CFR 176.170 for aqueous and fatty foods and 21 CFR 176.180 for dry foods; state bag laws such as California SB 1053 set recycled content and printed labeling | State air permit where press emissions require it, local zoning, building and fire permits, OSHA workplace rules |
| European Union | Framework Regulation 1935/2004 and good manufacturing practice Regulation 2023/2006 for food bags; Packaging Regulation 2025/40, with PFAS limits for food packaging that apply from August 12, 2026 | National environmental and building permits, national workplace safety law |
| India | FSSAI Food Safety and Standards (Packaging) Regulations, 2018 for bags that touch food; Plastic Waste Management Rules, which bar plastic carry bags under 120 microns | State Pollution Control Board Consent to Establish and Consent to Operate, factory license under state factory rules, GST registration |
Key paper bag manufacturers and recent developments
Global and regional makers include Mondi (Austria and United Kingdom), Smurfit Westrock (Ireland and United States), Novolex and its Duro Bag unit (United States), ProAmpac, which bought International Paper's bag converting business in October 2025 (United States), Ronpak (United States), Huhtamaki (Finland), Gascogne (France), Segezha Group (Russia), Oji Fibre Solutions (New Zealand) and CPI Packaging (Saudi Arabia). Hundreds of small converters supply local shops across Asia and Africa, which keeps plain bag prices low.
Recent moves show capacity following both regulation and industrial demand, as tracked in the paper bag packaging market study:
- April 2026: Mondi opened a paper bag plant in Pittsburgh, Pennsylvania, expected to reach about 300 million bags a year after ramp-up, including e-commerce mailers.
- April 2026: Indocement and Mondi formed a cement bag joint venture at Citeureup, West Java; Mondi said it adds more than 200 million bags a year, with operations expected toward the end of 2026.
What's inside the Paper Bag project report PDF
The report runs to 21 chapters. Open a chapter to see its sections.
1. Preface
2. Scope and Methodology
- 2.1 Objectives of the Study
- 2.2 Stakeholders
- 2.3 Research Methodology
- 2.4 Data Sources and Key Assumptions
3. Executive Summary
- 3.1 Market Snapshot
- 3.2 Project at a Glance (Capacity, CapEx, OpEx)
- 3.3 Key Financial Indicators (IRR, NPV, Payback, Break-even)
- 3.4 Feasibility Verdict
4. Product Overview
- 4.1 Paper Bag Definition and Properties
- 4.2 Grades and Specifications (BIS / ISO / ASTM)
- 4.3 HS Code and Classification
- 4.4 Key Applications
- 4.5 Substitutes
5. Global Paper Bag Market
- 5.1 Market Overview
- 5.2 Historical and Current Market Performance (Volume and Value)
- 5.3 Market Breakup by Grade / Type
- 5.4 Market Breakup by End-Use Industry
- 5.5 Market Breakup by Region
- 5.6 Market Drivers, Restraints and Trends
- 5.7 Value Chain Analysis
- 5.8 Market Forecast
6. Target Country Paper Bag Market Analysis
- 6.1 Demand and Supply Analysis
- 6.2 Installed Capacity vs Demand Gap
- 6.3 Import Dependence
- 6.4 Demand Forecast by End-Use
7. Trade Analysis
- 7.1 Imports by Volume, Value and Country
- 7.2 Exports by Volume, Value and Country
- 7.3 Trade Balance and Opportunities
8. Price Analysis
- 8.1 Historical Paper Bag Price Trends by Region
- 8.2 Raw Material / Feedstock Price Trends and Linkage
- 8.3 Price Forecast
- 8.4 Margins Across the Value Chain
9. Competitive Landscape
- 9.1 Market Structure
- 9.2 Key Players and Installed Capacities
- 9.3 Profiles of Key Players
- 9.4 Recent Developments (Expansions, M&A, New Plants)
10. Manufacturing Process and Technology
- 10.1 Comparison of Technology Routes
- 10.2 Selected Route and Process Flow Diagram
- 10.3 Unit Operations Involved
- 10.4 Chemical Reactions Involved
- 10.5 Mass Balance and Raw Material Requirements
- 10.6 Energy Balance
- 10.7 Quality Assurance Criteria and Technical Tests
- 10.8 By-products and Waste Handling
- 10.9 Technology Licensors / Providers
11. Project Details, Requirements and Costs
- 11.1 Land, Location and Site Development
- 11.1.1 Site Selection Criteria
- 11.1.2 Location Analysis
- 11.1.3 Land Requirement and Costs
- 11.1.4 Site Development Costs
- 11.2 Plant Layout
- 11.2.1 Layout Principles
- 11.2.2 Proposed Layout
- 11.2.3 Factors Influencing Layout
- 11.3 Civil Works and Buildings
- 11.4 Plant Machinery
- 11.4.1 Machinery Requirements and Specifications
- 11.4.2 Machinery Costs
- 11.4.3 Machinery Suppliers
- 11.5 Raw Materials
- 11.5.1 Requirements per Tonne of Output
- 11.5.2 Procurement and Sourcing
- 11.5.3 Costs
- 11.5.4 Suppliers
- 11.6 Packaging
- 11.6.1 Packaging Requirements
- 11.6.2 Packaging Costs
- 11.6.3 Packaging Suppliers
- 11.7 Storage and Material Handling
- 11.8 Transportation Requirements and Costs
- 11.9 Utilities
- 11.9.1 Power Requirements and Costs
- 11.9.2 Water Requirements and Costs
- 11.9.3 Steam, Fuel and Other Utilities
- 11.10 Manpower Requirements and Wages
12. Environment, Health, Safety and Sustainability
- 12.1 Effluent and Emissions Management
- 12.2 Hazard Classification and Safety Measures
- 12.3 Carbon Footprint
- 12.4 Green / Low-Carbon Process Options
13. Regulatory Procedures, Approvals and Certifications
- 13.1 Licences and Registrations
- 13.2 Environmental Clearances
- 13.3 Product Certifications (BIS, REACH, etc.)
- 13.4 Approval Timeline
14. Project Implementation Schedule
15. Project Economics
- 15.1 Capital Cost of the Project
- 15.2 Techno-Economic Parameters
- 15.3 Capacity Utilization and Ramp-up
- 15.4 Product Pricing and Margins
- 15.5 Income Projections
- 15.6 Expenditure Projections
- 15.7 Working Capital Requirement
- 15.8 Taxation
- 15.9 Depreciation
16. Financial Analysis
- 16.1 Projected Profit and Loss Account
- 16.2 Projected Cash Flow Statement
- 16.3 Projected Balance Sheet
- 16.4 Liquidity Analysis
- 16.5 Profitability Analysis (Payback, NPV, IRR, ROI)
- 16.6 Break-even Analysis
- 16.7 Debt Service Coverage Ratio (DSCR)
- 16.8 Sensitivity Analysis
- 16.9 Scenario and Uncertainty Analysis
17. Funding and Incentives
- 17.1 Means of Finance and Debt-Equity Structure
- 17.2 Loans and Financial Assistance
- 17.3 Government Schemes and Subsidies (PLI, State Policies)
18. Risk Assessment
- 18.1 Key Success Factors
- 18.2 Key Risk Factors
- 18.3 Risk Mitigation
19. Strategic Recommendations
20. Case Study of a Successful Venture
21. Appendix
- 21.1 Detailed Assumptions
- 21.2 Abbreviations
- 21.3 List of Tables and Figures
- 21.4 Sources
This page vs. the full report
| Data point | On this page (free) | In the full report |
|---|---|---|
| Total CapEx | One rounded range at one capacity | Exact figure at three capacities with a line-item breakup |
| CapEx breakup | Category shares (%) only | Cost, quantity and supplier for every machine |
| Operating cost | Share of raw materials, utilities and labor | Per-unit cost sheet with each input price and consumption |
| Profitability | Gross margin range and payback band | Exact IRR, NPV, ROI, break-even and DSCR |
| Financial statements | List of what is included | 10-year P&L, cash flow, balance sheet and Excel model |
| Sensitivity | One directional line | Full sensitivity and scenario tables |
| Process | Simplified flow diagram | Detailed process flow, mass and energy balance, operating conditions |
| Machinery | Names of the main machines | Specifications, capacity, cost and supplier list |
| Market | Headline size, growth and global demand | Segment, region, trade and price forecast tables |
| Suppliers and buyers | Supplier types and sourcing hubs | Named suppliers and buyers |
Paper Bag project report: FAQs
How much does it cost to set up a paper bag manufacturing plant?
What is the profit margin in paper bag manufacturing?
How long is the payback period for a paper bag plant?
What is the HS code for paper bags?
What raw materials does a paper bag plant need?
Can a paper bag plant also make cement and flour sacks?
How do EU PFAS limits affect paper bag makers?

About the analyst
Satyabrat Rajawat, Senior Research Analyst – Strategic Advisory
Satyabrat Rajawat is a Senior Research Analyst in the Strategic Advisory practice at Credence Research Inc. He works across domains, with the deepest coverage in packaging, automotive parts and machinery, and sits at the point where a client question becomes a research plan: he works with sales and business development teams to scope RFP and RFI responses, set the project methodology, and then build the quantitative databases and econometric forecasts that answer it.
Related market research
- Paper Bags Market Size, Growth, Share and Forecast 2032
- Paper Bag Packaging Market Size, Share, Growth & Forecast 2032
- Sack Kraft Paper Market Size, Share, Growth and Forecast 2032
- Kraft Paper Market Size, Growth, Share and Forecast 2032
- Foodservice Paper Bags Market Size, Share and Forecast 2032
- North America Paper Bags Market Size, Share and Forecast 2032
More plant project reports
- Egg Tray Manufacturing Plant Project Report (DPR) 2026
- Corrugated Box Manufacturing Plant Project Report (DPR) 2026
- Aluminum Foil Manufacturing Plant Project Report (DPR) 2026
- PET Bottle Manufacturing Plant Project Report (DPR) 2026
- Recycled Plastic Manufacturing Plant Project Report (DPR) 2026
- Bendable Concrete Manufacturing Plant Project Report (DPR) 2026