
Quick answer
A phosphoric acid plant dissolves phosphate rock in sulfuric acid, filters out gypsum and concentrates the acid to about 54% P2O5, mainly for DAP, MAP and NPK fertilizers. A greenfield wet-process plant of 600 metric tons of P2O5 a day with its own sulfuric acid unit needs an estimated USD 180–420 million of CapEx. Rock and sulfur make up over 80% of operating cost, so gross margin of 22–42% tracks input prices. Payback is about 3–8 years.
Viable for producers with captive or contracted phosphate rock and secure sulfur near a fertilizer buyer, but a standalone merchant plant buying both minerals faces thin, volatile margins.
Phosphoric Acid plant: key highlights
| Parameter | Indicative value | Note |
|---|---|---|
| Plant capacity | 600 metric tons of P2O5 per day | About 198,000 tons of P2O5 a year, dihydrate wet process with a captive sulfuric acid plant |
| Total CapEx | USD 180–420 million | Greenfield; low end reflects an Asian site and contractor, top end a U.S. or EU site |
| Raw material share of operating cost | 80–85% | Phosphate rock and sulfur at assumed delivered prices |
| Gross margin | 22–42% | Central band; extreme input pairs 15–46% |
| Payback period | 3–8 years | Mid-range CapEx of USD 300 million; central case 4–5 years; weak price with costly sulfur can exceed 12 years |
| IRR | Available in report | Post-tax, 10-year model |
| Break-even | Available in report | Capacity utilization basis |
Ranges assume a 600-ton-a-day P2O5 wet-process greenfield plant with a captive sulfuric acid plant, Asian to U.S. or EU sites, 2026 prices, 90% utilization, an assumed ex-works price of USD 1,250–1,450 per ton of P2O5, and rock at an assumed USD 145–165 and sulfur at an assumed USD 300–360 per ton delivered. CapEx is scaled with a 0.6 exponent from disclosed projects at an assumed 83.5 rupees per dollar. Customizable to any country.
What is phosphoric acid?
Phosphoric acid (H3PO4) is a mineral acid made mostly from phosphate rock and traded on its phosphorus pentoxide (P2O5) content rather than its gross weight. Merchant-grade acid, the bulk of world output, is a dark green to brown liquid at 52–54% P2O5. Superphosphoric acid carries 68–72% P2O5 and feeds liquid fertilizers, while purified grades at 75–85% H3PO4 serve food, electronics and battery-material makers.
Of the two routes, the wet process dissolves rock in sulfuric acid and accounts for the large majority of tonnage, which ties the business to both phosphate mining and sulfur supply. The thermal route burns elemental phosphorus and yields a very pure acid, but its power demand has confined it largely to China. Wet acid can also be cleaned by solvent extraction to approach thermal purity.
Phosphoric acid and polyphosphoric acids fall under Harmonized System subheading 2809.20. Most output becomes diammonium and monoammonium phosphate, triple superphosphate and NPK fertilizers. Other uses include animal feed phosphates, sodium and potassium phosphates for detergents and food, cola acidulant, metal surface treatment, water treatment and lithium iron phosphate cathode materials.
Phosphoric acid market overview and global demand
Global supply starts with phosphate rock, and the U.S. Geological Survey estimates world phosphate rock output at about 250 million metric tons in 2025, up 5% from 2024. China mined about 110 million tons, followed by Morocco at 36 million, the United States at 20 million, Russia at 14 million, Jordan at 12 million and Saudi Arabia at 10 million. Morocco holds about 50 billion of the world's 73 billion tons of reserves. In the United States, more than 95% of mined rock goes into wet-process phosphoric acid.
The USGS puts world consumption of P2O5 in fertilizers at 47.8 million tons in 2025, rising to 51.5 million tons by 2029, while phosphate capacity is projected to grow from 63.7 million to 71.7 million tons of P2O5. UN Comtrade data for HS 280920 show world exports of about USD 6.4 billion and 9.1 million tons of product in 2024. Morocco shipped about 4.5 million tons worth USD 3.55 billion in 2025, near USD 790 per ton of product, with China, Senegal, Israel, the United States and Belgium next.
India is the pivotal buyer, importing about USD 2 billion of acid in 2024, more than a third of reported world imports, to make DAP and NPK grades. Its quarterly contracts act as the trade benchmark: the India price settled at USD 1,700 per ton of P2O5 for the third quarter of 2026, up from USD 1,360 in the second quarter and USD 1,290 in the first, largely on sulfur costs. Purified acid demand grows faster, led by battery cathodes in China and food phosphates.
Phosphoric acid manufacturing process
Most new capacity uses the wet process, with the dihydrate route as the workhorse and hemihydrate or hemi-dihydrate variants chosen where stronger filter acid and lower steam use justify the licensing cost. In the core reaction, fluorapatite reacts with sulfuric acid and water to give phosphoric acid, calcium sulfate dihydrate, known as gypsum, and hydrogen fluoride.
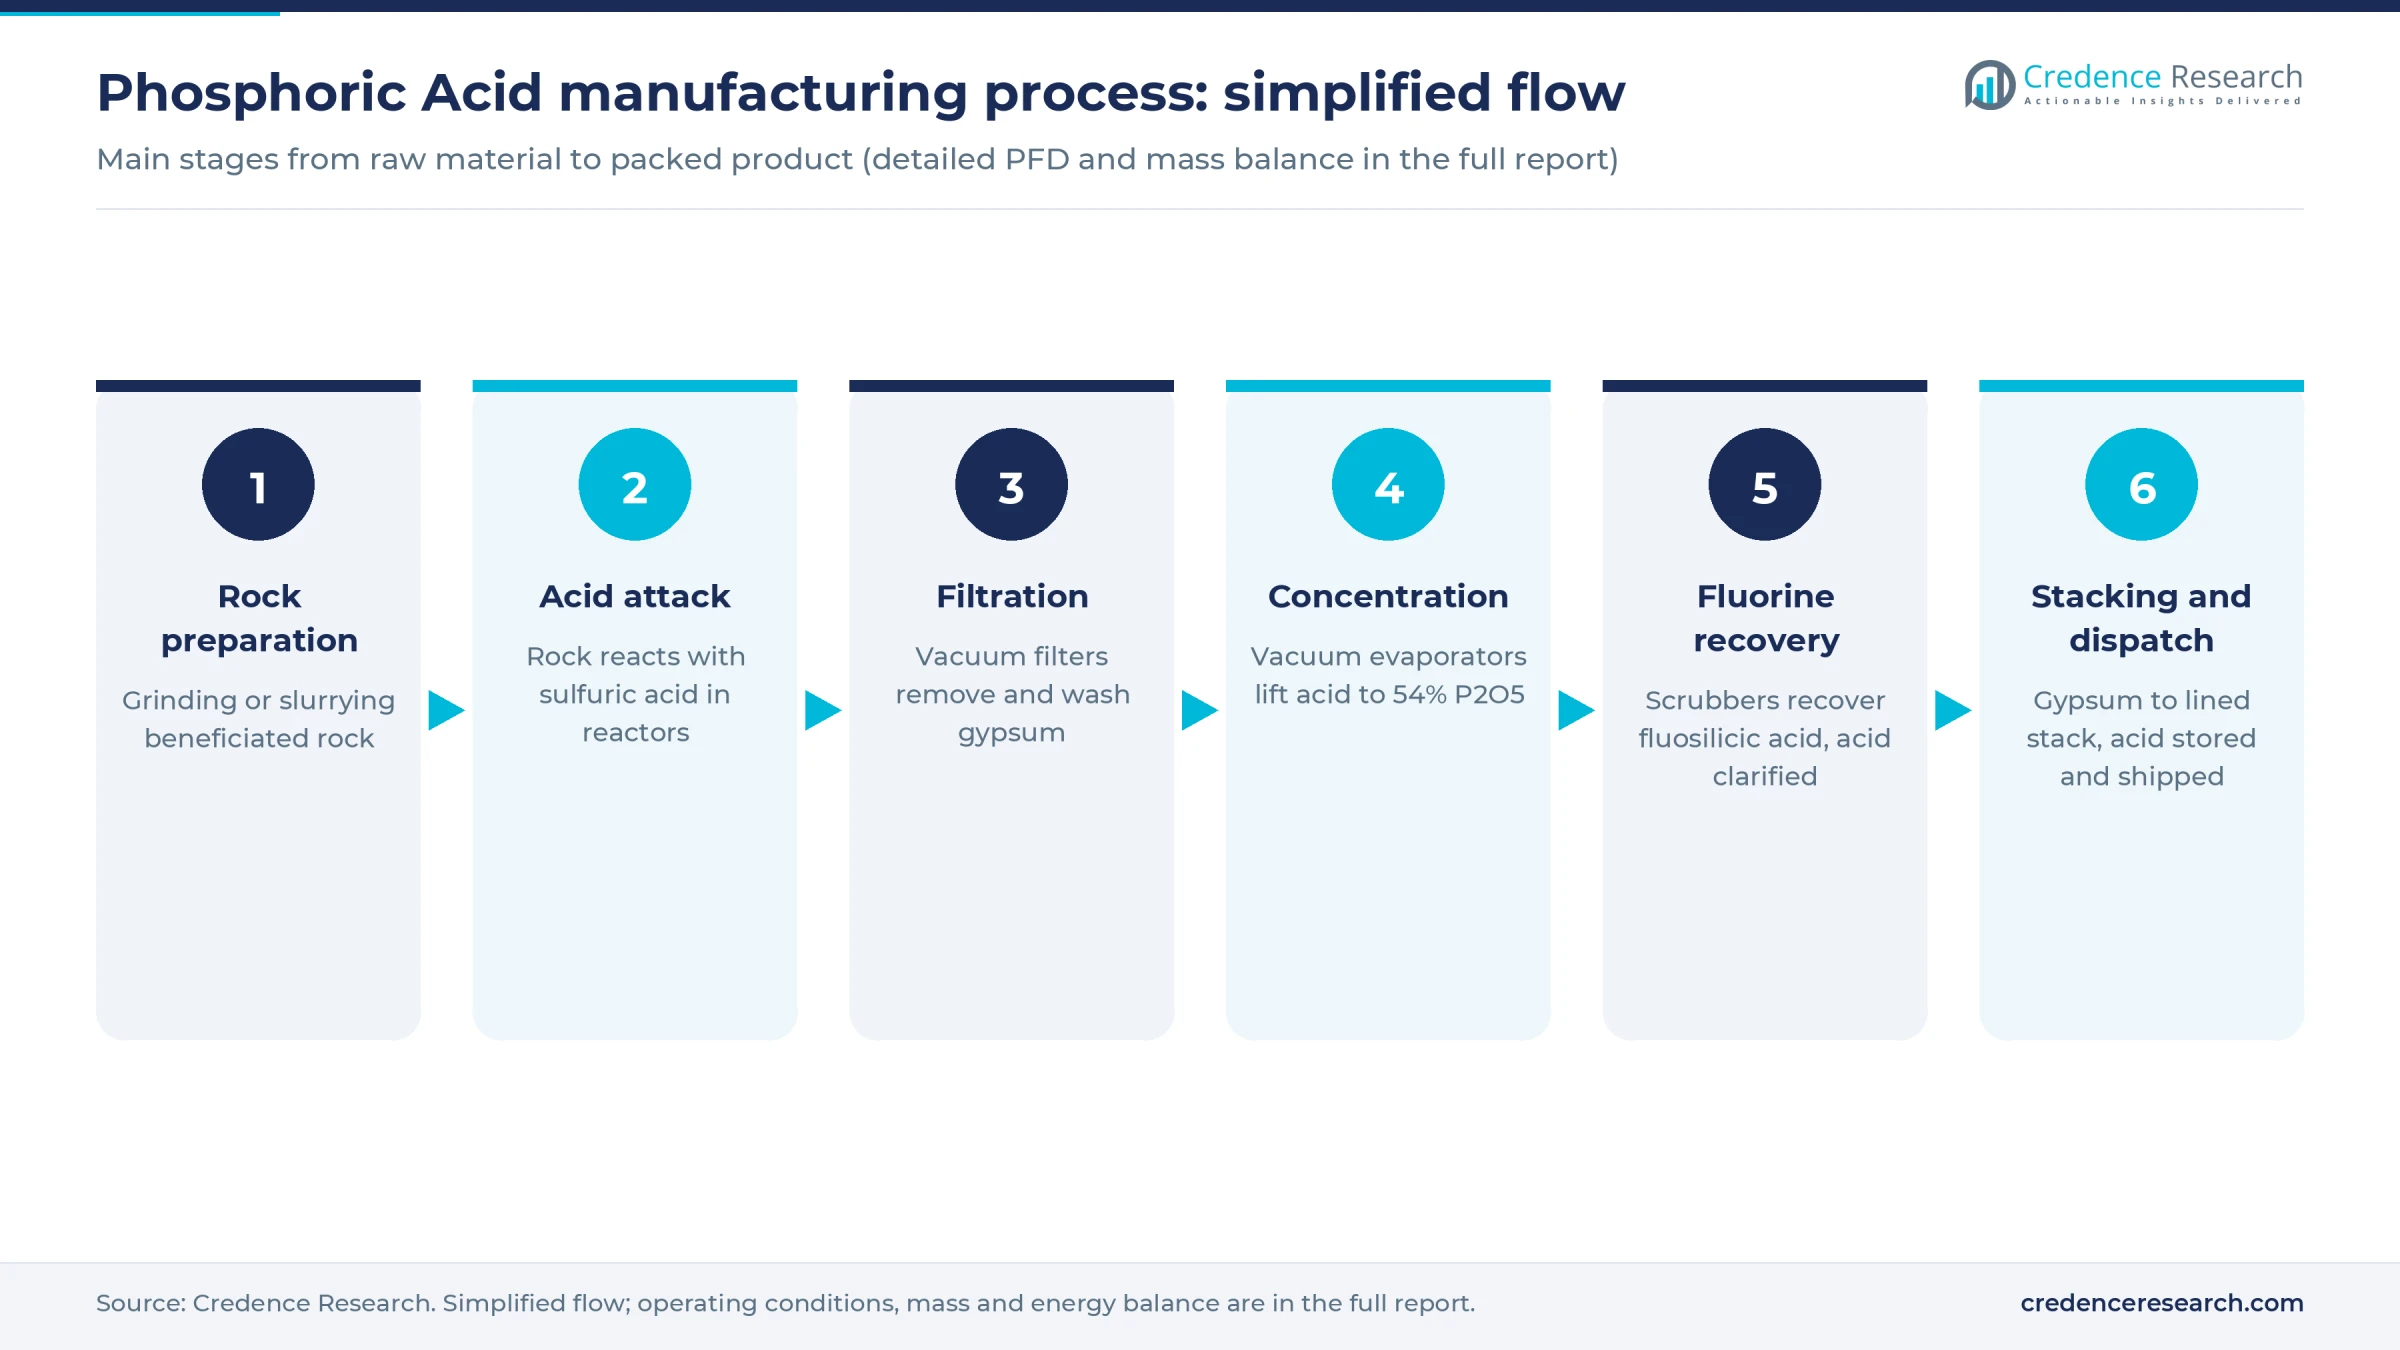
- Rock preparation. Beneficiated rock at about 30–33% P2O5 is ground in ball or roller mills, or slurried with recycled weak acid, so that the attack is fast and complete.
- Reaction. Rock and sulfuric acid meet in agitated attack tanks at about 70–80 degrees Celsius for dihydrate, or 90–110 degrees for hemihydrate. Operators hold free sulfate within a narrow band so gypsum crystals grow large and filter well.
- Filtration. Tilting-pan or belt vacuum filters separate the gypsum cake, which is washed countercurrently to recover soluble P2O5. Filter acid leaves at about 26–30% P2O5 from dihydrate plants and 40–48% from hemihydrate plants.
- Concentration. Forced-circulation vacuum evaporators heated by low-pressure steam lift the acid to 52–54% P2O5. The steam usually comes from the adjacent sulfuric acid plant.
- Fluorine recovery and clarification. Evaporator vapors are scrubbed to recover fluosilicic acid, a saleable by-product, and the acid is aged and clarified to settle sludge before storage.
- Gypsum stacking and dispatch. Phosphogypsum, about 4.5–5 tons per ton of P2O5, is slurried to a lined stack while process water is recirculated. Acid is held in rubber-lined tanks and shipped by tanker, rail or pipeline.
Recovery of P2O5 from rock runs about 93–96%, so rock quality largely decides cost. Magnesium, aluminum, iron and organic matter raise viscosity and sludge, and cadmium or uranium content can limit where products sell.
Phosphoric acid plant setup cost
The reference plant produces 600 metric tons of P2O5 a day, about 198,000 tons a year over 330 days, and includes its own sulfur-burning sulfuric acid plant of about 1,700 tons a day. Total CapEx is estimated at USD 180–420 million, covering land, rock handling, both acid plants, concentration, the gypsum stack, storage, utilities, preoperative costs and a working capital margin.
Coromandel International put its Kakinada complex, announced at 650 tons a day of phosphoric acid and 1,800 tons a day of sulfuric acid, at about 10 billion rupees in April 2024, or about USD 120 million at an assumed 83.5 rupees per dollar, on an existing fertilizer site. Scaled to 600 tons with a 0.6 exponent, escalated an assumed 6% and with an assumed 40–60% added for greenfield land, stack and offsites, it reaches about USD 170–195 million, the floor of the range. For U.S. and EU sites, construction cost is assumed at 1.8–2.2 times the Indian base, which gives about USD 340–425 million. An Egyptian state consortium contracted a USD 658 million plant for 250,000 tons a year of high-concentration acid at Abu Tartour in June 2025. Scaled to 198,000 tons, it implies about USD 570 million, above the range, because the remote site must build its own infrastructure.
For the land row, the site needs about 60 hectares for process blocks, the tank farm, rock storage and the first gypsum stack cells. At an assumed USD 5–15 per square meter, land costs USD 3–9 million, about 2% of CapEx at the midpoint.
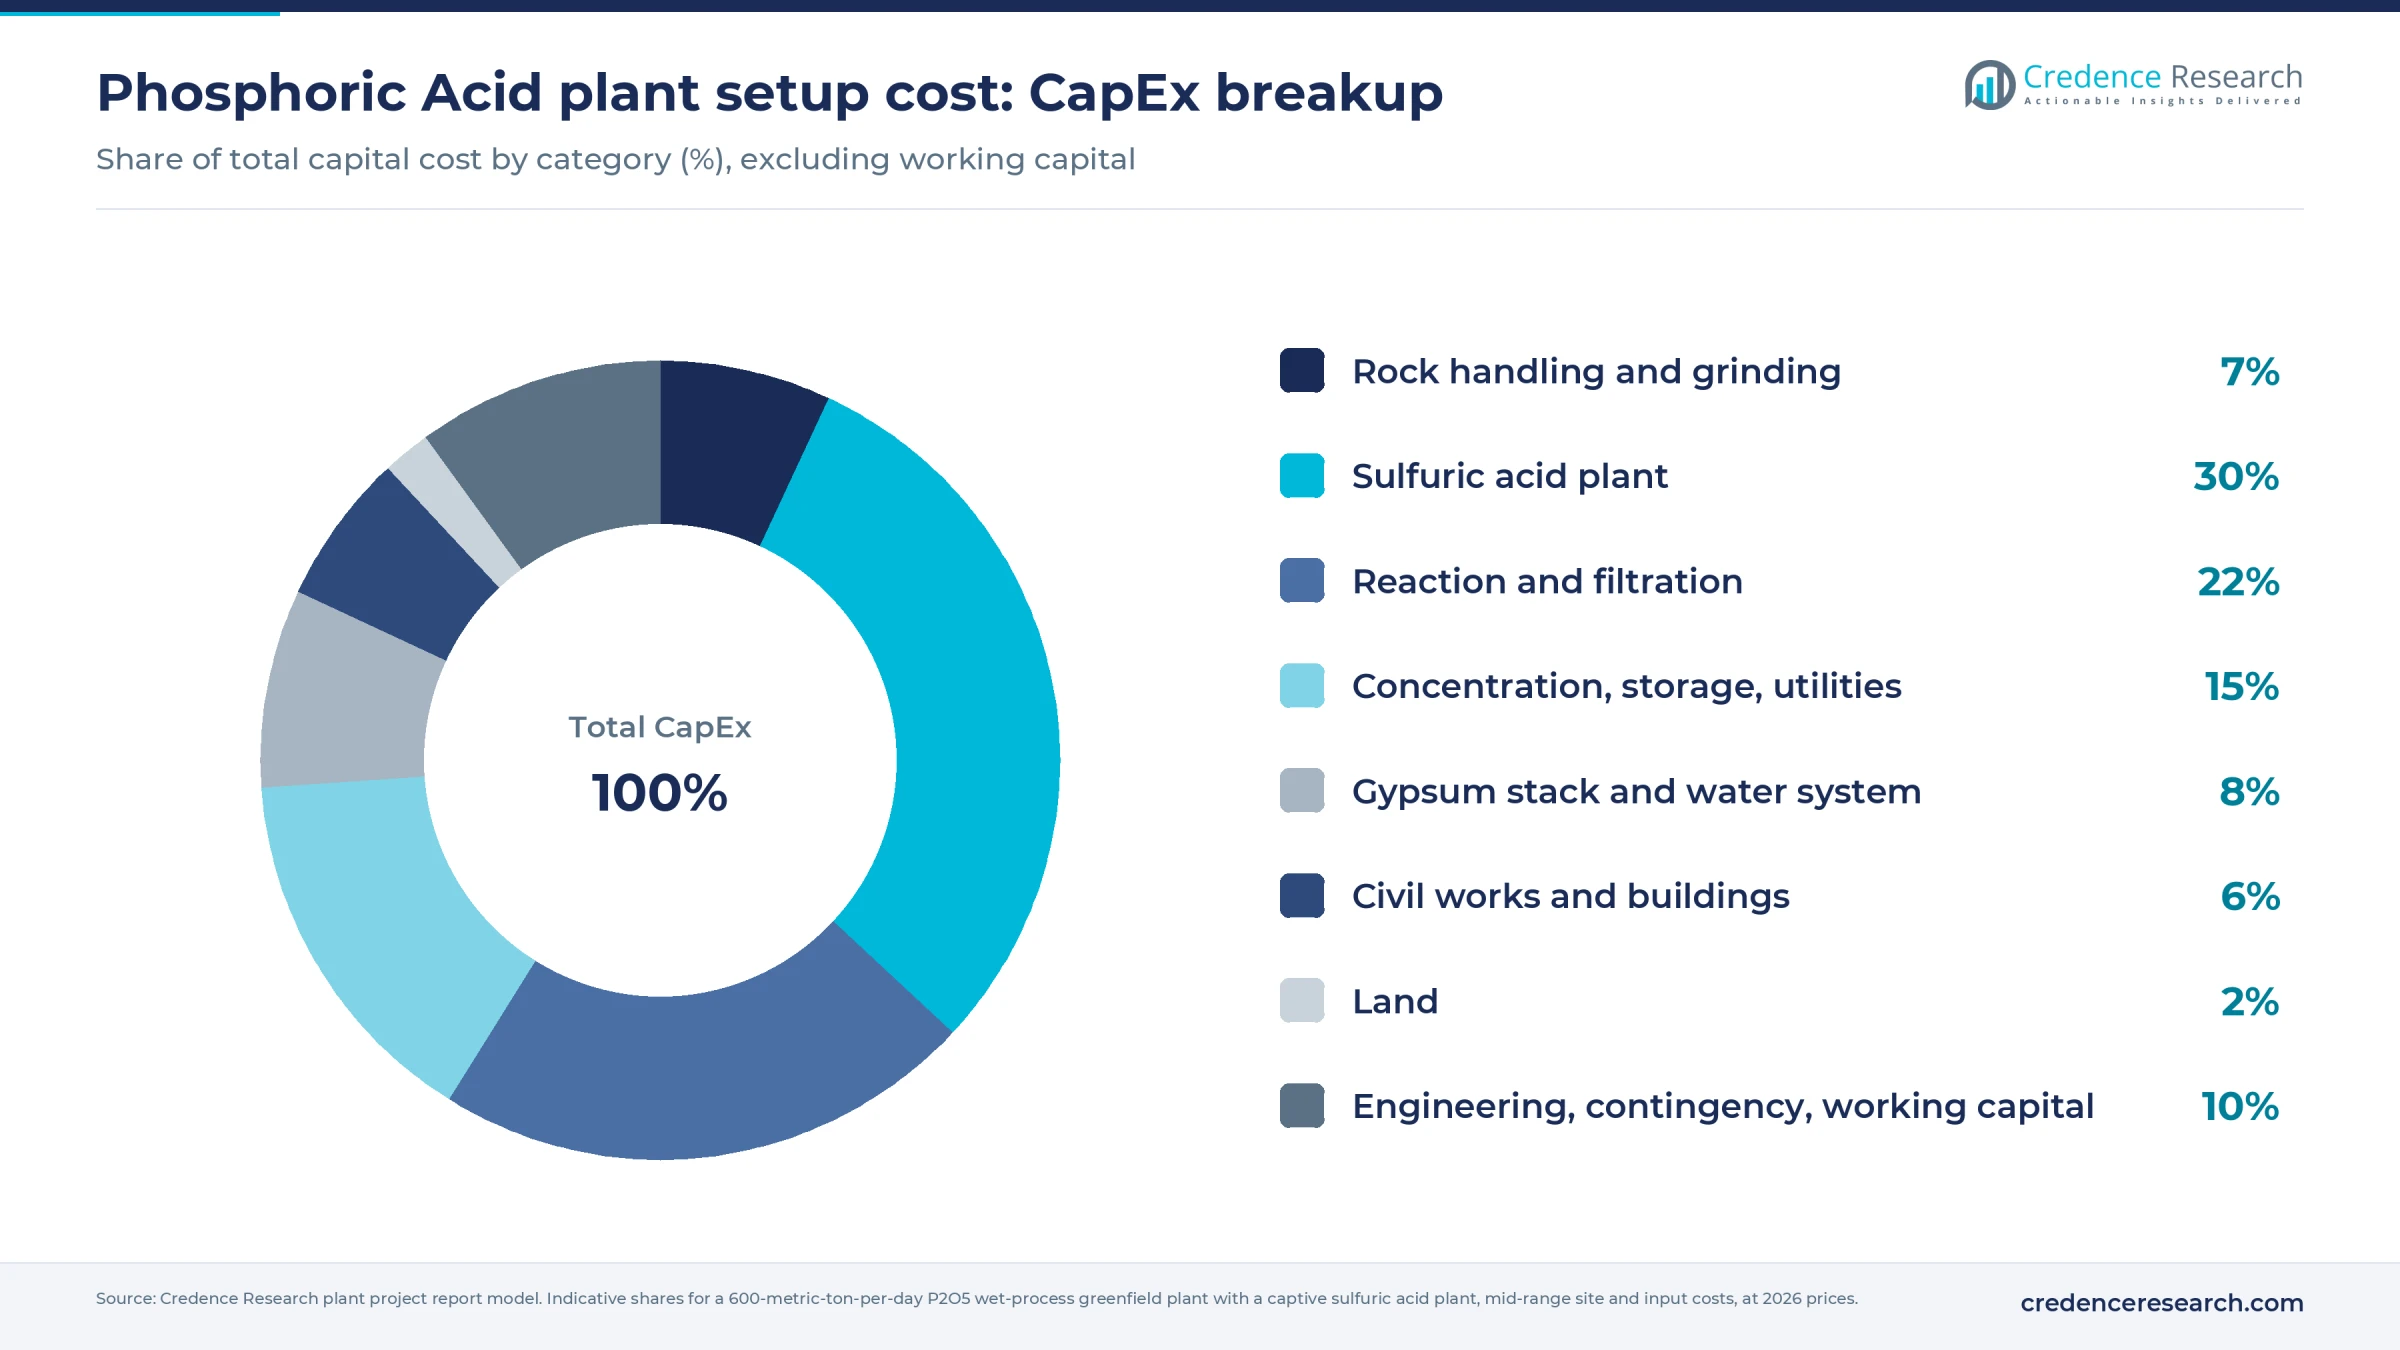
The sulfuric acid plant takes about 30% of CapEx and the reaction and filtration section about 22%. Running cost is dominated by two bought-in minerals.
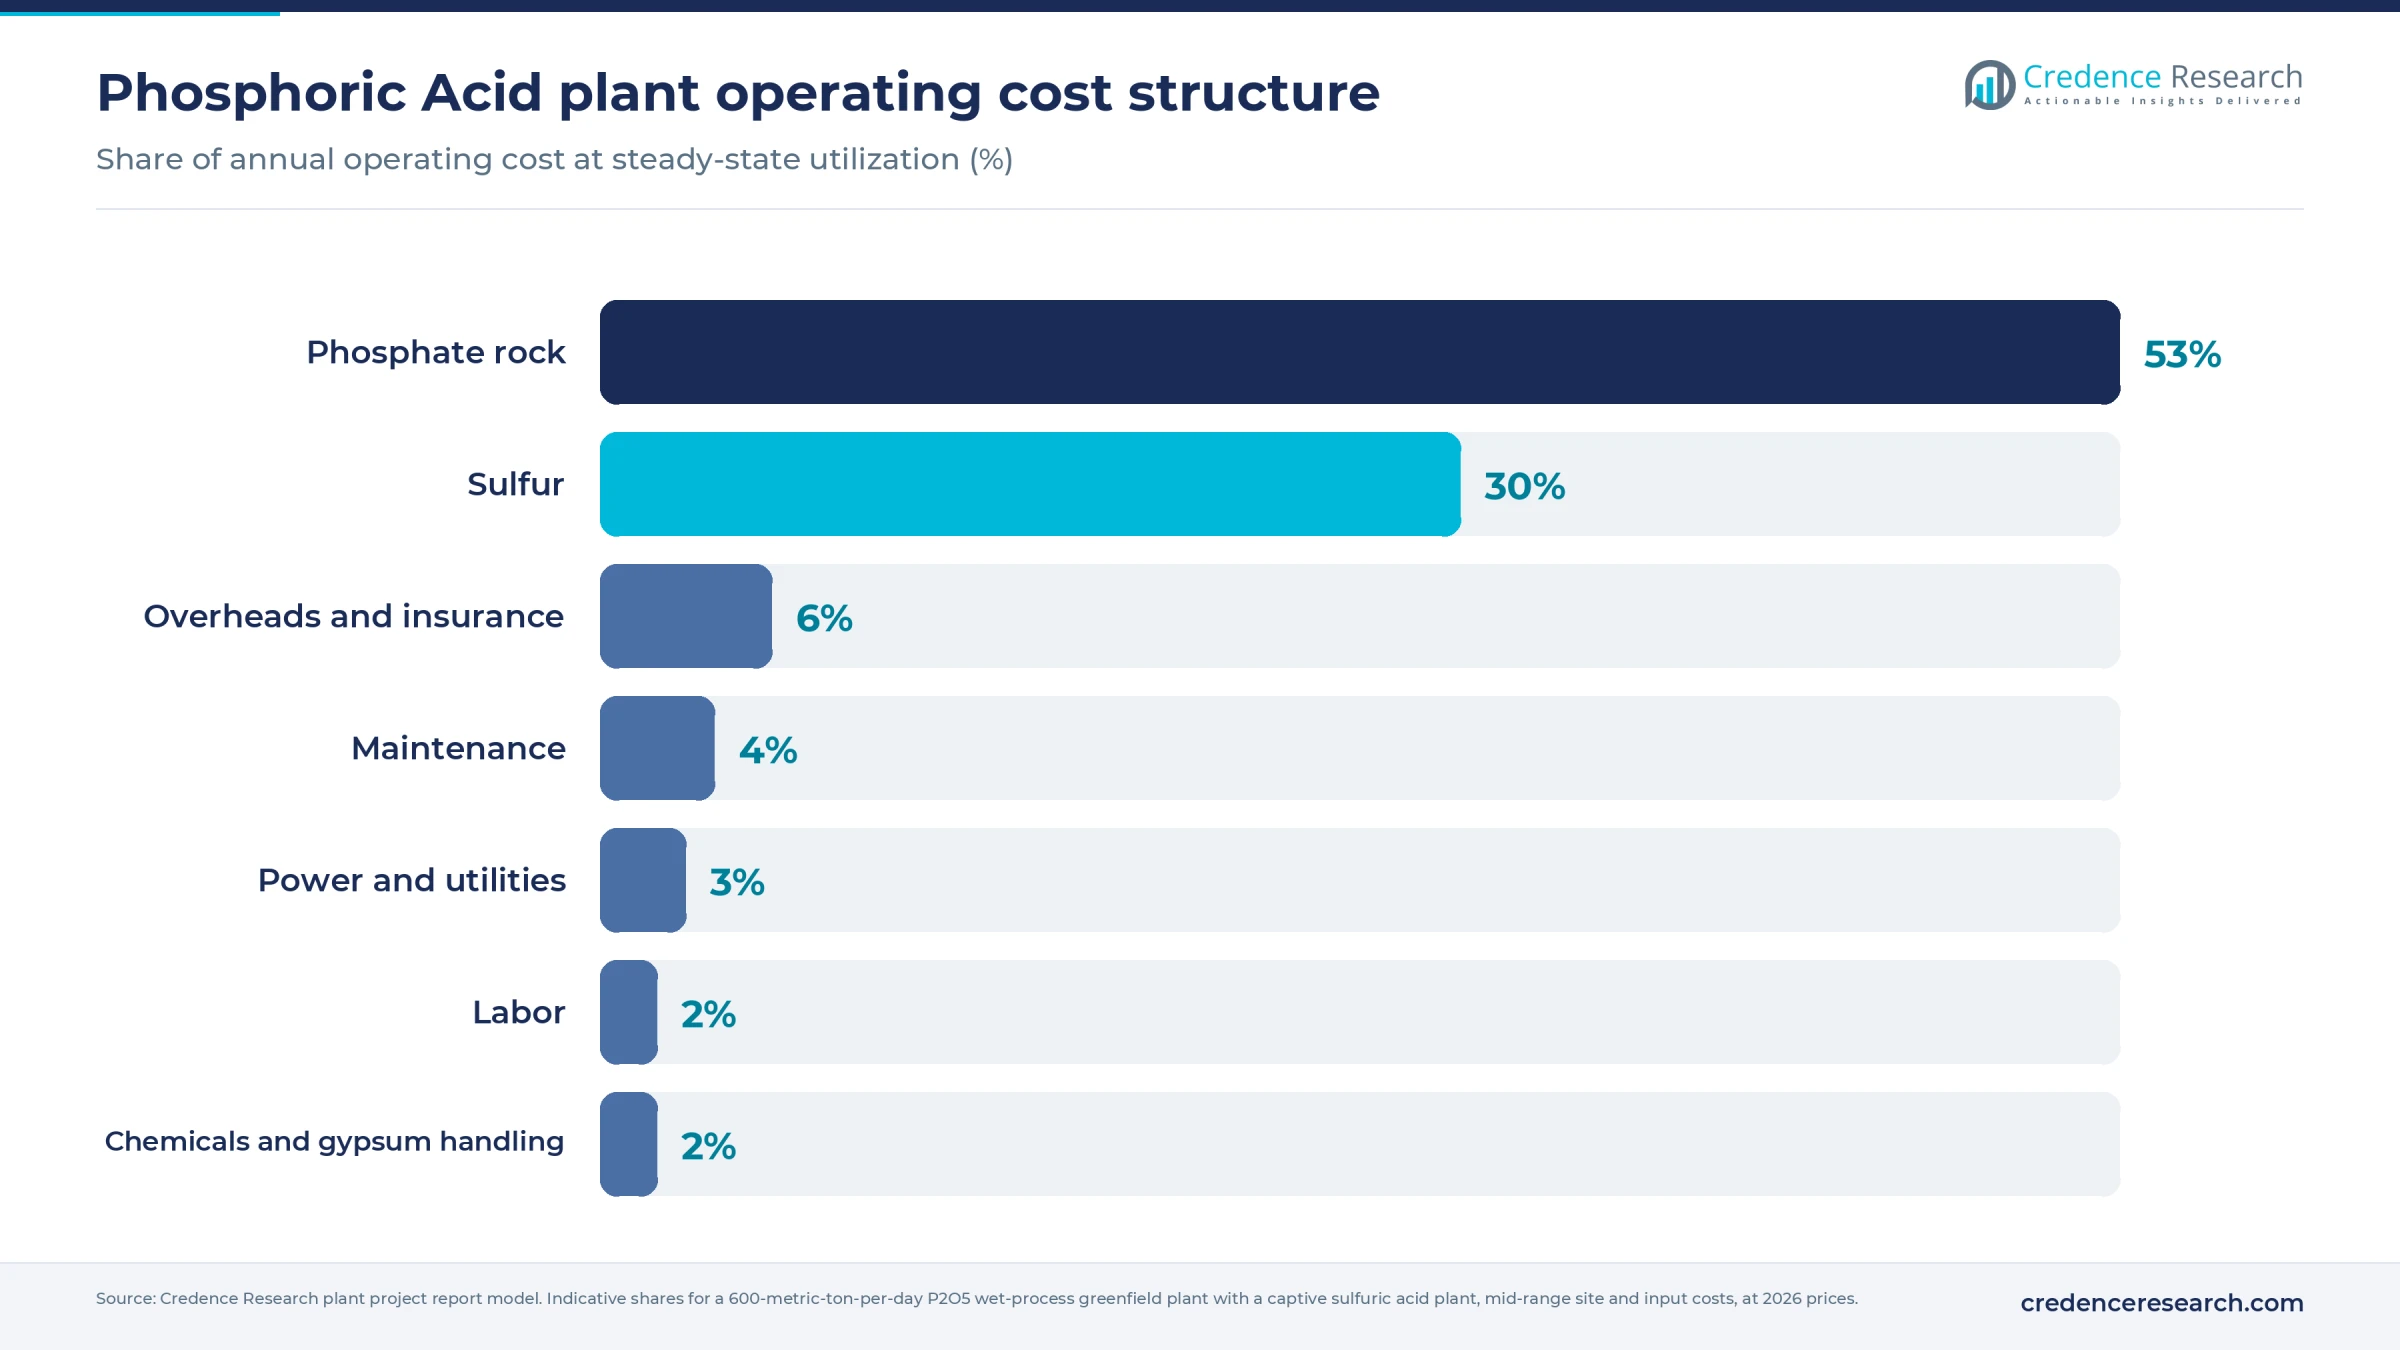
Phosphate rock and sulfur together make up about 83% of operating cost in the central case. The full report can be customized to any country or region.
Machinery and raw materials for a phosphoric acid plant
The main equipment groups are listed below; ratings, makes and the full schedule are in the report.
- Rock unloading, covered storage, reclaimers, ball or vertical roller mills and slurry tanks
- Sulfur melter, furnace, waste heat boiler, converter and absorption towers for the captive acid plant
- Rubber-lined attack reactors, agitators, flash coolers and duplex stainless slurry pumps
- Tilting-pan or horizontal belt vacuum filters with vacuum pumps and cloth wash systems
- Graphite-tube forced-circulation evaporators, barometric condensers and fluorine scrubbers
- Clarifiers, aging tanks, lined storage tanks and loading facilities
- Gypsum slurry pumps, lined stack, process water ponds and a water treatment plant
- Steam turbine generator, cooling towers, distributed control system and laboratory
At 90% utilization, the plant consumes about 590,000 tons of rock and about 160,000 tons of sulfur a year. Merchant rock comes mainly from Morocco, Peru, Egypt, Jordan, Togo and South Africa, and Comtrade data put 2025 export unit values at about USD 157 per ton from Morocco and Egypt and USD 89 from Peru. Sulfur is recovered at refineries and sour gas plants in the Middle East, Central Asia, Russia and North America, and its price swings pass straight into the sulfuric acid market and acid cost. Owning or contracting rock is the largest single cost lever.
Phosphoric acid business profit margin and ROI
Gross margin is estimated at 22–42%, measured as the ex-works acid price minus rock, sulfur and direct conversion cost, as a share of price. The build assumes an ex-works price of USD 1,250–1,450 per ton of P2O5, a freight discount to 2026 India contract prices of USD 1,290–1,700. It uses 3.3 tons of rock per ton of P2O5 at an assumed delivered USD 145–165, about 0.89 ton of sulfur at an assumed USD 300–360 and direct conversion cost of an assumed USD 100–110.
At 90% utilization, or about 178,000 tons of P2O5, revenue is about USD 240 million in the central case. After assumed overheads of USD 8–12 million, annual cash profit is about USD 37–100 million across the central band, so payback on mid-range CapEx of USD 300 million runs about 3–8 years, with a central case near 4–5 years; pairing the weakest price with the costliest rock and sulfur stretches it past 12 years. Integrated miners in Morocco and Saudi Arabia sit at the strong end because captive rock costs far less than merchant rock.
Rock is the main sensitivity, since each USD 10 per ton change in delivered rock moves cost by about USD 33 per ton of P2O5, or about USD 6 million a year. Plants that convert acid into fertilizers or sodium tripolyphosphate capture more value per ton.
| Metric | Value |
|---|---|
| Gross margin | 22–42% |
| Payback period | 3–8 years |
| IRR (post-tax) | Available in report |
| NPV | Available in report |
| Return on investment | Available in report |
| DSCR | Available in report |
| Break-even utilization | Available in report |
How to start a phosphoric acid business, licenses and approvals
Approval steps follow a common path: company and tax registration, industrial zoning and building permits, an environmental impact assessment, air permits covering fluoride and sulfur dioxide, wastewater and stormwater discharge consent, design and closure approval for the gypsum stack, boiler and pressure vessel certification, fire and corrosive storage clearances, chemical registration, dangerous goods transport compliance and import registration for equipment.
| Market | Key approvals for a phosphoric acid plant |
|---|---|
| United States | State air construction and Title V permits applying federal hazardous air pollutant standards for phosphoric acid manufacturing in 40 CFR 63 Subpart AA and fluoride limits in the 40 CFR Part 60 performance standards for wet-process phosphoric acid plants; radon standards for phosphogypsum stacks in 40 CFR 61 Subpart R, which also restrict gypsum reuse; NPDES permits under the fertilizer effluent guidelines in 40 CFR 418; TSCA inventory listing; FDA GRAS status under 21 CFR 182.1073 for food grade |
| European Union | Integrated permit under the Industrial Emissions Directive, applying best available techniques for large volume inorganic chemicals, ammonia, acids and fertilizers; REACH registration and CLP labeling; Seveso III screening of hazardous inventories; radiation protection controls for naturally occurring radioactive material under Directive 2013/59/Euratom; food additive E 338 specifications under Regulation (EU) 231/2012 |
| India | Environmental clearance under the EIA Notification 2006 for fertilizer projects; consent to establish and operate from the state pollution control board, with phosphatic fertilizer units in the red category; Central Pollution Control Board fluoride standards for the phosphatic fertilizer industry and its phosphogypsum handling guidelines; factory license and boiler registration; FSSAI license for food grade |
Gypsum stack design often sets the timeline, because regulators review liner, water balance and long-term closure funding before construction.
Key phosphoric acid manufacturers and recent developments
Morocco's OCP Group is the largest merchant phosphoric acid supplier, shipping from Jorf Lasfar and Safi to India, Europe and Latin America. Other major producers include Ma'aden in Saudi Arabia, Mosaic, Nutrien and J.R. Simplot in North America, PhosAgro and EuroChem in Russia, Jordan Phosphate Mines, Indorama-owned Industries Chimiques du Senegal, ICL in Israel and Europe, GCT in Tunisia, and Chinese groups such as Yuntianhua, Wengfu and Hubei Xingfa. Prayon in Belgium focuses on purified and technical grades, while Coromandel, Paradeep Phosphates, IFFCO and GSFC run integrated plants in India.
- March 2026: Coromandel International began trial production at its 650-ton-a-day phosphoric acid and 2,000-ton-a-day sulfuric acid plants at Kakinada, cutting its reliance on imported acid.
- April 2026: Indorama Corporation and Misr Phosphate announced an initial USD 525 million phosphate fertilizer and chemicals complex at Ain Sokhna in Egypt's Suez Canal Economic Zone, with a first phase of up to 600,000 tons a year, about 80% for export.
- October 2026: GSFC's board approved a 600-ton-a-day phosphoric acid plant and an 1,800-ton-a-day sulfuric acid plant at Sikka, and Tata Projects later won the EPC contract for the complex.
Importers are integrating backward and rock-rich exporters are adding value, which squeezes standalone merchant plants.
What's inside the Phosphoric Acid project report PDF
The report runs to 21 chapters. Open a chapter to see its sections.
1. Preface
2. Scope and Methodology
- 2.1 Objectives of the Study
- 2.2 Stakeholders
- 2.3 Research Methodology
- 2.4 Data Sources and Key Assumptions
3. Executive Summary
- 3.1 Market Snapshot
- 3.2 Project at a Glance (Capacity, CapEx, OpEx)
- 3.3 Key Financial Indicators (IRR, NPV, Payback, Break-even)
- 3.4 Feasibility Verdict
4. Product Overview
- 4.1 Phosphoric Acid Definition and Properties
- 4.2 Grades and Specifications (BIS / ISO / ASTM)
- 4.3 HS Code and Classification
- 4.4 Key Applications
- 4.5 Substitutes
5. Global Phosphoric Acid Market
- 5.1 Market Overview
- 5.2 Historical and Current Market Performance (Volume and Value)
- 5.3 Market Breakup by Grade / Type
- 5.4 Market Breakup by End-Use Industry
- 5.5 Market Breakup by Region
- 5.6 Market Drivers, Restraints and Trends
- 5.7 Value Chain Analysis
- 5.8 Market Forecast
6. Target Country Phosphoric Acid Market Analysis
- 6.1 Demand and Supply Analysis
- 6.2 Installed Capacity vs Demand Gap
- 6.3 Import Dependence
- 6.4 Demand Forecast by End-Use
7. Trade Analysis
- 7.1 Imports by Volume, Value and Country
- 7.2 Exports by Volume, Value and Country
- 7.3 Trade Balance and Opportunities
8. Price Analysis
- 8.1 Historical Phosphoric Acid Price Trends by Region
- 8.2 Raw Material / Feedstock Price Trends and Linkage
- 8.3 Price Forecast
- 8.4 Margins Across the Value Chain
9. Competitive Landscape
- 9.1 Market Structure
- 9.2 Key Players and Installed Capacities
- 9.3 Profiles of Key Players
- 9.4 Recent Developments (Expansions, M&A, New Plants)
10. Manufacturing Process and Technology
- 10.1 Comparison of Technology Routes
- 10.2 Selected Route and Process Flow Diagram
- 10.3 Unit Operations Involved
- 10.4 Chemical Reactions Involved
- 10.5 Mass Balance and Raw Material Requirements
- 10.6 Energy Balance
- 10.7 Quality Assurance Criteria and Technical Tests
- 10.8 By-products and Waste Handling
- 10.9 Technology Licensors / Providers
11. Project Details, Requirements and Costs
- 11.1 Land, Location and Site Development
- 11.1.1 Site Selection Criteria
- 11.1.2 Location Analysis
- 11.1.3 Land Requirement and Costs
- 11.1.4 Site Development Costs
- 11.2 Plant Layout
- 11.2.1 Layout Principles
- 11.2.2 Proposed Layout
- 11.2.3 Factors Influencing Layout
- 11.3 Civil Works and Buildings
- 11.4 Plant Machinery
- 11.4.1 Machinery Requirements and Specifications
- 11.4.2 Machinery Costs
- 11.4.3 Machinery Suppliers
- 11.5 Raw Materials
- 11.5.1 Requirements per Tonne of Output
- 11.5.2 Procurement and Sourcing
- 11.5.3 Costs
- 11.5.4 Suppliers
- 11.6 Packaging
- 11.6.1 Packaging Requirements
- 11.6.2 Packaging Costs
- 11.6.3 Packaging Suppliers
- 11.7 Storage and Material Handling
- 11.8 Transportation Requirements and Costs
- 11.9 Utilities
- 11.9.1 Power Requirements and Costs
- 11.9.2 Water Requirements and Costs
- 11.9.3 Steam, Fuel and Other Utilities
- 11.10 Manpower Requirements and Wages
12. Environment, Health, Safety and Sustainability
- 12.1 Effluent and Emissions Management
- 12.2 Hazard Classification and Safety Measures
- 12.3 Carbon Footprint
- 12.4 Green / Low-Carbon Process Options
13. Regulatory Procedures, Approvals and Certifications
- 13.1 Licences and Registrations
- 13.2 Environmental Clearances
- 13.3 Product Certifications (BIS, REACH, etc.)
- 13.4 Approval Timeline
14. Project Implementation Schedule
15. Project Economics
- 15.1 Capital Cost of the Project
- 15.2 Techno-Economic Parameters
- 15.3 Capacity Utilization and Ramp-up
- 15.4 Product Pricing and Margins
- 15.5 Income Projections
- 15.6 Expenditure Projections
- 15.7 Working Capital Requirement
- 15.8 Taxation
- 15.9 Depreciation
16. Financial Analysis
- 16.1 Projected Profit and Loss Account
- 16.2 Projected Cash Flow Statement
- 16.3 Projected Balance Sheet
- 16.4 Liquidity Analysis
- 16.5 Profitability Analysis (Payback, NPV, IRR, ROI)
- 16.6 Break-even Analysis
- 16.7 Debt Service Coverage Ratio (DSCR)
- 16.8 Sensitivity Analysis
- 16.9 Scenario and Uncertainty Analysis
17. Funding and Incentives
- 17.1 Means of Finance and Debt-Equity Structure
- 17.2 Loans and Financial Assistance
- 17.3 Government Schemes and Subsidies (PLI, State Policies)
18. Risk Assessment
- 18.1 Key Success Factors
- 18.2 Key Risk Factors
- 18.3 Risk Mitigation
19. Strategic Recommendations
20. Case Study of a Successful Venture
21. Appendix
- 21.1 Detailed Assumptions
- 21.2 Abbreviations
- 21.3 List of Tables and Figures
- 21.4 Sources
This page vs. the full report
| Data point | On this page (free) | In the full report |
|---|---|---|
| Total CapEx | One rounded range at one capacity | Exact figure at three capacities with a line-item breakup |
| CapEx breakup | Category shares (%) only | Cost, quantity and supplier for every machine |
| Operating cost | Share of raw materials, utilities and labor | Per-unit cost sheet with each input price and consumption |
| Profitability | Gross margin range and payback band | Exact IRR, NPV, ROI, break-even and DSCR |
| Financial statements | List of what is included | 10-year P&L, cash flow, balance sheet and Excel model |
| Sensitivity | One directional line | Full sensitivity and scenario tables |
| Process | Simplified flow diagram | Detailed process flow, mass and energy balance, operating conditions |
| Machinery | Names of the main machines | Specifications, capacity, cost and supplier list |
| Market | Headline size, growth and global demand | Segment, region, trade and price forecast tables |
| Suppliers and buyers | Supplier types and sourcing hubs | Named suppliers and buyers |
Phosphoric Acid project report: FAQs
How much does it cost to set up a phosphoric acid plant?
Why is phosphoric acid priced per ton of P2O5?
What raw materials does a phosphoric acid plant need?
What is the profit margin in phosphoric acid manufacturing?
What is the payback period for a phosphoric acid plant?
What happens to the phosphogypsum a plant produces?

About the analyst
Nisha Gupta, Senior Research Analyst
Nisha Gupta is a Senior Research Analyst at Credence Research Inc. who works across industry domains, including packaging, automotive parts and machinery. Her focus is the modelling engine behind each study: she builds quantitative market databases and econometric forecasting frameworks, and developed automated Excel-based market modelling templates that cut client turnaround time by 30%.
Related market research
- Sulfuric Acid Market Size, Growth, Share and Forecast 2032
- Lithium Iron Phosphate Market Size, Growth and Forecast 2032
- Sodium Tripolyphosphate Market size, Growth and Forecast 2032
- Europe Phosphate Fertilizers Market Size, Share and Forecast 2032
- Agriculture Fertilizers Market Size and Forecast Report 2032
More plant project reports
- Vinyl Chloride Manufacturing Plant Project Report (DPR) 2026
- Neopentyl Glycol Manufacturing Plant Project Report (DPR) 2026
- Citric Acid Manufacturing Plant Project Report (DPR) 2026
- Castor Oil Processing Plant Project Report (DPR) 2026
- Styrene Manufacturing Plant Project Report (DPR) 2026
- Polyvinyl Chloride Manufacturing Plant Project Report (DPR) 2026