
Quick answer
A styrene plant turns benzene and ethylene into the monomer behind polystyrene, ABS resins and synthetic rubber. A greenfield ethylbenzene-styrene unit of 500,000 metric tons a year needs an estimated USD 550–850 million of CapEx. Benzene and ethylene make up about 88% of operating cost, so gross margin of 2–16% depends on feedstock access. Payback is about 10–20 years at mid-range CapEx, and a plant buying feedstock at weak 2025 Asian spreads does not pay back.
Viable only with secure, cost-advantaged ethylene and benzene, ideally next to a cracker or refinery with a captive polymer outlet; a stand-alone merchant plant faces thin spreads in an oversupplied market.
Styrene plant: key highlights
| Parameter | Indicative value | Note |
|---|---|---|
| Plant capacity | 500,000 metric tons a year of styrene | About 1,500 tons a day over 330 operating days, with an integrated ethylbenzene unit |
| Total CapEx | USD 550–850 million | Greenfield; low end reflects an Asian chemical park with shared infrastructure, top end a U.S. or EU site |
| Raw material share of operating cost | 88–89% | Benzene and ethylene at assumed delivered prices |
| Gross margin | 2–16% | Styrene price minus feedstock and net conversion cost |
| Payback period | 10–20 years | 90% utilization, mid-range CapEx of USD 700 million; no payback at weak 2025 Asian spreads |
| IRR | Available in report | Post-tax, 10-year model |
| Break-even | Available in report | Capacity utilization basis |
Ranges assume a 500,000-ton-a-year greenfield ethylbenzene-styrene plant on purchased benzene and pipeline ethylene, Asian to U.S. or EU sites, 2026 prices, 90% utilization, styrene at USD 975–1,042 per ton from 2025 trade unit values and assumed delivered feedstock prices. CapEx is scaled from disclosed projects with a 0.6 exponent, assumed escalation and an assumed 74 rupees per dollar for 2021. Customizable to any country.
What is styrene?
Styrene, also called styrene monomer or vinylbenzene, is a colorless, oily aromatic liquid with the formula C8H8. It boils at about 145 degrees Celsius and has a sweet odor at low levels. Its vinyl group polymerizes readily, which makes it valuable to plastics makers but also means it must be kept cool and dosed with an inhibitor, usually 4-tert-butylcatechol, so it does not turn into polymer in storage tanks.
Commercial styrene is sold as one high-purity grade, typically at least 99.8% to 99.9%, with tight limits on ethylbenzene, phenylacetylene, polymer and sulfur. It falls under Harmonized System subheading 2902.50. Most is made by dehydrogenating ethylbenzene, which in turn comes from benzene and ethylene, so a stand-alone plant sits between two volatile feedstock markets and its polymer customers.
Polystyrene and expandable polystyrene take the largest share of demand, for packaging, appliance housings and building insulation. Other outlets include ABS resins for appliances and car interiors, styrene-acrylonitrile, styrene-butadiene rubber for tires, latex for carpet backing and paper coatings, and unsaturated polyester resins for fiberglass boats, pipes and wind turbine blades.
Styrene market overview and global demand
Credence Research values the global styrene petrochemicals market, which covers the monomer and its main derivatives, at about USD 75.2 billion in 2025, based on its USD 70.4 billion estimate for 2024 and a 6.9% CAGR, rising to about USD 120 billion by 2032. Packaging, appliances, insulation and tire rubber drive most of the volume.
Capacity has grown much faster than demand. Industry figures cited by Taiwan styrene Monomer Corp. in September 2026 put China's 2025 capacity at 22.71 million metric tons a year, or 50.7% of the world total, after a wave of large refinery-integrated units on the east coast. As China moved toward self-sufficiency, exporters in Northeast Asia lost their main outlet and operating rates fell.
Seaborne trade now runs mainly from cost-advantaged producers to deficit markets. UN Comtrade data for HS 290250 show reported exports of about USD 7.1 billion in 2025, down from USD 7.9 billion in 2024. Saudi Arabia shipped about 1.57 million tons at near USD 931 per ton and the United States about 1.55 million tons at near USD 1,042, followed by the Netherlands and Kuwait. India, which still relies almost entirely on imports, was the largest buyer at about 1.21 million tons worth USD 1.18 billion, ahead of Turkey, South Korea, the Netherlands and Mexico.
Prices rose sharply in 2026. Platts price assessments put Asian styrene at USD 1,369 per metric ton CFR China on Oct. 2, 2026, with benzene at about USD 1,178 FOB Korea and ethylene at USD 1,150 CFR Northeast Asia. Feedstocks rose almost as fast as the monomer, so higher prices did little for non-integrated producers.
Styrene manufacturing process
The reference plant uses the classic two-step route: liquid-phase alkylation of benzene with ethylene to make ethylbenzene, then catalytic dehydrogenation of ethylbenzene to styrene. This route accounts for most world capacity. The main alternative co-produces styrene with propylene oxide, which ties output to a second market and suits only very large integrated sites.
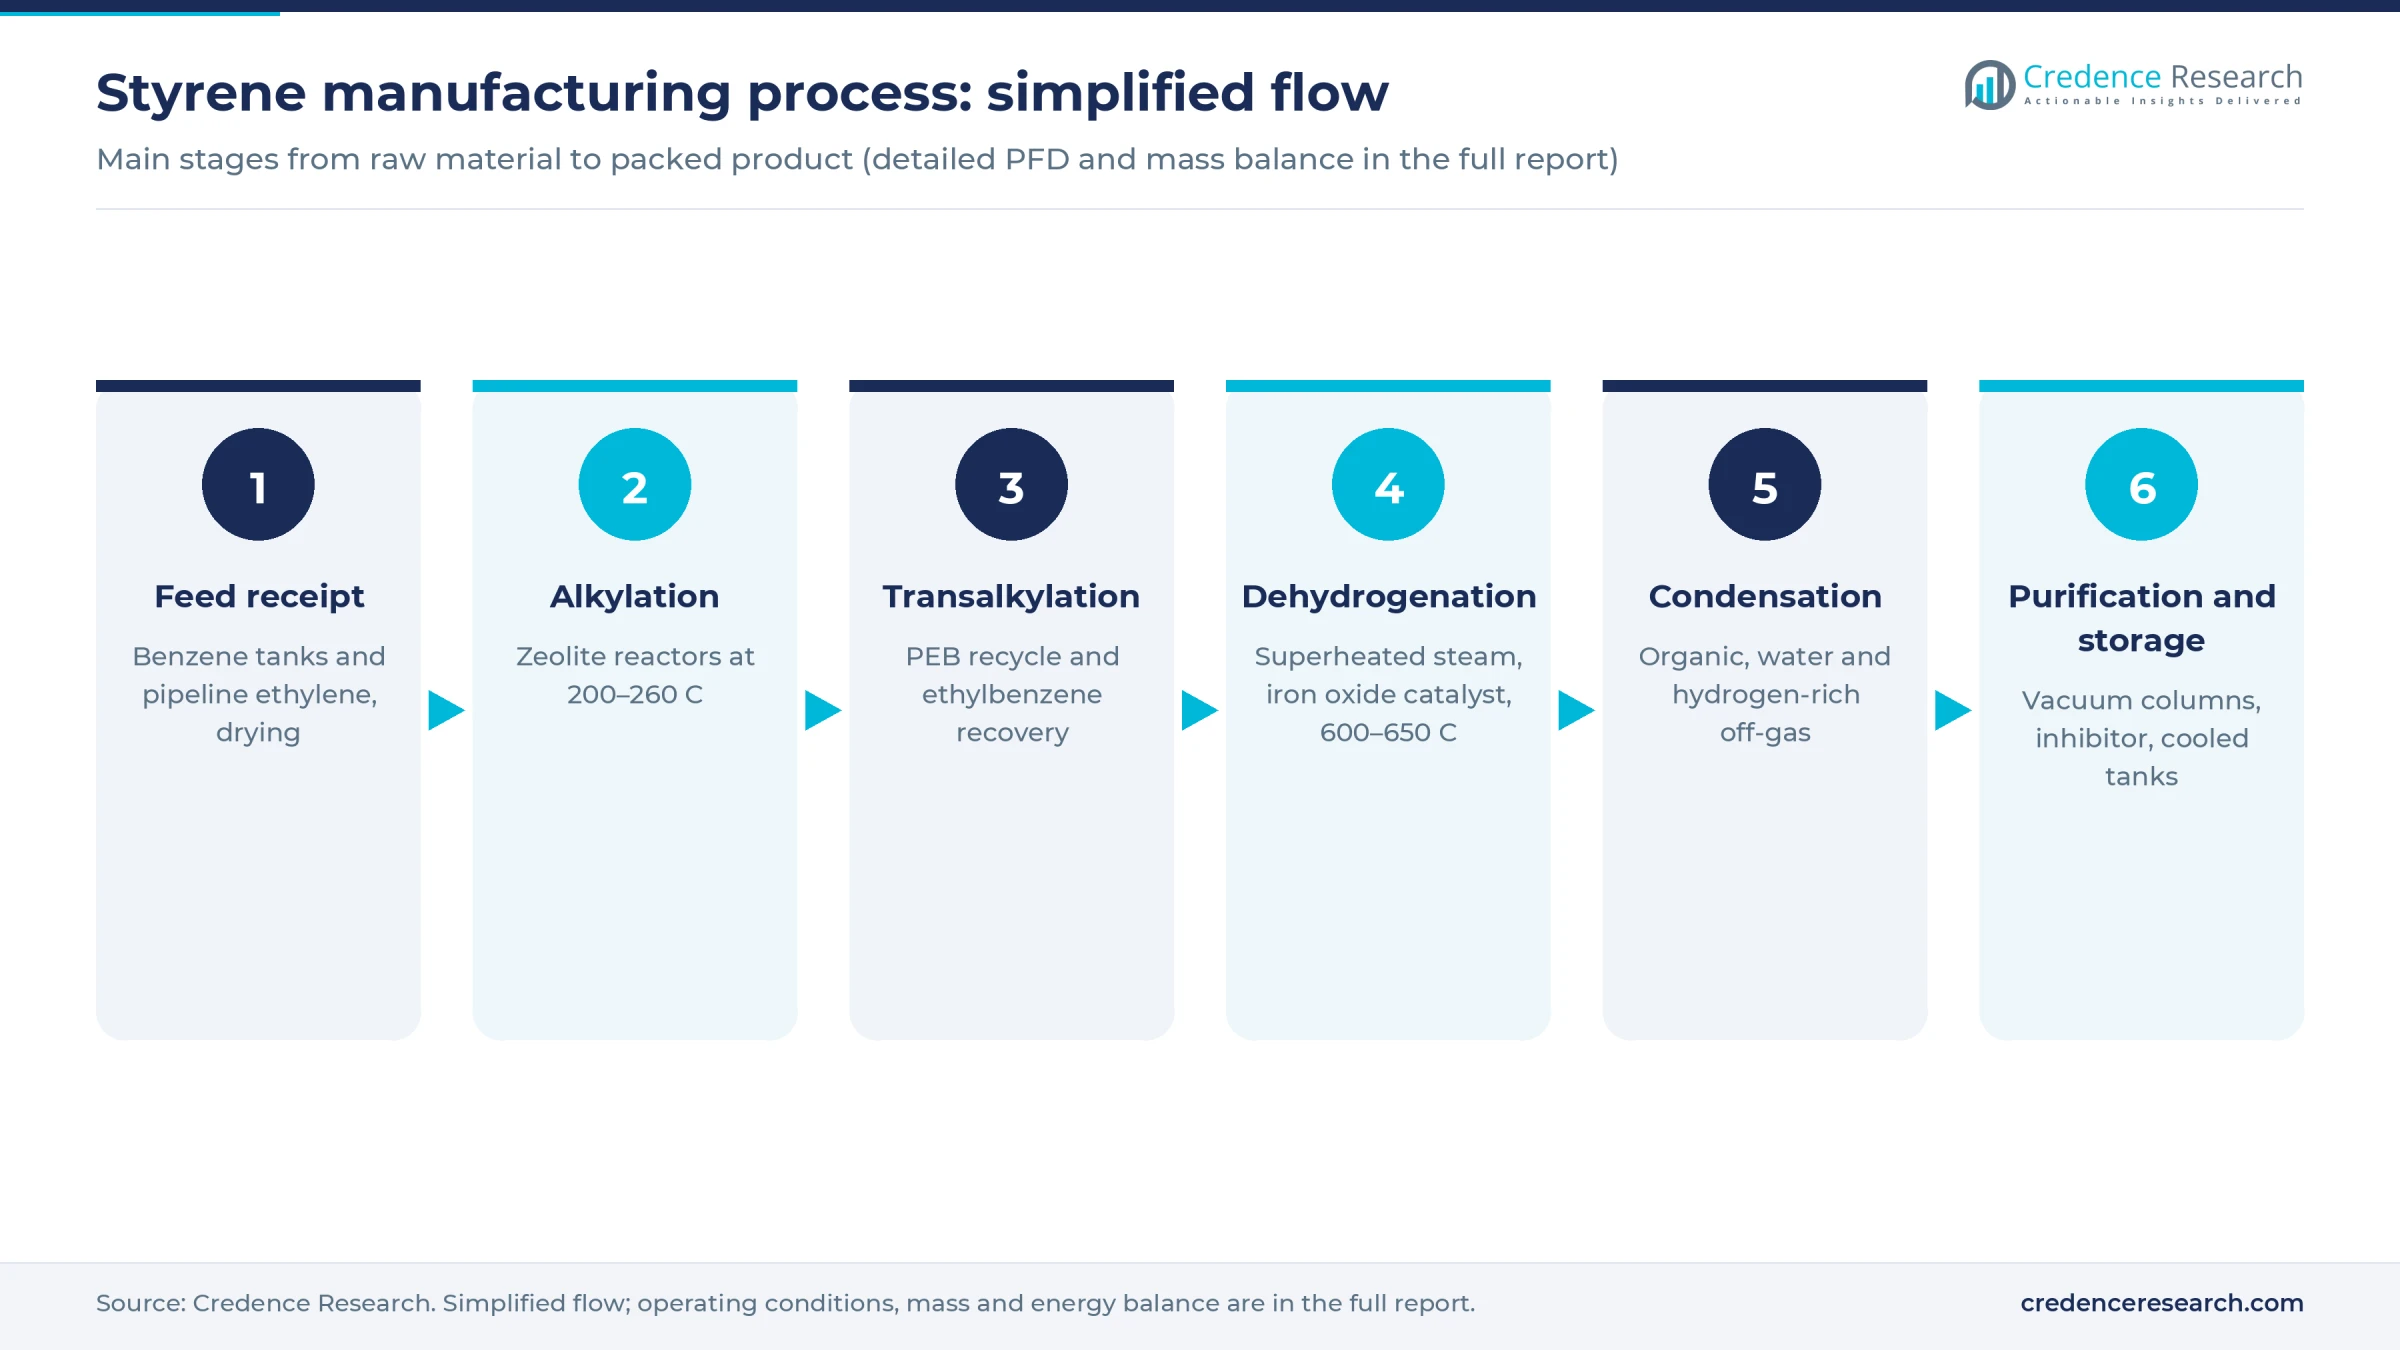
- Feed receipt. Benzene arrives by ship or pipeline into floating-roof tanks, and ethylene comes by pipeline from a cracker or from a refrigerated terminal. Both are dried, and benzene is treated to remove catalyst poisons.
- Alkylation. Ethylene and an excess of benzene react over a zeolite catalyst in fixed-bed reactors at roughly 200–260 degrees Celsius. Surplus benzene limits the formation of diethylbenzene and heavier polyethylbenzenes.
- Transalkylation and ethylbenzene recovery. Polyethylbenzenes react with recycled benzene in a separate reactor to make more ethylbenzene. A train of distillation columns returns benzene to the reactors and delivers ethylbenzene above 99.8% purity.
- Dehydrogenation. Ethylbenzene mixed with superheated steam at about 600–650 degrees Celsius flows through two or three radial-flow reactors packed with potassium-promoted iron oxide catalyst, under vacuum. Each pass converts roughly 60–70% of the feed, with selectivity to styrene in the mid-90s percent.
- Condensation and off-gas handling. Reactor effluent is cooled, and the condensate splits into an organic phase, process water and a hydrogen-rich vent gas that is burned in the superheater.
- Purification and storage. Vacuum columns remove benzene and toluene, split unreacted ethylbenzene for recycle and finish styrene to specification. Inhibitor is added, and product goes to cooled tanks before shipment by vessel, rail or truck.
Low column temperatures and careful inhibitor dosing are central to the design, since the monomer polymerizes quickly when heated. Process water is stripped and reused to raise steam, and tar residues are burned as fuel.
Styrene plant setup cost
The reference plant makes 500,000 metric tons a year of styrene, about 1,500 tons a day over 330 operating days, with its own ethylbenzene unit fed by purchased benzene and pipeline ethylene. Total CapEx is estimated at USD 550–850 million, covering land, alkylation, dehydrogenation, distillation, the tank farm, utilities, license, engineering, preoperative costs and working capital.
Two disclosed projects anchor the range. Indian Oil Corp. approved a 387,000-ton project at its Panipat refinery complex for 44.95 billion rupees in June 2021, about USD 607 million at an assumed 74 rupees per dollar. Scaled to 500,000 tons with a 0.6 capacity exponent, that gives about USD 708 million, or USD 780–850 million after an assumed 10–20% escalation to 2026. In Egypt, ECHEM put its 300,000-ton project in Alexandria at USD 500 million in March 2026, which scales to about USD 680 million. A site in an established Asian chemical park that shares jetties, steam and flare systems is assumed to cost 15–20% less, or about USD 550 million, while U.S. and EU builds sit at the top of the range.
For the land row, the plant needs about 150,000 square meters for process units, a tank farm with fire spacing, loading racks, utilities and a flare. At an assumed USD 20–90 per square meter, land costs USD 3–13.5 million, about 1% of CapEx at the midpoint.
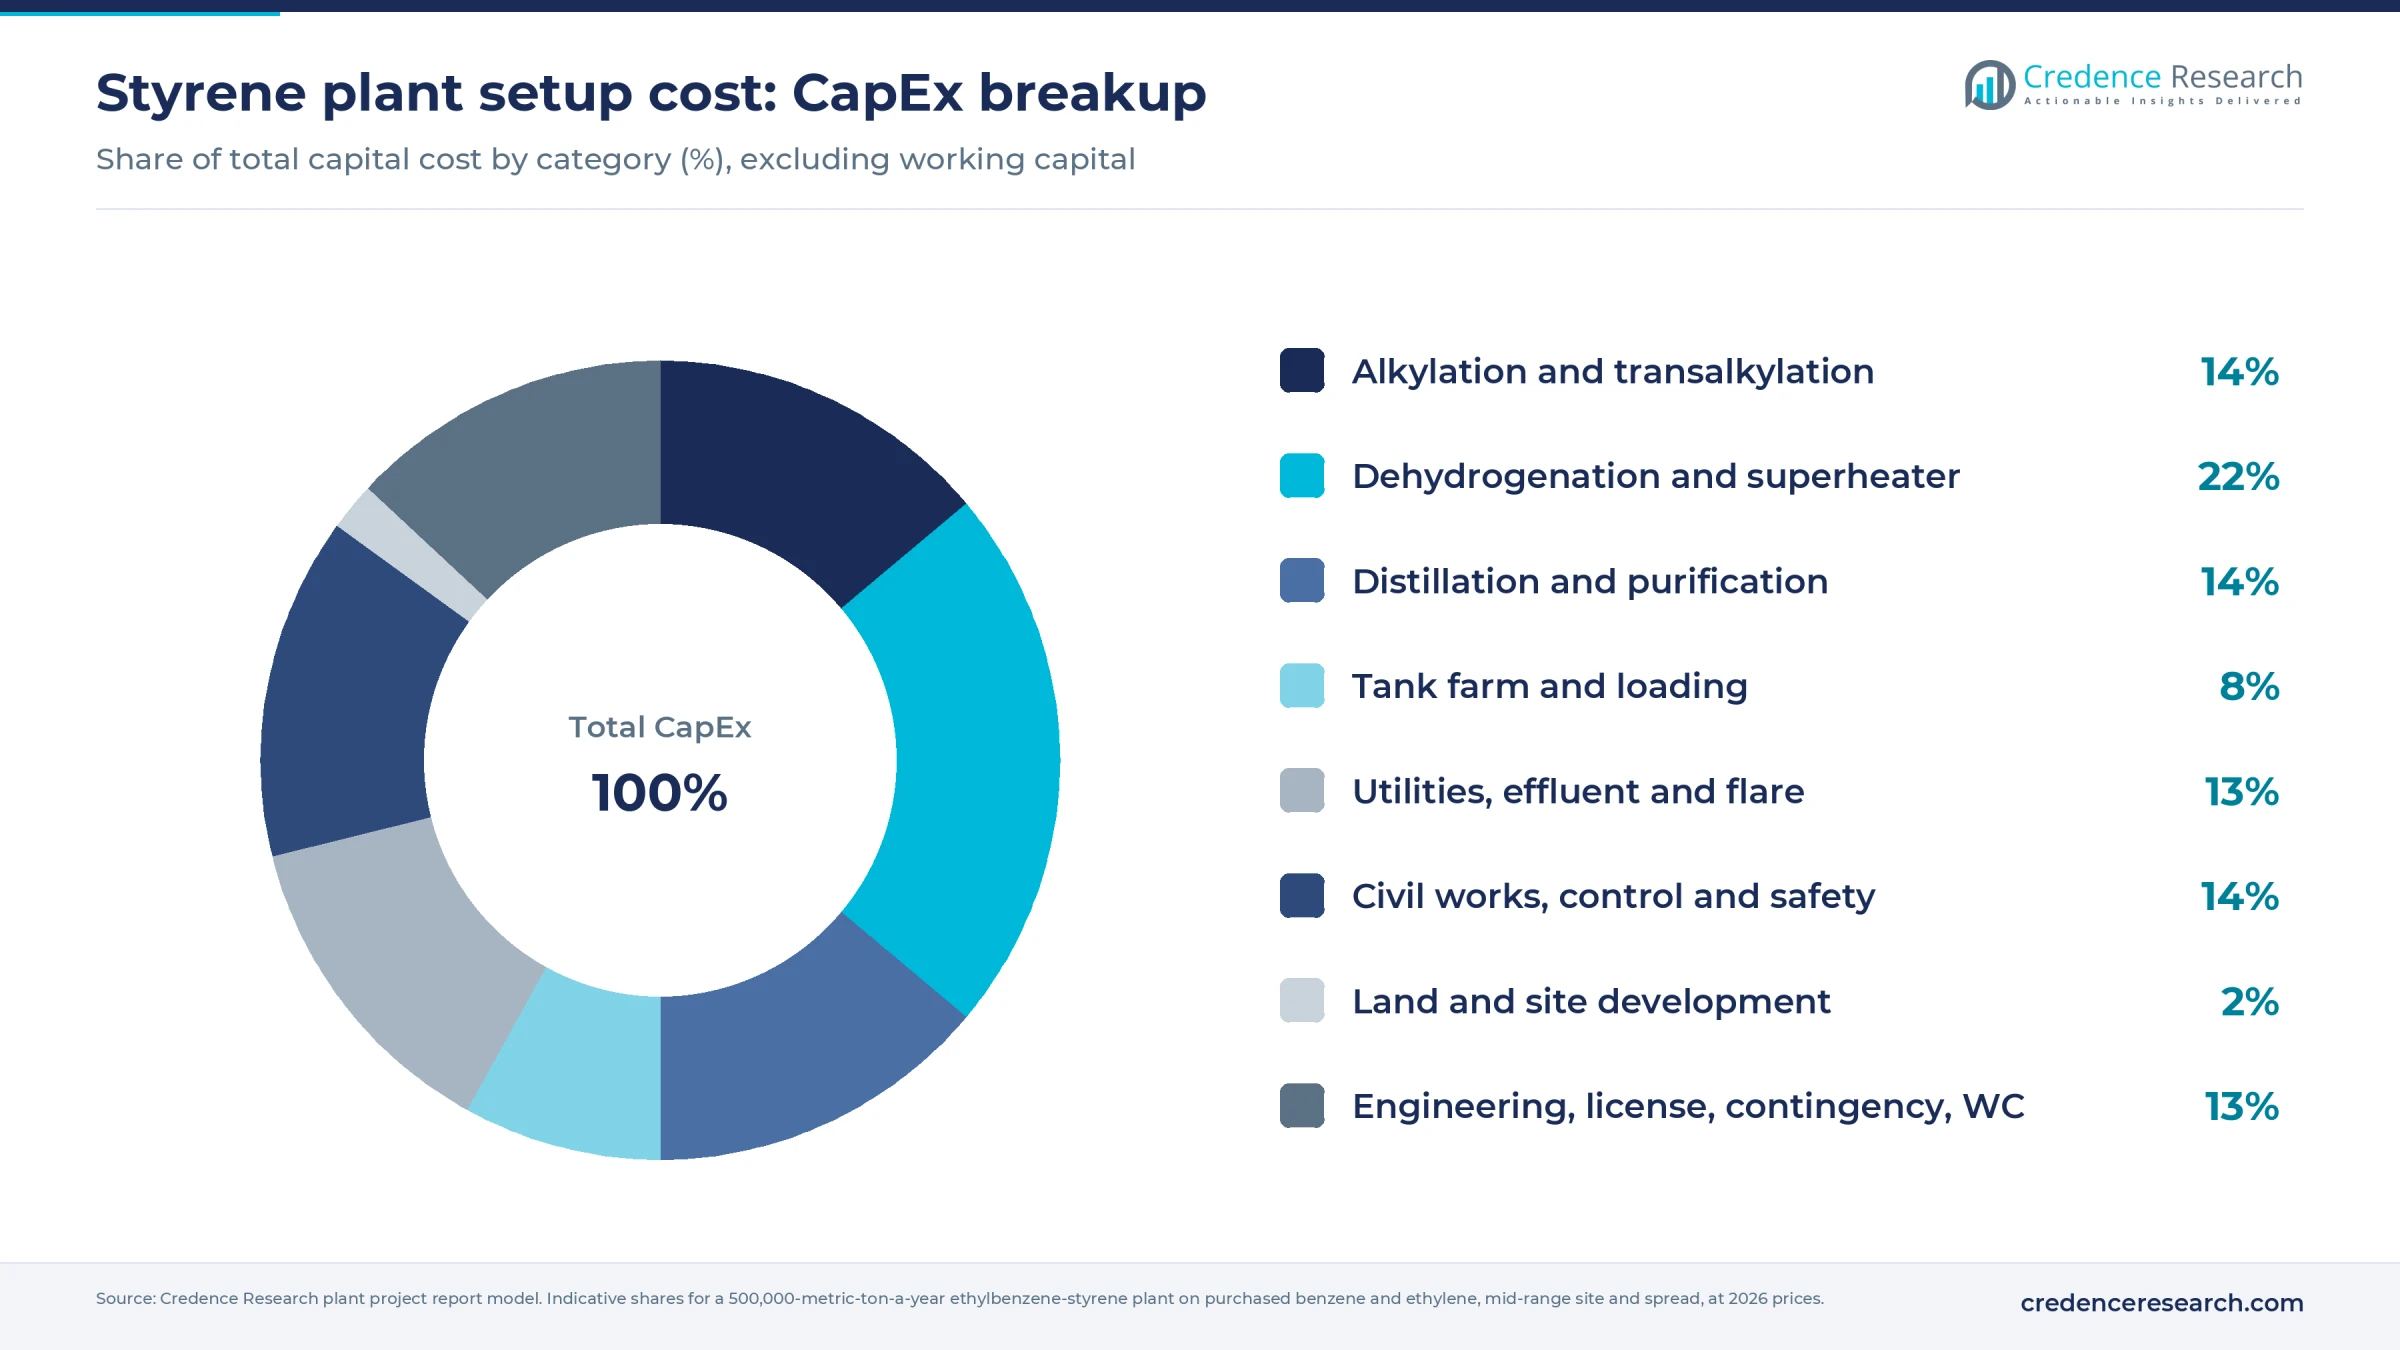
Dehydrogenation reactors, the steam superheater and heat recovery take about 22% of CapEx, and engineering, license fees, contingency and working capital about 13%.
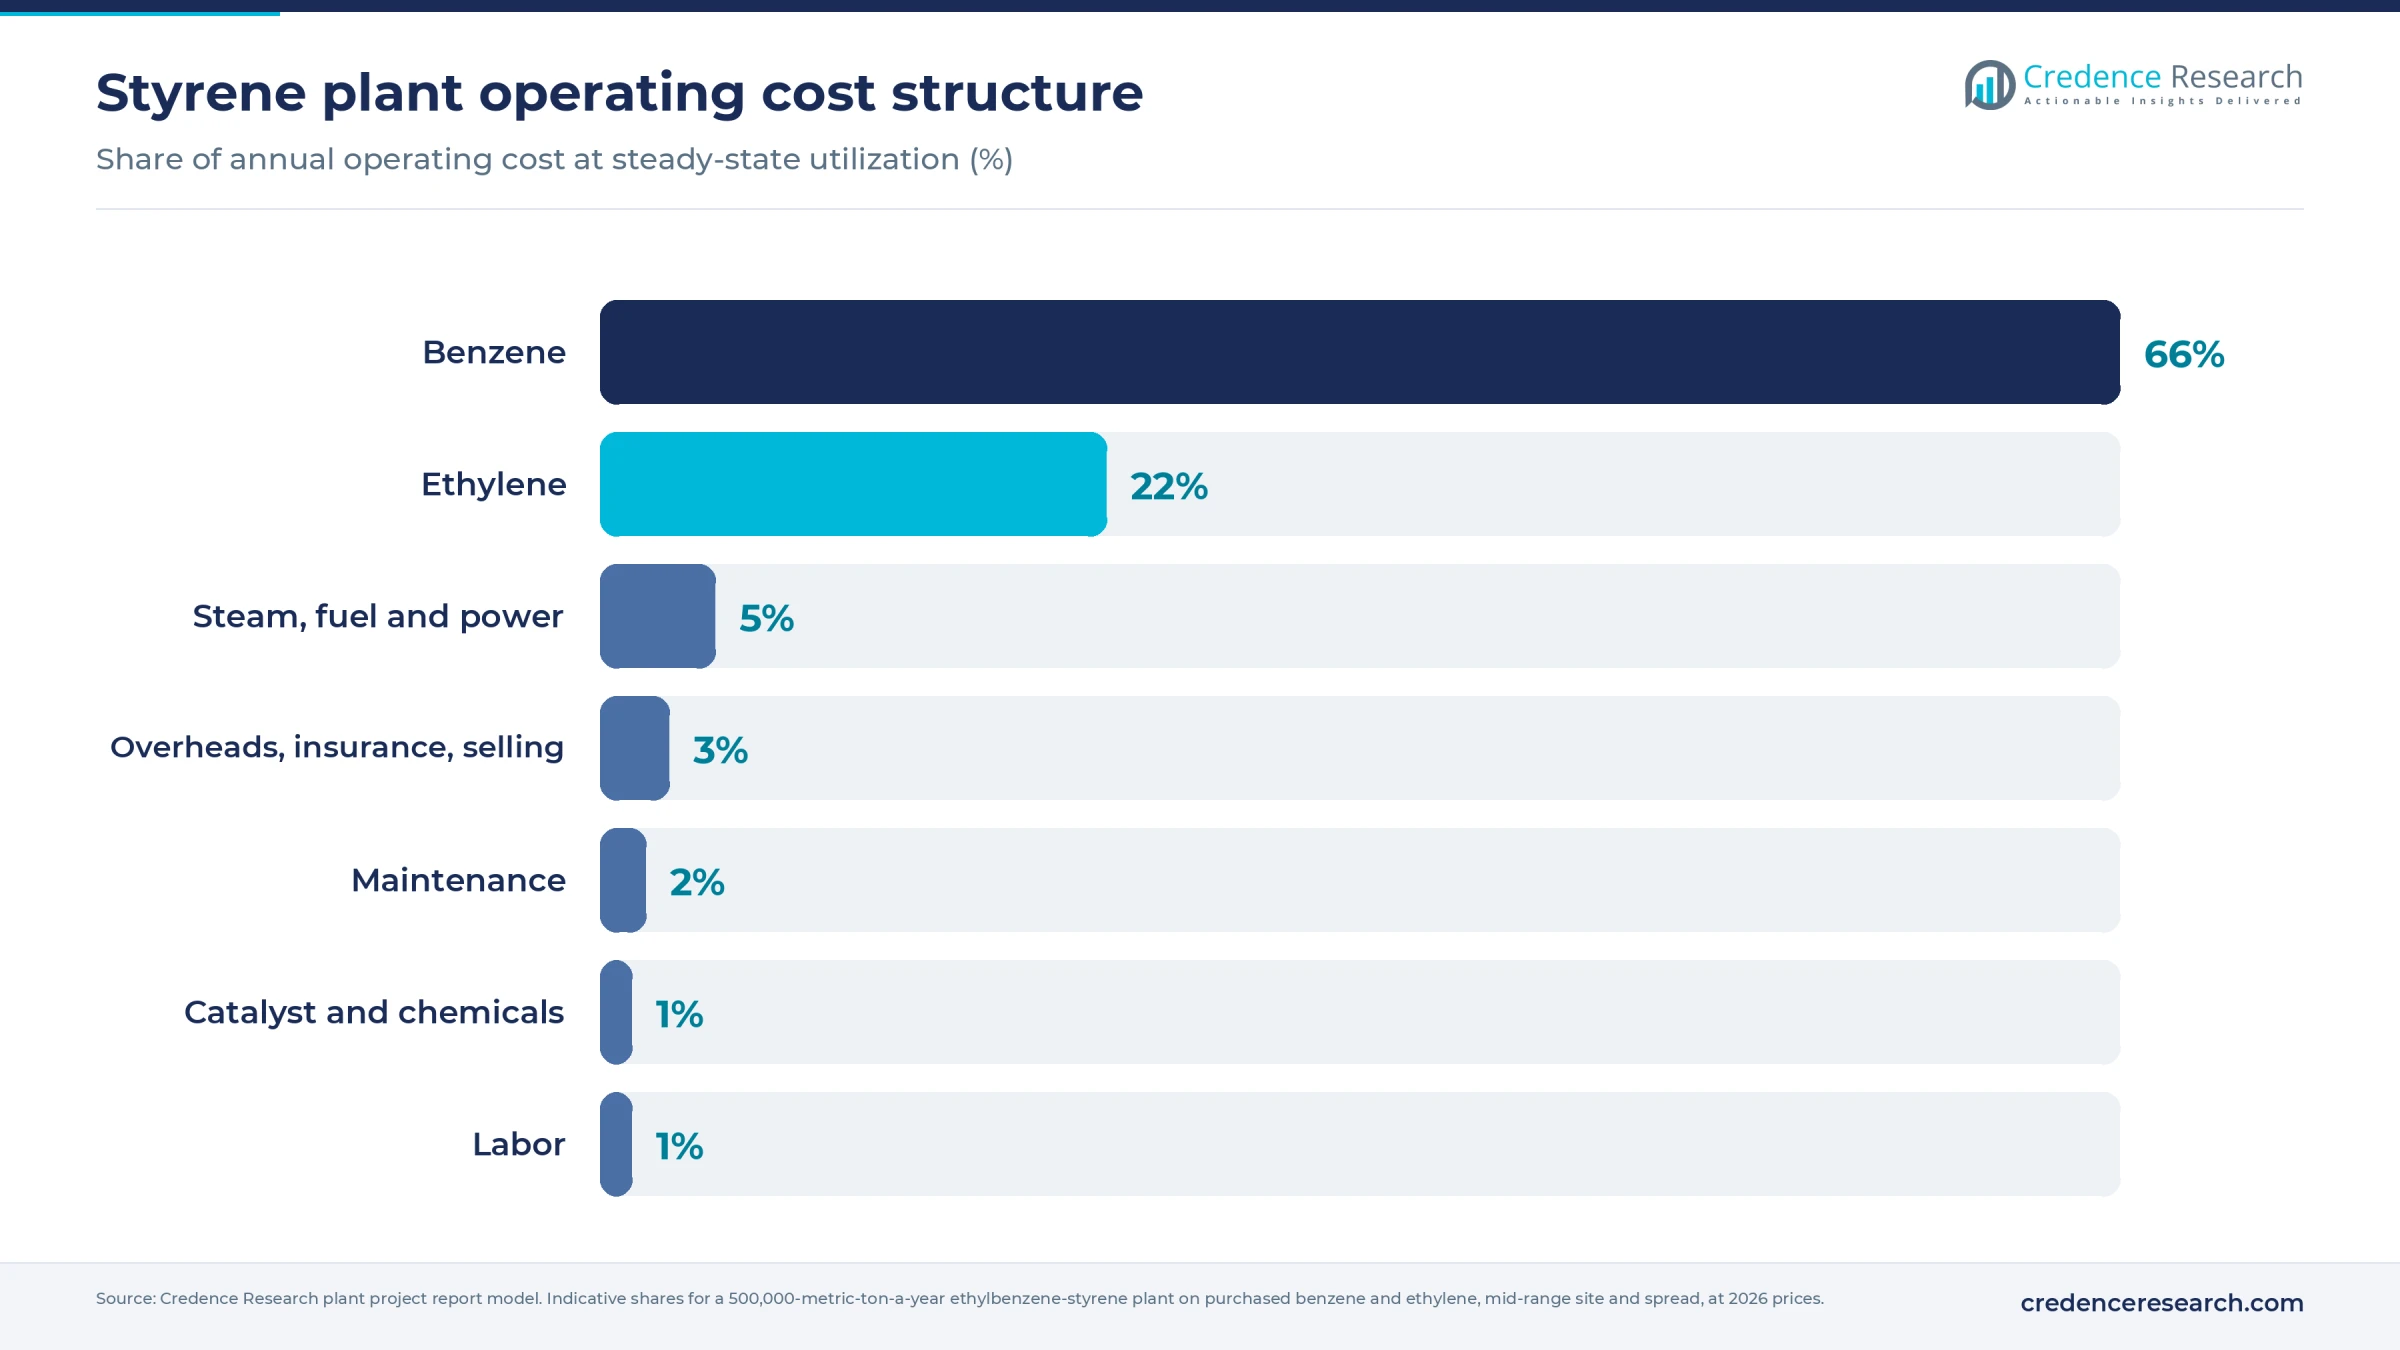
Benzene and ethylene together make up about 88% of operating cost in the central case, so feedstock contracts matter more than any equipment choice. The full report can be tailored to any country or region.
Machinery and raw materials for a styrene plant
The main equipment groups are listed below; capacities and the full schedule are in the report.
- Benzene tanks, an ethylene receiving station or refrigerated storage, feed driers and guard beds
- Zeolite alkylation and transalkylation reactors with feed and recycle pumps
- Benzene, ethylbenzene and polyethylbenzene distillation columns with reboilers
- Fired steam superheater, radial-flow dehydrogenation reactors, feed-effluent exchangers and waste heat boilers
- Effluent condensers, a three-phase separator, vent gas compressor and vacuum system
- Vacuum finishing columns, an inhibitor dosing skid and cooled product tanks with loading arms
- Process water stripper, boiler, cooling towers, flare, nitrogen, laboratory, distributed control and safety instrumented systems
At 90% utilization the plant needs about 353,000 tons of benzene and 128,000 tons of ethylene a year, at assumed consumption of 0.785 and 0.285 tons per ton of product. Benzene is widely traded, and Comtrade lists South Korea as the largest exporter in 2025, at about 3 million tons near USD 761 per ton, with Japan, Brunei, Thailand, India and the Netherlands also shipping. Ethylene is harder to buy, since ocean trade needs refrigerated carriers and terminals, so most plants sit beside a cracker. Ethane-based ethylene from the U.S. Gulf Coast and the Middle East is the cheapest. A merchant ethylbenzene supply market also exists, which helps a plant ride out alkylation outages.
Styrene business profit margin and ROI
Gross margin is estimated at 2–16%, measured as the styrene price minus benzene, ethylene and net conversion cost, as a share of price. The weak case uses Asian market prices: product at USD 975 per ton, India's 2025 import unit value, with benzene at an assumed USD 800 and ethylene at an assumed USD 860 delivered, close to Korean export and Chinese import values. After an assumed USD 80 per ton of conversion cost net of by-product credits, that leaves about USD 22 per ton, or 2%. The strong case reflects a U.S. Gulf or Middle East site with ethylene at an assumed USD 620, product at USD 1,042, the 2025 U.S. export unit value, and net conversion of USD 70, for about 16%.
At 90% utilization, or 450,000 tons, central-case revenue is about USD 455 million. Annual cash profit after an assumed USD 8–10 million of overheads is about USD 34 million in the central case and USD 67 million in the strong case, putting payback at about 10–20 years on mid-range CapEx of USD 700 million. At weak 2025 Asian spreads the plant does not earn back its capital. Taiwan styrene Monomer reported an average spread of about USD 86 per ton over four years, against processing costs of USD 140–154, before deciding to stop production.
The spread is the key sensitivity. Each USD 10 per ton change moves annual gross profit by about USD 4.5 million.
| Indicator | Result |
|---|---|
| Gross margin | 2–16% |
| Payback period | 10–20 years |
| Post-tax IRR | Available in report |
| Net present value | Available in report |
| Return on investment | Available in report |
| Debt service coverage | Available in report |
| Break-even capacity use | Available in report |
How to start a styrene business, licenses and approvals
Approvals follow a common sequence: company and tax registration, zoning in an area cleared for heavy petrochemicals, an environmental impact assessment, air and wastewater permits covering benzene and styrene emissions, fire protection for flammable liquid and gas storage, process safety and major accident plans, worker exposure monitoring, chemical registration and import registration for feedstock. Benzene is a known human carcinogen, so closed sampling, leak detection and repair, and medical surveillance are built into the design.
| Market | Key approvals for a styrene plant |
|---|---|
| United States | State Clean Air Act construction and Title V operating permits under the EPA hazardous organic NESHAP for synthetic organic chemical manufacturing, 40 CFR Part 63 Subparts F, G and H; OSHA process safety management, 29 CFR 1910.119, and the OSHA benzene standard, 29 CFR 1910.1028, with a 1 ppm eight-hour limit; an EPA risk management program for ethylene; Toxics Release Inventory reporting |
| European Union | Integrated permit under the Industrial Emissions Directive, applying best available techniques for large volume organic chemicals; Seveso III screening of benzene, ethylene and styrene inventories; REACH registration and CLP labeling; a benzene binding exposure limit of 0.2 ppm from April 2026 under the Carcinogens, Mutagens and Reprotoxic Substances Directive; EU Emissions Trading System coverage with a styrene product benchmark |
| India | Environmental clearance under the EIA Notification 2006 as a petrochemical project; consent to establish and operate from the state pollution control board; PESO licenses for benzene and styrene storage under the Petroleum Rules 2002 and for ethylene under the Static and Mobile Pressure Vessels (Unfired) Rules 2016; factory license and on-site emergency plan under the MSIHC Rules 1989 |
The impact assessment and the tank farm layout usually set the timeline, since regulators review fire spacing, vapor controls and emergency plans.
Key styrene manufacturers and recent developments
Sinopec and PetroChina run the largest fleets, alongside refinery-integrated groups such as Zhejiang Petroleum & Chemical. SABIC and The Kuwait styrene Co. lead Middle East exports, while Shell and LyondellBasell co-produce the monomer with propylene oxide in the U.S. and Europe. AmSty, INEOS Styrolution, Formosa Chemicals & Fibre, LG Chem, Hanwha TotalEnergies and Idemitsu Kosan serve regional markets, many of them feeding their own polystyrene lines, ABS or rubber plants.
- March 2026: ECHEM completed front-end engineering for a 300,000-ton plant in Alexandria, Egypt, with a stated cost of USD 500 million and contractor tendering next.
- March 2026: Formosa Chemicals & Fibre declared force majeure that threatened styrene and other petrochemical supply from April, after disruption to shipping through the Strait of Hormuz.
- July 2026: Taiwan styrene Monomer's board approved halting its 350,000-ton plant in Kaohsiung after four straight years of losses, with production ending in October 2026.
Integrated sites with cheap ethylene keep running, while stand-alone plants in mature markets keep closing.
What's inside the Styrene project report PDF
The report runs to 21 chapters. Open a chapter to see its sections.
1. Preface
2. Scope and Methodology
- 2.1 Objectives of the Study
- 2.2 Stakeholders
- 2.3 Research Methodology
- 2.4 Data Sources and Key Assumptions
3. Executive Summary
- 3.1 Market Snapshot
- 3.2 Project at a Glance (Capacity, CapEx, OpEx)
- 3.3 Key Financial Indicators (IRR, NPV, Payback, Break-even)
- 3.4 Feasibility Verdict
4. Product Overview
- 4.1 Styrene Definition and Properties
- 4.2 Grades and Specifications (BIS / ISO / ASTM)
- 4.3 HS Code and Classification
- 4.4 Key Applications
- 4.5 Substitutes
5. Global Styrene Market
- 5.1 Market Overview
- 5.2 Historical and Current Market Performance (Volume and Value)
- 5.3 Market Breakup by Grade / Type
- 5.4 Market Breakup by End-Use Industry
- 5.5 Market Breakup by Region
- 5.6 Market Drivers, Restraints and Trends
- 5.7 Value Chain Analysis
- 5.8 Market Forecast
6. Target Country Styrene Market Analysis
- 6.1 Demand and Supply Analysis
- 6.2 Installed Capacity vs Demand Gap
- 6.3 Import Dependence
- 6.4 Demand Forecast by End-Use
7. Trade Analysis
- 7.1 Imports by Volume, Value and Country
- 7.2 Exports by Volume, Value and Country
- 7.3 Trade Balance and Opportunities
8. Price Analysis
- 8.1 Historical Styrene Price Trends by Region
- 8.2 Raw Material / Feedstock Price Trends and Linkage
- 8.3 Price Forecast
- 8.4 Margins Across the Value Chain
9. Competitive Landscape
- 9.1 Market Structure
- 9.2 Key Players and Installed Capacities
- 9.3 Profiles of Key Players
- 9.4 Recent Developments (Expansions, M&A, New Plants)
10. Manufacturing Process and Technology
- 10.1 Comparison of Technology Routes
- 10.2 Selected Route and Process Flow Diagram
- 10.3 Unit Operations Involved
- 10.4 Chemical Reactions Involved
- 10.5 Mass Balance and Raw Material Requirements
- 10.6 Energy Balance
- 10.7 Quality Assurance Criteria and Technical Tests
- 10.8 By-products and Waste Handling
- 10.9 Technology Licensors / Providers
11. Project Details, Requirements and Costs
- 11.1 Land, Location and Site Development
- 11.1.1 Site Selection Criteria
- 11.1.2 Location Analysis
- 11.1.3 Land Requirement and Costs
- 11.1.4 Site Development Costs
- 11.2 Plant Layout
- 11.2.1 Layout Principles
- 11.2.2 Proposed Layout
- 11.2.3 Factors Influencing Layout
- 11.3 Civil Works and Buildings
- 11.4 Plant Machinery
- 11.4.1 Machinery Requirements and Specifications
- 11.4.2 Machinery Costs
- 11.4.3 Machinery Suppliers
- 11.5 Raw Materials
- 11.5.1 Requirements per Tonne of Output
- 11.5.2 Procurement and Sourcing
- 11.5.3 Costs
- 11.5.4 Suppliers
- 11.6 Packaging
- 11.6.1 Packaging Requirements
- 11.6.2 Packaging Costs
- 11.6.3 Packaging Suppliers
- 11.7 Storage and Material Handling
- 11.8 Transportation Requirements and Costs
- 11.9 Utilities
- 11.9.1 Power Requirements and Costs
- 11.9.2 Water Requirements and Costs
- 11.9.3 Steam, Fuel and Other Utilities
- 11.10 Manpower Requirements and Wages
12. Environment, Health, Safety and Sustainability
- 12.1 Effluent and Emissions Management
- 12.2 Hazard Classification and Safety Measures
- 12.3 Carbon Footprint
- 12.4 Green / Low-Carbon Process Options
13. Regulatory Procedures, Approvals and Certifications
- 13.1 Licences and Registrations
- 13.2 Environmental Clearances
- 13.3 Product Certifications (BIS, REACH, etc.)
- 13.4 Approval Timeline
14. Project Implementation Schedule
15. Project Economics
- 15.1 Capital Cost of the Project
- 15.2 Techno-Economic Parameters
- 15.3 Capacity Utilization and Ramp-up
- 15.4 Product Pricing and Margins
- 15.5 Income Projections
- 15.6 Expenditure Projections
- 15.7 Working Capital Requirement
- 15.8 Taxation
- 15.9 Depreciation
16. Financial Analysis
- 16.1 Projected Profit and Loss Account
- 16.2 Projected Cash Flow Statement
- 16.3 Projected Balance Sheet
- 16.4 Liquidity Analysis
- 16.5 Profitability Analysis (Payback, NPV, IRR, ROI)
- 16.6 Break-even Analysis
- 16.7 Debt Service Coverage Ratio (DSCR)
- 16.8 Sensitivity Analysis
- 16.9 Scenario and Uncertainty Analysis
17. Funding and Incentives
- 17.1 Means of Finance and Debt-Equity Structure
- 17.2 Loans and Financial Assistance
- 17.3 Government Schemes and Subsidies (PLI, State Policies)
18. Risk Assessment
- 18.1 Key Success Factors
- 18.2 Key Risk Factors
- 18.3 Risk Mitigation
19. Strategic Recommendations
20. Case Study of a Successful Venture
21. Appendix
- 21.1 Detailed Assumptions
- 21.2 Abbreviations
- 21.3 List of Tables and Figures
- 21.4 Sources
This page vs. the full report
| Data point | On this page (free) | In the full report |
|---|---|---|
| Total CapEx | One rounded range at one capacity | Exact figure at three capacities with a line-item breakup |
| CapEx breakup | Category shares (%) only | Cost, quantity and supplier for every machine |
| Operating cost | Share of raw materials, utilities and labor | Per-unit cost sheet with each input price and consumption |
| Profitability | Gross margin range and payback band | Exact IRR, NPV, ROI, break-even and DSCR |
| Financial statements | List of what is included | 10-year P&L, cash flow, balance sheet and Excel model |
| Sensitivity | One directional line | Full sensitivity and scenario tables |
| Process | Simplified flow diagram | Detailed process flow, mass and energy balance, operating conditions |
| Machinery | Names of the main machines | Specifications, capacity, cost and supplier list |
| Market | Headline size, growth and global demand | Segment, region, trade and price forecast tables |
| Suppliers and buyers | Supplier types and sourcing hubs | Named suppliers and buyers |
Styrene project report: FAQs
How much does it cost to set up a styrene plant?
Is styrene manufacturing profitable?
What raw materials does a styrene plant need?
What is the HS code for styrene?
Which process is used to make styrene?
What licenses does a styrene plant need?
Why are styrene plants closing?

About the analyst
Nisha Gupta, Senior Research Analyst
Nisha Gupta is a Senior Research Analyst at Credence Research Inc. who works across industry domains, including packaging, automotive parts and machinery. Her focus is the modelling engine behind each study: she builds quantitative market databases and econometric forecasting frameworks, and developed automated Excel-based market modelling templates that cut client turnaround time by 30%.
Related market research
- Styrene Petrochemicals Market Size, Growth and Forecast 2032
- Ethylbenzene Market Size, Share, Growth and Forecast 2032
- Polystyrene Market Size, Growth, Share, Trends and Forecast 2032
- Acrylonitrile Butadiene Styrene Market Size, Growth and Forecast 2032
- Styrene Butadiene Rubber Market Size, Share and Forecast 2032
- Styrene Acrylonitrile Market Size, Share, Trend and Forecast 2032
More plant project reports
- Vinyl Chloride Manufacturing Plant Project Report (DPR) 2026
- Neopentyl Glycol Manufacturing Plant Project Report (DPR) 2026
- Citric Acid Manufacturing Plant Project Report (DPR) 2026
- Castor Oil Processing Plant Project Report (DPR) 2026
- Polyvinyl Chloride Manufacturing Plant Project Report (DPR) 2026
- Phosphoric Acid Manufacturing Plant Project Report (DPR) 2026