
Natural Tea Extract Market Overview:
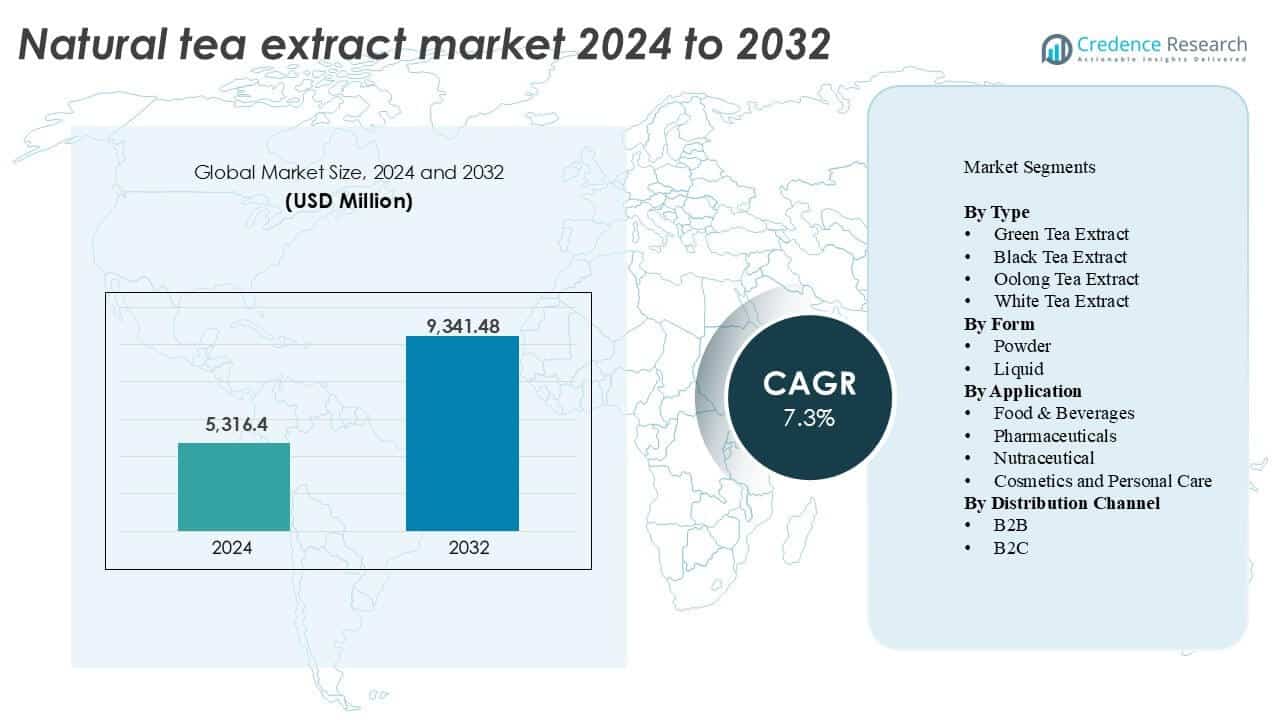
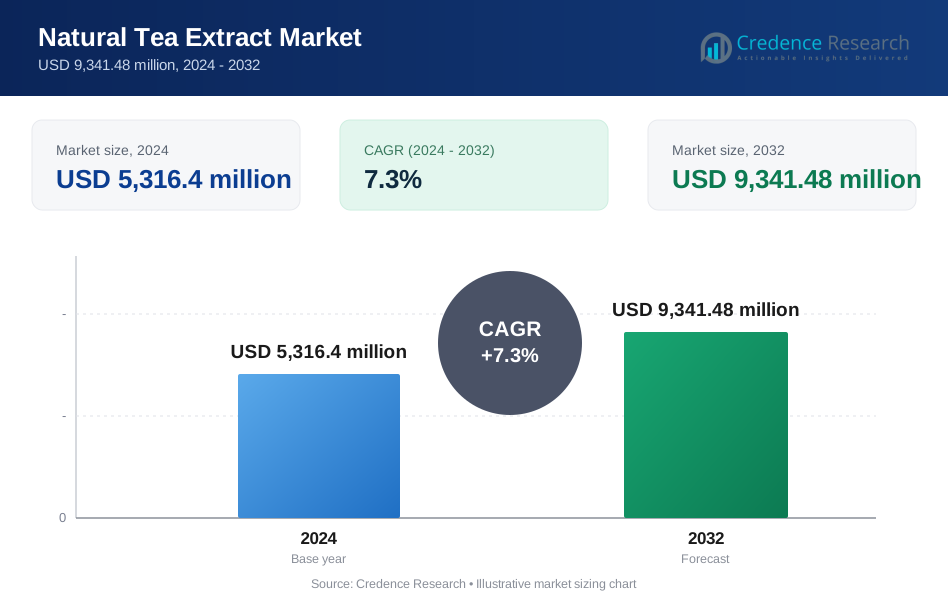
The Natural Tea Extract Market size was valued at USD 5,316.4 million in 2024 and is anticipated to reach USD 9,341.48 million by 2032, at a CAGR of 7.3% during the forecast period.
| REPORT ATTRIBUTE | DETAILS |
|---|---|
| Historical Period | 2020-2024 |
| Base Year | 2025 |
| Forecast Period | 2026-2032 |
| Natural Tea Extract Market Size 2024 | USD 5,316.4 million |
| Natural Tea Extract Market, CAGR | 7.3% |
| Natural Tea Extract Market Size 2032 | USD 9,341.48 million |
Natural Tea Extract Market Insights
- Growing consumer shift toward natural, plant-based ingredients in food, beverages, and supplements drives market expansion across health-conscious demographics.
- Rising demand for clean-label products and functional beverages fuels innovation in RTD tea drinks and nutraceutical formulations.
- Key players such as ADM, Givaudan, and Synthite Industries compete through advanced extraction technologies, product diversification, and global distribution networks.
- Asia-Pacific leads with over 35% market share, followed by North America at 25% and Europe at 22%; green tea extract dominates the type segment, accounting for the largest revenue share due to its antioxidant and metabolic health benefits.
Natural Tea Extract Market Segmentation Analysis:
By Type
Green tea extract held the largest market share in the natural tea extract market in 2024. Its dominance stems from strong demand in weight management, detox, and antioxidant-rich products. Green tea's rich polyphenol and catechin profile supports use in health supplements, functional drinks, and skincare. Rising awareness of its anti-inflammatory and cardiovascular benefits further fuels growth. Black tea extract followed due to its use in energy-boosting formulations. Oolong and white tea extracts remain niche but show potential in premium wellness and cosmetic applications targeting sensitive skin and mild stimulants.
- For instance, standard green tea extract powders are sold with up to 90 % polyphenols and up to 75 % catechins, providing high antioxidant potency for nutraceutical use.
By Form
Powder form led the market with a major share, supported by its extended shelf life, easy handling, and cost-effectiveness in bulk manufacturing. It is widely used in dry mixes, tablets, and capsules for nutraceutical and pharmaceutical applications. Powdered extracts also enable easy blending into functional beverages and food products. Liquid extracts gained traction in cosmetic and ready-to-drink formulations due to higher absorption and solubility. However, stability issues and refrigeration needs limit their widespread use compared to powder variants. Manufacturers prefer powder for large-scale processing efficiency and longer storage compatibility.
- For instance, products like PureBulk Green Tea Extract Powder or VedaOils Green Tea Extract Powder deliver concentrated polyphenols in dry form for easy blending into supplements.
By Application
Food & beverages emerged as the leading application segment, accounting for the largest market share. This segment benefits from strong consumer preference for natural and plant-based ingredients in teas, juices, energy drinks, and flavored water. Green and black tea extracts are frequently used for their flavor profile and health appeal. Nutraceuticals followed closely, driven by demand for herbal supplements promoting weight loss, immunity, and anti-aging. Pharmaceutical applications remain steady in formulations supporting cardiovascular and metabolic health. The cosmetics and personal care segment gains ground with tea extracts used in anti-aging, soothing, and antioxidant-rich skincare.
Key Growth Drivers
Rising Consumer Focus on Natural and Functional Ingredients
The global shift toward clean-label and plant-based ingredients strongly supports the growth of the natural tea extract market. Consumers increasingly seek products that deliver both flavor and health benefits without synthetic additives. Tea extracts—especially green and black varieties—are rich in antioxidants, polyphenols, and catechins that promote weight loss, detox, and heart health. Their inclusion in ready-to-drink beverages, supplements, and wellness products boosts consumer appeal. As awareness of chronic disease prevention grows, tea extracts find favor across multiple demographic groups. Health-conscious millennials and aging populations particularly drive demand for functional formulations featuring tea-based actives. This trend also aligns with regulatory pushes to reduce sugar and artificial additives in food and beverage products.
- For instance, Nestlé’s ready‑to‑drink green tea contains 220 mg of tea polyphenols per bottle for antioxidant support.
Expanding Applications in Nutraceuticals and Pharmaceuticals
Natural tea extracts are gaining traction in the nutraceutical and pharmaceutical industries due to their scientifically validated bioactive properties. Extracts like EGCG from green tea support metabolic health, cognitive function, and inflammation control. This makes them suitable for formulating capsules, tablets, powders, and functional gummies. Tea polyphenols are used in dietary supplements targeting cardiovascular health, immunity, and digestive wellness. In the pharmaceutical sector, tea extracts find use in developing herbal-based therapeutic compounds and adjunct therapies. Growing R&D investment in plant-derived actives by nutraceutical brands strengthens long-term adoption. The consumer demand for natural alternatives to synthetic drugs further propels tea extract inclusion in preventive health products.
- For instance, DSM’s nutraceutical capsule formulation uses 150 mg of green tea extract per unit for targeted wellness.
Surge in Demand from the Personal Care and Cosmetics Sector
Natural tea extracts have found increasing utility in the cosmetics and personal care industry. Their antioxidant, anti-inflammatory, and anti-aging properties make them highly suitable for skincare, haircare, and bath products. Green tea extract, in particular, helps reduce acne, calm irritated skin, and prevent signs of aging. The clean beauty movement supports demand for plant-based ingredients, with tea extracts featured in creams, masks, serums, and shampoos. Leading beauty brands incorporate white and oolong tea actives in formulations targeting sensitive and mature skin. Consumer preference for transparent, sustainable, and chemical-free ingredients continues to push cosmetic manufacturers to adopt tea-derived botanicals in premium product lines.
Key Trends & Opportunities
Growth of Functional Beverages and RTD Tea Infusions
The rise of functional beverages presents a major opportunity for tea extract applications. Consumers are moving beyond traditional soft drinks and increasingly turning to health-oriented drinks infused with botanical actives. Ready-to-drink (RTD) teas with green or black tea extracts deliver both hydration and wellness benefits, aligning with on-the-go lifestyles. Brands are launching formulations enriched with antioxidants, adaptogens, and immunity boosters, often supported by clean-label claims. Innovations such as cold-brew tea infusions, sparkling herbal teas, and nootropic tea drinks enhance consumer interest. The RTD format also helps overcome traditional taste bitterness associated with concentrated extracts. Strong demand for low-calorie, refreshing, and natural functional beverages expands the market potential across retail and convenience channels.
- For instance, brands like Pokka Ready-To-Drink Sencha Green Tea and Just Ice Tea Mango Green Tea deliver ready‑to‑drink green tea with natural extracts and minimal additives for on‑the‑go hydration and wellness.
Product Innovation through Advanced Extraction Technologies
Technological advancements in tea extract processing offer new growth avenues. Manufacturers are shifting from conventional methods to advanced techniques like supercritical CO₂ extraction, ultrasonic-assisted extraction, and membrane filtration. These methods improve purity, bioavailability, and consistency of active compounds while minimizing solvent use and thermal degradation. Enhanced extraction ensures preservation of catechins, theaflavins, and amino acids vital for both health and sensory functions. This unlocks new applications in precision nutrition, clinical-grade supplements, and high-end cosmetics. Innovations in microencapsulation and nanoemulsion also improve tea extract stability, taste masking, and controlled release in various formulations. Such processing innovations enable premium product positioning and open export opportunities for high-quality tea extracts.
Key Challenges
High Processing Costs and Quality Variability
The cost-intensive nature of tea extract production poses a major challenge to manufacturers. Ensuring consistent bioactive content requires careful raw material selection, controlled processing conditions, and advanced purification systems. Factors like leaf grade, harvest season, and storage conditions affect quality, leading to batch-to-batch variability. Advanced extraction techniques, while effective, raise capital and operating costs. This limits access for small and medium enterprises. Fluctuating raw tea prices and limited premium-grade supply from producing regions further complicate sourcing strategies. Meeting regulatory requirements for purity, residual solvents, and bioactivity also adds to operational burdens, particularly in pharmaceutical-grade or export-quality formulations.
Taste Profile and Solubility Constraints in Formulations
Despite health benefits, the strong bitterness and astringency of tea extracts limit their use in certain formulations, especially beverages and edibles. High concentrations of polyphenols often cause off-flavors that reduce palatability. Solubility issues also arise in water-based systems, affecting clarity and texture of drinks. While microencapsulation and emulsification techniques address some of these issues, they raise production complexity and cost. Inconsistent taste experiences can deter repeat purchases in consumer-facing products. Food and beverage manufacturers often need to add flavor maskers or sweeteners, which may conflict with clean-label positioning. These sensory challenges restrict the widespread use of tea extracts in mass-market formulations.
Regional Analysis
North America
North America accounted for a significant share of the natural tea extract market, driven by strong demand for health and wellness products. The U.S. leads the region, supported by high consumption of green tea supplements, functional beverages, and clean-label cosmetics. Nutraceutical companies in the U.S. increasingly use tea extracts for metabolic, immune, and cognitive health. Canada and Mexico show steady growth with rising adoption of natural ingredients in food and personal care. The region held over 25% of the global market share in 2024, supported by established health trends and the growing preference for plant-based alternatives.
Europe
Europe held a substantial market share of around 22% in 2024, with strong demand for herbal and botanical extracts in food, beverages, and cosmetics. Germany, France, and the U.K. lead the market due to mature wellness and organic product sectors. Green tea extract is widely used in dietary supplements, while white and black tea extracts are gaining traction in skincare. Regulatory support for clean-label and natural ingredient use strengthens regional adoption. European consumers prioritize traceability and quality, pushing manufacturers to invest in premium and sustainably sourced tea extract products across B2B and B2C segments.
Asia-Pacific
Asia-Pacific dominated the global natural tea extract market with over 35% market share in 2024, led by China, Japan, and India. The region benefits from a rich tea culture, strong local supply chains, and growing applications across food, nutraceuticals, and beauty. China is the largest producer and consumer of tea extracts, widely using them in traditional medicine and health foods. Japan’s innovation in functional drinks and skincare supports steady demand. India shows growth in ayurvedic and wellness products. The region’s expanding middle class and rising health awareness drive consistent growth in both domestic consumption and export opportunities.
Latin America
Latin America contributed a smaller yet growing share of around 8% in 2024. Brazil, Mexico, and Argentina are key markets with rising demand for herbal wellness products and functional foods. Tea extract use in dietary supplements, energy drinks, and weight management solutions is gaining traction. Consumers in urban areas are shifting towards healthier, natural ingredients in beverages and personal care. While infrastructure and production capabilities remain limited compared to Asia or North America, imports and local processing continue to grow. The market shows strong potential due to increasing awareness of plant-based solutions and regional health initiatives.
Middle East & Africa (MEA)
The Middle East & Africa region held approximately 5% market share in 2024, with growing interest in natural wellness and clean-label ingredients. South Africa and the GCC countries lead adoption, particularly in the food, beverage, and cosmetics sectors. Demand for green tea extract is rising in dietary and detox products. Herbal cosmetic trends also boost usage in skincare across premium segments. Limited local production leads to a high reliance on imports. However, increasing investments in food processing and wellness industries offer new opportunities for market expansion in the coming years, especially across urban centers and affluent populations.
Natural Tea Extract Market Segmentations:
By Type
- Green Tea Extract
- Black Tea Extract
- Oolong Tea Extract
- White Tea Extract
By Form
- Powder
- Liquid
By Application
- Food & Beverages
- Pharmaceuticals
- Nutraceutical
- Cosmetics and Personal Care
By Distribution Channel
- B2B
- B2C
By Geography
- North America
- U.S.
- Canada
- Mexico
- Europe
- Germany
- France
- U.K.
- Italy
- Spain
- Rest of Europe
- Asia Pacific
- China
- Japan
- India
- South Korea
- South-east Asia
- Rest of Asia Pacific
- Latin America
- Brazil
- Argentina
- Rest of Latin America
- Middle East & Africa
- GCC Countries
- South Africa
- Rest of the Middle East and Africa
Competitive Landscape
The natural tea extract market features a mix of global and regional players competing on product quality, application versatility, and supply chain efficiency. Companies such as Givaudan, ADM, and International Flavors & Fragrances Inc. lead in scale and R&D capabilities, focusing on expanding tea extract portfolios for food, beverages, and personal care sectors. Indian firms like Synthite Industries, Plant Lipids, and AVT emphasize cost-effective production and export-grade purity, catering to global nutraceutical and cosmetic clients. U.S.-based players including Kemin Industries and FutureCeuticals invest in extraction technologies that enhance bioactive concentration and shelf life. Firms like Finlays and Taiyo International provide customized formulations for functional drinks and supplements. European players such as Indena and The Nature Network focus on clinical validation and clean-label compliance. Strategic partnerships, product innovation, and regional expansion remain key focus areas as competition intensifies across B2B and consumer segments. Pricing pressure and sourcing consistency also influence market dynamics.
Key Player Analysis
- Finlays (UK)
- Taiyo International (US)
- Givaudan (Switzerland)
- Kemin Industries, Inc. (US)
- Indena S.p.A. (Italy)
- AVT (India)
- The Nature Network (Germany)
- Synthite Industries Ltd. (India)
- Synergy Flavors, Inc. (US)
- Plant Lipids (India)
- Karle Group of Companies (India)
- UMANG GLOBAL GROUP PVT. LTD. (India)
- VDF FutureCeuticals, Inc. (US)
- ADM (US)
- International Flavors & Fragrances Inc. (US)
Recent Developments
- In December 2024, Givaudan's (Switzerland) the Cultured Hub's cutting-edge biotech center in Switzerland offers state-of-the-art product development laboratories, fermentation, and scale-up capabilities, helping businesses launch sustainable food innovations more quickly. This innovation can drive opportunities in the tea extract market by facilitating efficient scaling of plant cell cultivation, enhancing extraction techniques, and promoting innovation in tea- based ingredients. The Hub's synergy-driven environment is capable of hastening market access, providing superior-quality, economically priced tea extract solutions.
- In June 2024, Taiyo International announced that Sunphenon TH30, a natural L-theanine product derived from green tea, will be available again starting June 2024. This product promotes mental relaxation and focus, which aligns with consumer interest in cognitive health.
- In July 2023, Finlays has announced the acquisition of tea and yerba mate extraction assets from Natural Instant Foods. This strategic move aims to enhance its research and development at the Saosa tea extraction facility in Kenya. With this acquisition, the facility will be able to achieve same-day extraction from fresh leaves, thus improving the production of premium tea extracts that are rich in bioactive compounds.
Report Coverage
The research report offers an in-depth analysis based on Type, Form, Application, Distribution Channel and Geography. It details leading market players, providing an overview of their business, product offerings, investments, revenue streams, and key applications. Additionally, the report includes insights into the competitive environment, SWOT analysis, current market trends, as well as the primary drivers and constraints. Furthermore, it discusses various factors that have driven market expansion in recent years. The report also explores market dynamics, regulatory scenarios, and technological advancements that are shaping the industry. It assesses the impact of external factors and global economic changes on market growth. Lastly, it provides strategic recommendations for new entrants and established companies to navigate the complexities of the market.
Future Outlook
- Green tea extract will continue leading due to high demand in supplements and skincare.
- Functional beverage innovation will expand tea extract applications in RTD and energy drinks.
- Nutraceutical companies will increase use of standardized tea actives for targeted health benefits.
- Clean-label and organic claims will become key differentiators in consumer product launches.
- Advanced extraction methods will improve purity, solubility, and taste profile of tea extracts.
- Asia-Pacific will retain dominance, driven by local sourcing, consumption, and export strength.
- Cosmetics firms will integrate tea actives into anti-aging, soothing, and antioxidant-rich formulations.
- B2C sales channels will grow through e-commerce and wellness-focused retail platforms.
- Sustainability and traceability will influence sourcing strategies and brand positioning.
- Collaborations between ingredient suppliers and CPG brands will shape product development pipelines.
Request a Free Sample
Fill in your details and we'll send you a free sample report.
- Sample data tables & charts
- Research methodology
Need a Custom Version of This Report?
Tailor the scope, geography, or segments to your exact requirements.
- Custom geography or segment scope
- Direct access to our analyst team
Frequently Asked Questions
What is the current market size for the Natural tea extract market, and what is its projected size in 2032?
At what Compound Annual Growth Rate is the Natural tea extract market projected to grow between 2024 and 2032?
Which Natural tea extract market segment held the largest share in 2024?
What are the primary factors fueling the growth of the Natural tea extract market?
Who are the leading companies in the Natural tea extract market?
Which region commanded the largest share of the Natural tea extract market in 2024?
Table of Content
Chapter 1. Report Introduction
- 1.1 Report Description & Purpose
- 1.1.1 Report Title & Market Definition
- 1.1.2 Unique Selling Propositions (USP) & Key Differentiators
- 1.1.3 Value Proposition for Stakeholders
- 1.2 Research Objectives
- 1.2.1 Market Sizing Objectives (Volume & Revenue)
- 1.2.2 Segmentation Objectives
- 1.2.3 Competitive Intelligence Objectives
- 1.2.4 Forecast & Scenario Objectives
- 1.3 Report Scope
- 1.3.1 Natural Tea Extract Scope – Types & Subtypes Covered
- 1.3.2 Geographic Scope – Regions & Countries Covered
- 1.3.3 Historical Period, Base Year & Forecast Period (2024; forecast to 2032)
- 1.3.4 Inclusions & Exclusions
- 1.4 HS Code & Classification Framework
- 1.5 Currency, Units & Pricing Basis
- 1.6 Target Stakeholders
- 1.7 Limitations & Assumptions
Chapter 2. Executive Summary
- 2.1 Global Natural Tea Extract Market Snapshot
- 2.1.1 Market Size – Historical (2024) & Forecast (2024-2032) (2024: USD 5,316.4 million → 2032: USD 9,341.48 million)
- 2.1.2 Volume & Revenue – Global Totals
- 2.1.3 Key Market Highlights – Top Five Facts
- 2.2 Natural Tea Extract Market Segmentation Snapshot
- 2.2.1 Market Split by Region – 2024 vs. 2032
- 2.3 Competitive Snapshot
- 2.3.1 Top 10 Players by Revenue Share – 2024
- 2.3.2 Top 10 Players by Volume Share – 2024
- 2.3.3 Recent Strategic Developments (18-Month Summary)
- 2.4 Key Investment Highlights & Strategic Conclusions
Chapter 3. Natural Tea Extract Market Dynamics & Industry Analysis
- 3.1 Market Overview & Context
- 3.1.1 Natural Tea Extract Market Position in the Broader Automotive Value Chain
- 3.1.2 OEM vs. Replacement Market Dynamics
- 3.1.3 Market Maturity & Development Stage by Region
- 3.2 Natural Tea Extract Market Drivers
- 3.3 Natural Tea Extract Market Restraints & Challenges
- 3.4 Natural Tea Extract Market Opportunities
- 3.5 Porter's Five Forces Analysis
- 3.5.1 Threat of New Entrants
- 3.5.2 Bargaining Power of Suppliers
- 3.5.3 Bargaining Power of Buyers
- 3.5.4 Threat of Substitutes
- 3.5.5 Competitive Rivalry – Intensity Assessment
- 3.6 Natural Tea Extract Value Chain Analysis
- 3.6.1 Upstream – Raw Material/Input Suppliers
- 3.6.1.1 Raw Material/Input 1
- 3.6.1.2 Raw Material/Input 2
- 3.6.1.3 Raw Material/Input 3
- 3.6.2 Midstream – Production/Manufacturing/Service Delivery
- 3.6.2.1 Production/Process Overview
- 3.6.2.2 Key Facility Locations & Capacity by Manufacturer
- 3.6.3 Downstream – Distribution & End Consumer
- 3.6.3.1 Primary Channel – B2B/OEM
- 3.6.3.2 Secondary Channels – Dealer, Retail, Online, Direct
- 3.6.4 Value Chain Profitability Analysis
- 3.6.1 Upstream – Raw Material/Input Suppliers
- 3.7 PESTEL Analysis
- 3.7.1 Political Factors
- 3.7.2 Economic Factors
- 3.7.3 Social Factors
- 3.7.4 Technological Factors
- 3.7.5 Environmental Factors
- 3.7.6 Legal Factors
- 3.8 Natural Tea Extract Supply Chain Analysis
- 3.8.1 Raw Material/Input Supply Risk Assessment
- 3.8.2 Manufacturing Concentration Risk (Geographic Exposure)
- 3.8.3 Trade Disruption Impact Analysis
- 3.9 Regulatory & Policy Landscape
Note: The regulatory and policy landscape section covers regulations based on their applicability to the market, Natural Tea Extract category, geography, and scope of the study. Only regulatory frameworks with a material impact on operations, compliance, trade, sustainability, or market access are analyzed in detail.
Chapter 4. Key Investment Pockets & Opportunity Analysis
- 4.1 Natural Tea Extract Market Attractiveness Analysis
- 4.1.1 By Region – Investment Attractiveness Matrix (Volume × CAGR)
- 4.2 Absolute Revenue Growth Opportunity
- 4.2.1 By Region – Absolute USD Growth Through 2032
- 4.3 Incremental Volume Opportunity
- 4.3.1 By Region – Incremental Volume Through 2032
- 4.3.2 Segment – Incremental Volume
- 4.4 Emerging Submarket Opportunity Deep Dive (Subject to Applicability)
- 4.5 Emerging Market Opportunity Scorecards
- 4.5.1 United States
- 4.5.2 Europe
- 4.5.3 Asia
- 4.5.4 Middle East & Africa
Note: Emerging Market Opportunity Scorecards will be included based on relevance and strategic importance. Regions listed are indicative and may vary depending on data availability and market dynamics.
Chapter 5. Natural Tea Extract Import-Export Analysis & Trade Flows
- 5.1 Global Trade Overview
- 5.1.1 Global Export Value by Country (2024)
- 5.1.2 Global Export Volume by Country (2024)
- 5.1.3 Global Import Value by Country (2024)
- 5.1.4 Global Import Volume by Country (2024)
- 5.1.5 Net Trade Balance by Country (2024)
- 5.2 Export Analysis – Segment
- 5.2.1 Type 1 (HS Code)
- 5.2.2 Type 2 (HS Code)
- 5.2.3 Type 3 (HS Code)
- 5.2.4 Type 4 (HS Code)
- 5.2.5 Type 5 (HS Code)
- 5.3 Import Analysis – Segment
- 5.3.1 Type 1 (HS Code)
- 5.3.2 Type 2 (HS Code)
- 5.3.3 Type 3 (HS Code)
- 5.3.4 Type 4 (HS Code)
- 5.3.5 Type 5 (HS Code)
- 5.4 Average Unit Trade Prices
- 5.4.1 Average Export Price – Segment & Country
- 5.4.2 Average Import Price – Segment & Source Country
- 5.4.3 Price Trends (2024)
- 5.5 Key Trade Route Analysis
- 5.5.1 Trade Route 1
- 5.5.2 Trade Route 2
- 5.5.3 Trade Route 3
- 5.5.4 Trade Route 4
- 5.5.5 Trade Route 5
- 5.6 Trade Policy Impact Assessment
- 5.6.1 US Anti-Dumping & Section 301 Tariffs
- 5.6.2 EU Customs Union Impact
- 5.6.3 Major Free Trade Agreements
- 5.6.4 USMCA Rules of Origin
Note: Trade policy analysis will be included only where relevant to the Natural Tea Extract market.
Chapter 6. Competitive Landscape & Company Benchmarking
- 6.1 Natural Tea Extract Market Concentration & Structure
- 6.1.1 Herfindahl-Hirschman Index (HHI) – vs. 2024
- 6.1.2 Tier 1, Tier 2 & Tier 3 Market Structure
- 6.1.3 Global, Regional & Local Player Dynamics
- 6.2 Natural Tea Extract Market Share Analysis – 2024
- 6.2.1 Global Revenue Share by Company
- 6.2.2 Global Volume Share by Company
- 6.2.3 Regional Revenue Share
- 6.2.4 Market Share Evolution ( vs. 2024)
- 6.2.5 OEM Segment Share by Company
- 6.2.6 Replacement Segment Share by Company
- 6.3 Production/Delivery Capacity & Facility Analysis
- 6.3.1 Global Installed Capacity
- 6.3.2 Capacity Utilization Rates
- 6.3.3 Production/Output Volume
- 6.3.4 Facility Locations & Capacity Map
- 6.3.5 Planned Capacity Additions
- 6.4 Natural Tea Extract Competitive Benchmarking Matrix
- 6.4.1 Revenue, Volume, CAGR & Profitability Comparison
- 6.4.2 Channel Revenue Mix
- 6.4.3 Geographic Revenue Exposure
- 6.4.4 R&D Intensity
- 6.4.5 Sustainability Maturity
- 6.5 Strategic Developments in Natural Tea Extract (Last 24 Months)
- 6.5.1 Mergers, Acquisitions & Divestments
- 6.5.2 New Natural Tea Extract Launches
- 6.5.3 Facility Expansions
- 6.5.4 Strategic Alliances, Joint Ventures & Partnerships
- 6.5.5 Distribution Expansion & Market Entry
- 6.5.6 Sustainability & ESG Initiatives
- 6.6 Competitive Strategy Mapping
- 6.6.1 Leader, Challenger, Follower & Niche Classification
- 6.6.2 Pricing Strategy Comparison
- 6.6.3 Channel Strategy Matrix
Note: Strategic developments are included based on their materiality and the availability of reliable information.
Chapter 7. Global Natural Tea Extract Market – By Distribution Channel
- 7.1 Segment Overview
- 7.1.1 Volume & Revenue Split by Channel (2024 & 2032)
- 7.1.2 Channel Mix Evolution (2024-2032)
Chapter 8. Regional Market Analysis – Global Overview
- 8.1 Global Regional Overview
- 8.1.1 Regional Volume Share
- 8.1.2 Regional Revenue Share
- 8.1.3 Regional Volume by Region
- 8.1.4 Regional Revenue by Region
- 8.1.5 Regional Forecast Through 2032
- 8.2 Cross-Regional Segment Analysis
- 8.2.1 By Distribution Channel
- 8.2.2 By Brand/Price Tier
Chapter 9. North America Natural Tea Extract Market
- 9.1 United States
- 9.2 Canada
- 9.3 Mexico
Chapter 10. Europe Natural Tea Extract Market
- 10.1 Germany
- 10.2 France
- 10.3 Italy
- 10.4 United Kingdom
- 10.5 Spain
- 10.6 Poland
- 10.7 Russia
- 10.8 Netherlands
- 10.9 Belgium
- 10.10 Sweden
- 10.11 Denmark
- 10.12 Norway
- 10.13 Rest of Europe
Chapter 11. Asia Pacific Natural Tea Extract Market
- 11.1 China
- 11.2 India
- 11.3 Japan
- 11.4 South Korea
- 11.5 Thailand
- 11.6 Indonesia
- 11.7 Vietnam
- 11.8 Malaysia
- 11.9 Australia
- 11.10 Rest of Asia Pacific
Chapter 12. Latin America Natural Tea Extract Market
- 12.1 Brazil
- 12.2 Argentina
- 12.3 Colombia
- 12.4 Chile
- 12.5 Rest of Latin America
Chapter 13. Middle East Natural Tea Extract Market
- 13.1 Saudi Arabia
- 13.2 United Arab Emirates
- 13.3 Turkey
- 13.4 Israel
- 13.5 Iran
- 13.6 Rest of the Middle East
Chapter 14. Africa Natural Tea Extract Market
- 14.1 South Africa
- 14.2 Egypt
- 14.3 Nigeria
- 14.4 Morocco
- 14.5 Rest of Africa
Chapter 15. Natural Tea Extract Company Profiles
- 15.1 [Company 01]
- 15.1.1 Company Overview
- 15.1.2 Key Management Personnel
- 15.1.3 Products & Services Portfolio
- 15.1.4 Financial Performance
- 15.1.5 Key Market Focus & Geographic Presence
- 15.1.6 Recent Developments & Strategic Initiatives
Note: The company profile list is preliminary and may change based on research findings, market developments, data availability, and client requirements.
Chapter 16. Appendices
- Appendix A – List of Abbreviations & Acronyms
- Appendix B – Industry Classification Code Reference – Full Series
- Appendix C – Production & Capacity Data Tables
- Appendix D – End-Use & Demand Base Tables
- Appendix E – Consumption & Replacement Rate Assumptions
- Appendix F – ASP Reference Tables
- Appendix G – Manufacturing & Facility Database
- Appendix H – Import-Export Data Tables
- Appendix I – Regulatory Summary Tables
- Appendix J – Primary Research Participant List (Anonymized)
- Appendix K – Primary Research Questionnaire Framework
- Appendix L – Data Sources & Bibliography
- Appendix M – Market Size Divergence & Source Comparison
Chapter 17. Research Methodology
- 17.1 Research Framework & Philosophy
- 17.2 Secondary Research – Sources, Hierarchy & Data Extraction
- 17.3 Data Modeling – Bottom-Up & Top-Down Market Sizing
- 17.4 Primary Research – Stakeholder Framework, LOI & Sample Sizes
- 17.5 Forecast Methodology – Regression, Scenario & Sensitivity Analysis
- 17.6 Quality Control – Four-Layer Validation Framework
- 17.7 Limitations & Standard Assumptions
- 17.8 Disclaimer
