
Quick answer
A urea plant converts natural gas into ammonia, reacts the ammonia with captured carbon dioxide and finishes the melt as prills or granules carrying 46% nitrogen. A greenfield integrated complex making 3,500 metric tons of urea a day needs an estimated USD 1.6–2.8 billion of CapEx. Gas makes up about 55–65% of operating cost, so gross margin of 48–71% depends on gas contracts. Payback runs about 7–13 years at mid-range CapEx.
Viable where long-term gas below about USD 5 per million Btu and an export port or large farm market are secured, but the capital load makes it a project for well-funded sponsors, and high-cost European gas erodes most of the margin.
Urea plant: key highlights
| Parameter | Indicative value | Note |
|---|---|---|
| Plant capacity | 3,500 metric tons of urea per day | About 1.15 million tons a year over 330 days, with a captive ammonia unit of about 2,000 tons a day |
| Total CapEx | USD 1.6–2.8 billion | Greenfield; low end reflects a Middle East, Asian or Latin American site, top end a U.S. Gulf Coast or EU site |
| Raw material share of operating cost | 55–65% | Natural gas for feed and fuel at an assumed USD 4.00–5.50 per million Btu |
| Gross margin | 48–71% | Ex-works price minus gas and direct conversion cost; European gas prices cut it to about 20% |
| Payback period | 7–13 years | Mid-range CapEx of USD 2.1 billion; central case about 9 years; a low-cost Gulf site can approach 5 years |
| IRR | Available in report | Post-tax, 10-year model |
| Break-even | Available in report | Capacity utilization basis |
Ranges assume a 3,500-ton-a-day granular urea plant with a captive 2,000-ton-a-day ammonia unit on a greenfield site, Gulf, Asian or Latin American to U.S. or EU, 2026 prices, 90% utilization, an assumed ex-works price of USD 380–460 per ton, assumed gas at USD 4.00–5.50 per million Btu and 22–25 million Btu per ton of urea. CapEx is scaled with a 0.6 exponent from disclosed 2026 project costs. Customizable to any country.
What is urea?
Urea, chemical formula CO(NH2)2, is a white crystalline organic compound and the most concentrated solid nitrogen fertilizer in wide use, carrying 46% nitrogen by weight. Producers make it by reacting ammonia with carbon dioxide, which is why nearly every urea plant sits beside an ammonia unit that also supplies the CO2 from its gas reforming step.
Fertilizer urea is sold as prills of about 1–2 millimeters from a prilling tower or as harder granules of 2–4 millimeters from a fluid-bed granulator, which blend and spread better and suffer less dust. Technical urea with low biuret and metals content feeds urea formaldehyde resins for wood panels, melamine, and the 32.5% solution sold as diesel exhaust fluid for truck emission systems. Feed grade urea gives cattle non-protein nitrogen.
Urea, whether or not in aqueous solution, is classified under Harmonized System subheading 3102.10. Urea is the world's most traded nitrogen product and a price benchmark for the whole nitrogen chain.
Urea market overview and global demand
Urea output follows ammonia, its only nitrogen source. The U.S. Geological Survey estimates world ammonia production at about 160 million metric tons of contained nitrogen in 2025, up from 156 million in 2024. China produced about 49 million tons, followed by India and Russia at about 15 million each, the United States at 14 million, and Indonesia, Saudi Arabia, Iran, Egypt, Canada and Pakistan. In the United States, about 88% of ammonia went to fertilizer, and urea was the largest derivative by volume.
Trade is where most new plants earn their return. UN Comtrade data for HS 310210 show reported world imports of about USD 25.6 billion in 2025, up from USD 20.2 billion in 2024. India led at about USD 4.7 billion, followed by Brazil at USD 3.3 billion for 7.7 million tons, the United States at USD 2.2 billion for 5.2 million tons, and Australia, Thailand and Turkey. Among reporting exporters in 2025, China shipped 4.9 million tons as it eased export curbs, Saudi Arabia 4.3 million, Oman 3.5 million and Egypt 3.1 million. Russia, Qatar and Iran, also major sellers, did not report.
Prices swing on gas, Chinese export policy and shipping risk. The World Bank Pink Sheet urea benchmark, prilled urea free on board in the Middle East, averaged USD 338 per ton in 2024 and USD 423 in 2025. Disruption in the Strait of Hormuz pushed it to USD 857 in April 2026 before it eased to about USD 420 by October as Chinese supply returned. Demand growth is steadiest in South Asia, Brazil and Africa.
Urea manufacturing process
A world-scale urea complex has two linked plants. The ammonia unit turns natural gas, steam and air into ammonia and a pure CO2 stream, and the urea unit combines the two at high pressure. Most new capacity uses CO2 stripping or ammonia stripping technology from a handful of licensors, with fluid-bed granulation now preferred over prilling for export product.
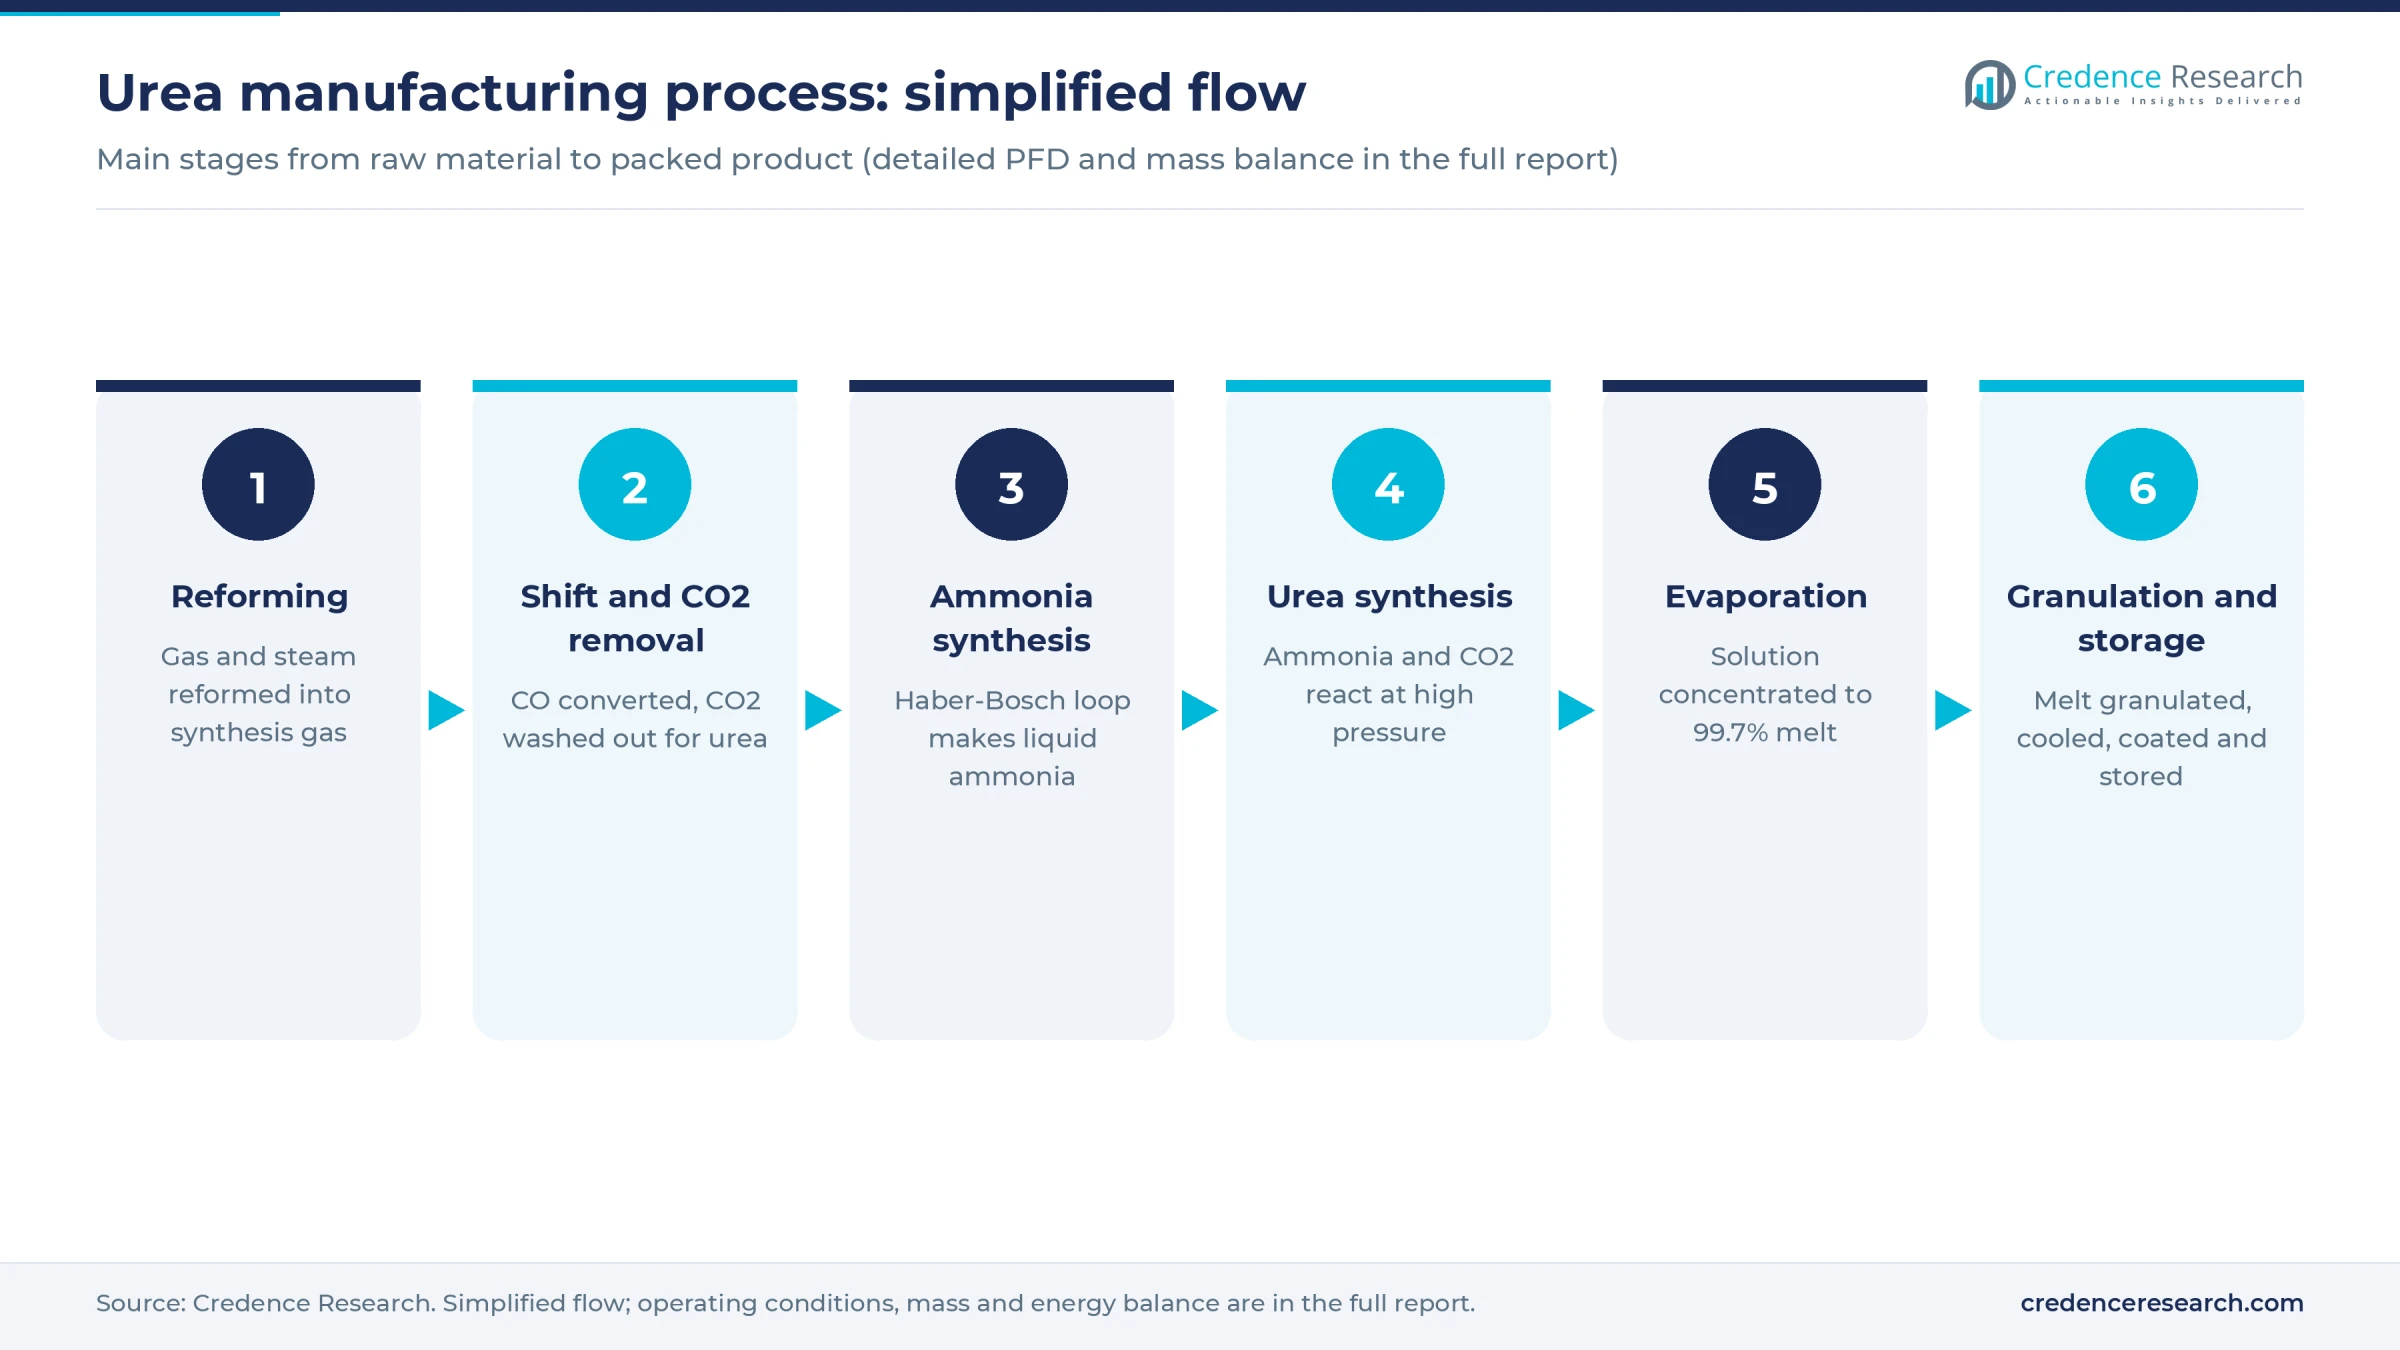
- Gas treatment and reforming. Natural gas is desulfurized, mixed with steam and reformed over nickel catalyst in a fired primary reformer and an air-blown secondary reformer, producing hydrogen, carbon monoxide and nitrogen.
- Shift and CO2 removal. Shift converters turn carbon monoxide into more hydrogen and CO2. An amine or carbonate wash strips the CO2, which is compressed for the urea plant, and a methanator removes trace oxides that would poison the synthesis catalyst.
- Ammonia synthesis. The hydrogen and nitrogen mix is compressed to roughly 130–200 bar and passed over iron catalyst in the Haber-Bosch loop. Refrigeration condenses liquid ammonia for the urea plant and buffer storage.
- Urea synthesis. Ammonia and CO2 react at about 140–160 bar and 180–190 degrees Celsius to form ammonium carbamate, which dehydrates to urea. A stripper and high-pressure condenser recycle unreacted gases, so conversion per pass and steam use set efficiency.
- Recirculation and evaporation. Low-pressure decomposers recover the remaining carbamate, and vacuum evaporators concentrate the solution to a melt of about 99.7% urea, holding temperature and residence time down to limit biuret.
- Finishing and storage. The melt is sprayed into a fluid-bed granulator or a prilling tower, cooled, screened and treated with an anti-caking agent, then stored in bulk sheds for ship, rail or bagged dispatch.
Each ton of urea uses about 0.57 ton of ammonia and 0.74 ton of CO2. Process condensate is hydrolyzed and stripped for reuse as boiler water.
Urea plant setup cost
The reference complex produces 3,500 metric tons of granular urea a day, about 1.15 million tons a year over 330 days, from a single ammonia train of about 2,000 tons a day. Total CapEx is estimated at USD 1.6–2.8 billion, covering land, both process units, granulation, power and steam generation, water treatment, bulk storage, a rail or port link, preoperative costs and a working capital margin.
The range is built from three disclosed 2026 projects. Pampa Energía approved a USD 2.7 billion complex for 2.1 million tons a year of granular urea at Bahía Blanca, Argentina, in July 2026. Scaled to 1.15 million tons with a 0.6 exponent, it implies about USD 1.9 billion. SABIC Agri-Nutrients' USD 3.47 billion Jubail project for 2.6 million tons scales to about USD 2.1 billion, and Fermaca's USD 1.5 billion plant for about 1 million tons in Durango, Mexico, scales to about USD 1.6 billion. A U.S. Gulf Coast or EU site is assumed to cost 1.3 times the Latin American and Gulf base, which lifts the top of the range to about USD 2.8 billion.
For the land row, the complex needs about 50 hectares for process blocks, ammonia tanks, product sheds and utilities. At an assumed USD 10–60 per square meter, from an Asian or Gulf industrial zone to a U.S. or EU chemical park, land costs USD 5–30 million, about 1% of CapEx at the midpoint.
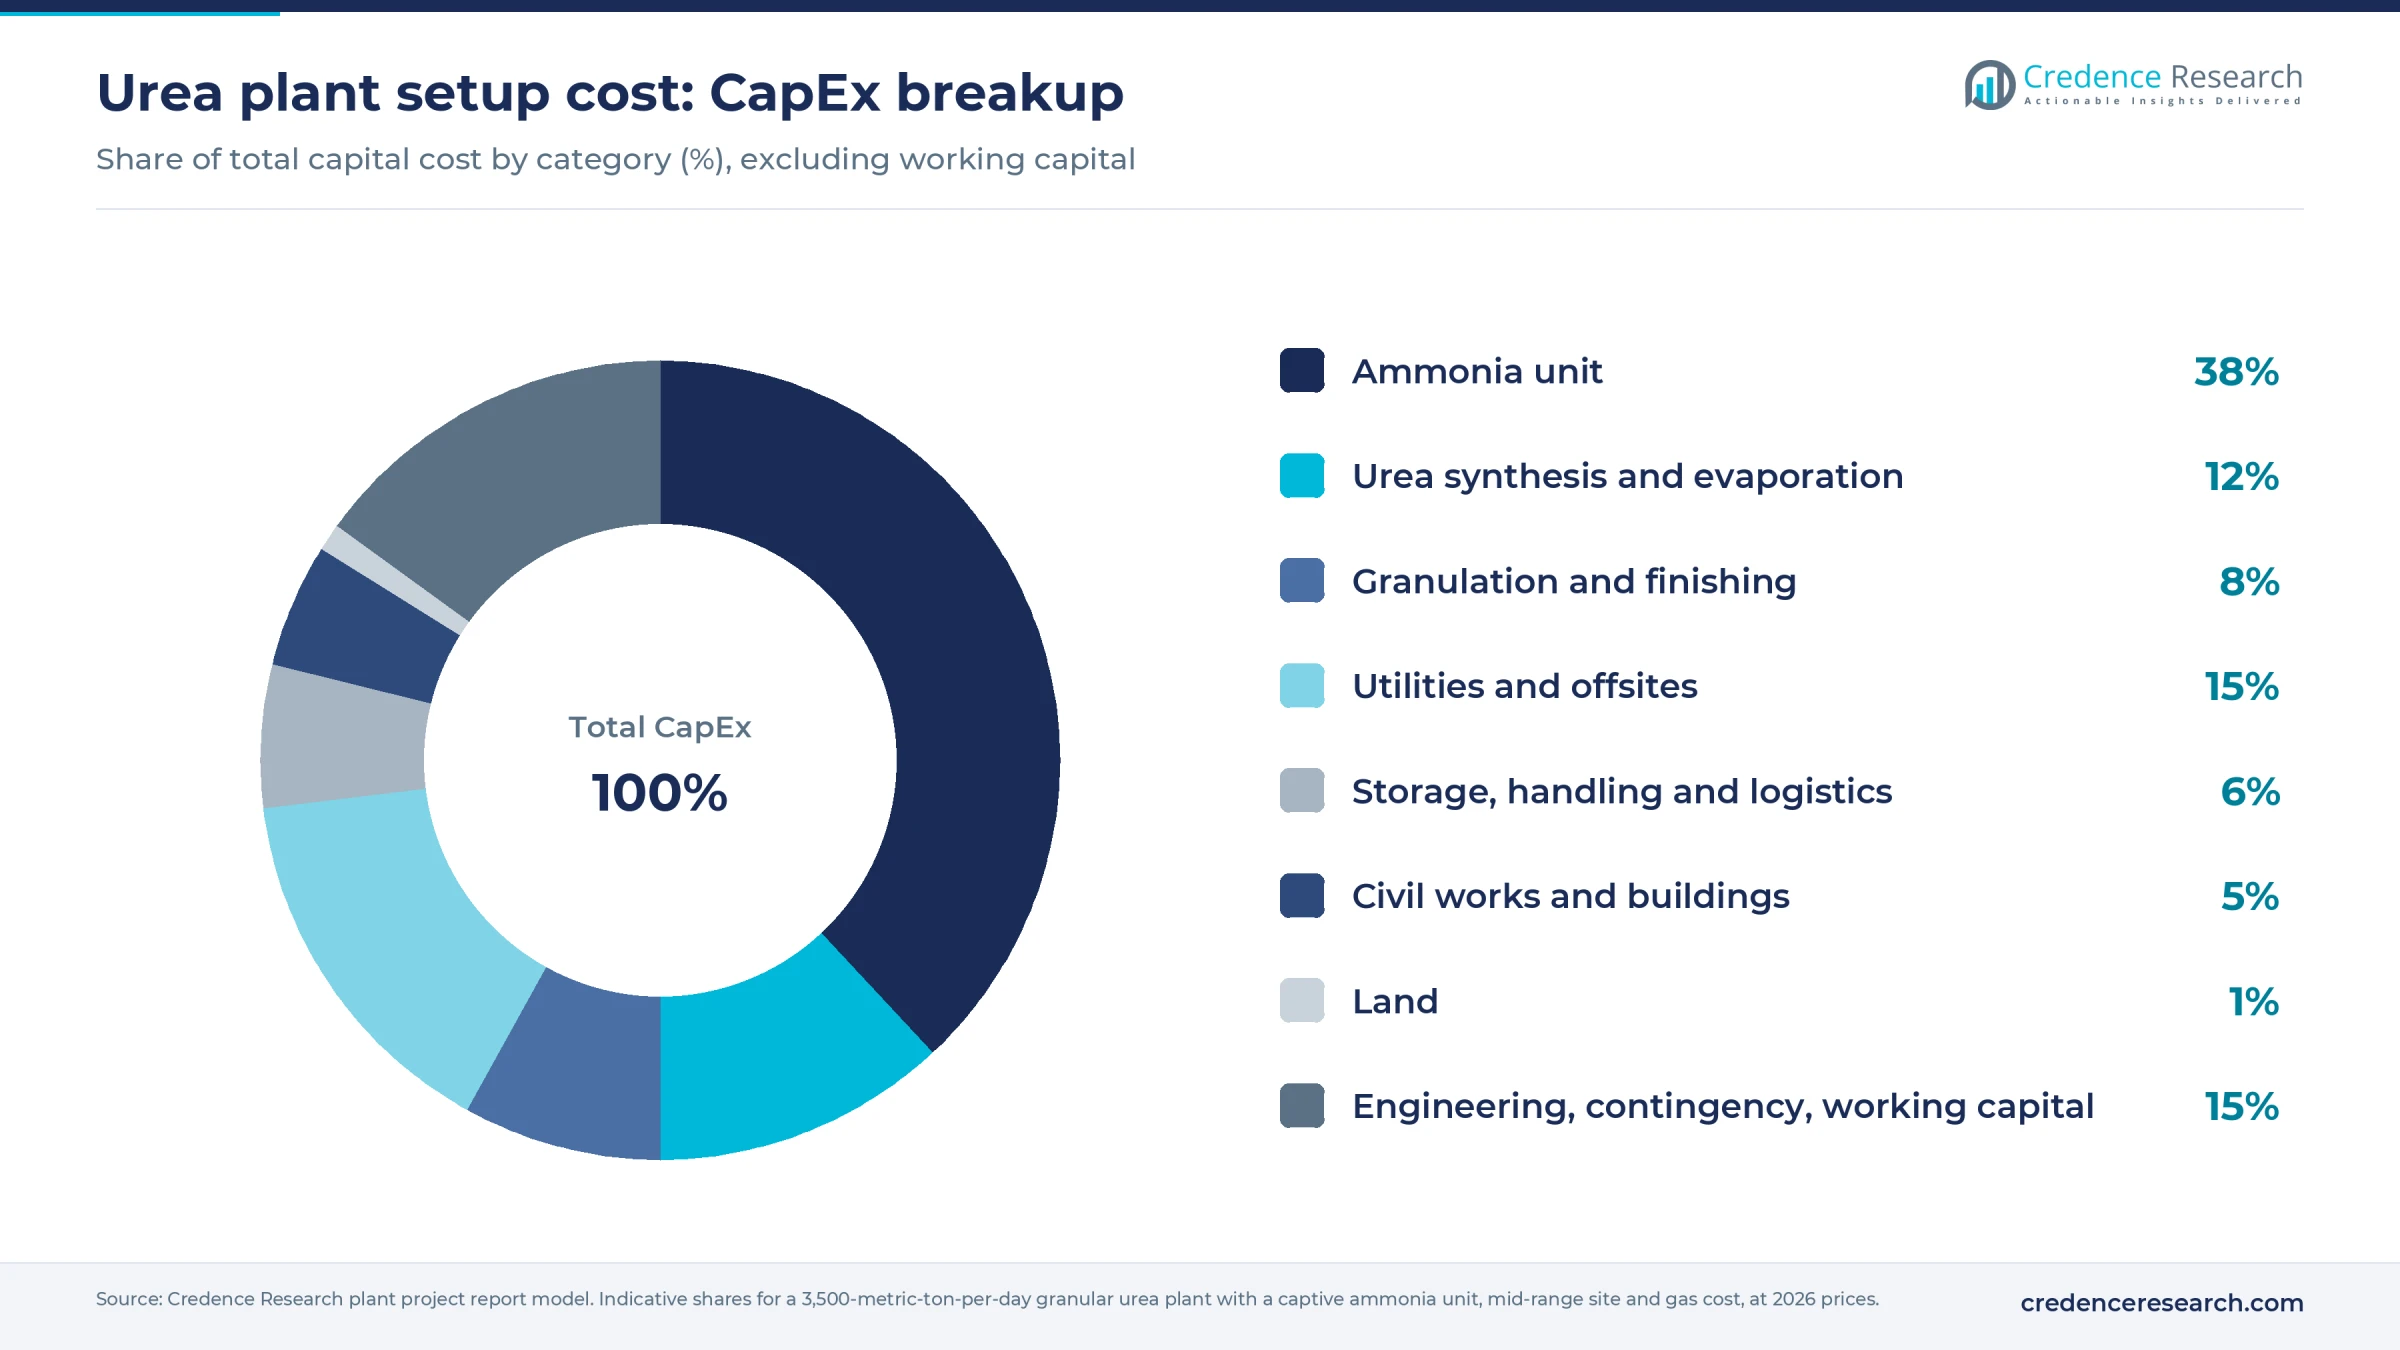
The ammonia unit takes about 38% of CapEx and utilities and offsites about 15%. Running cost is dominated by one input.
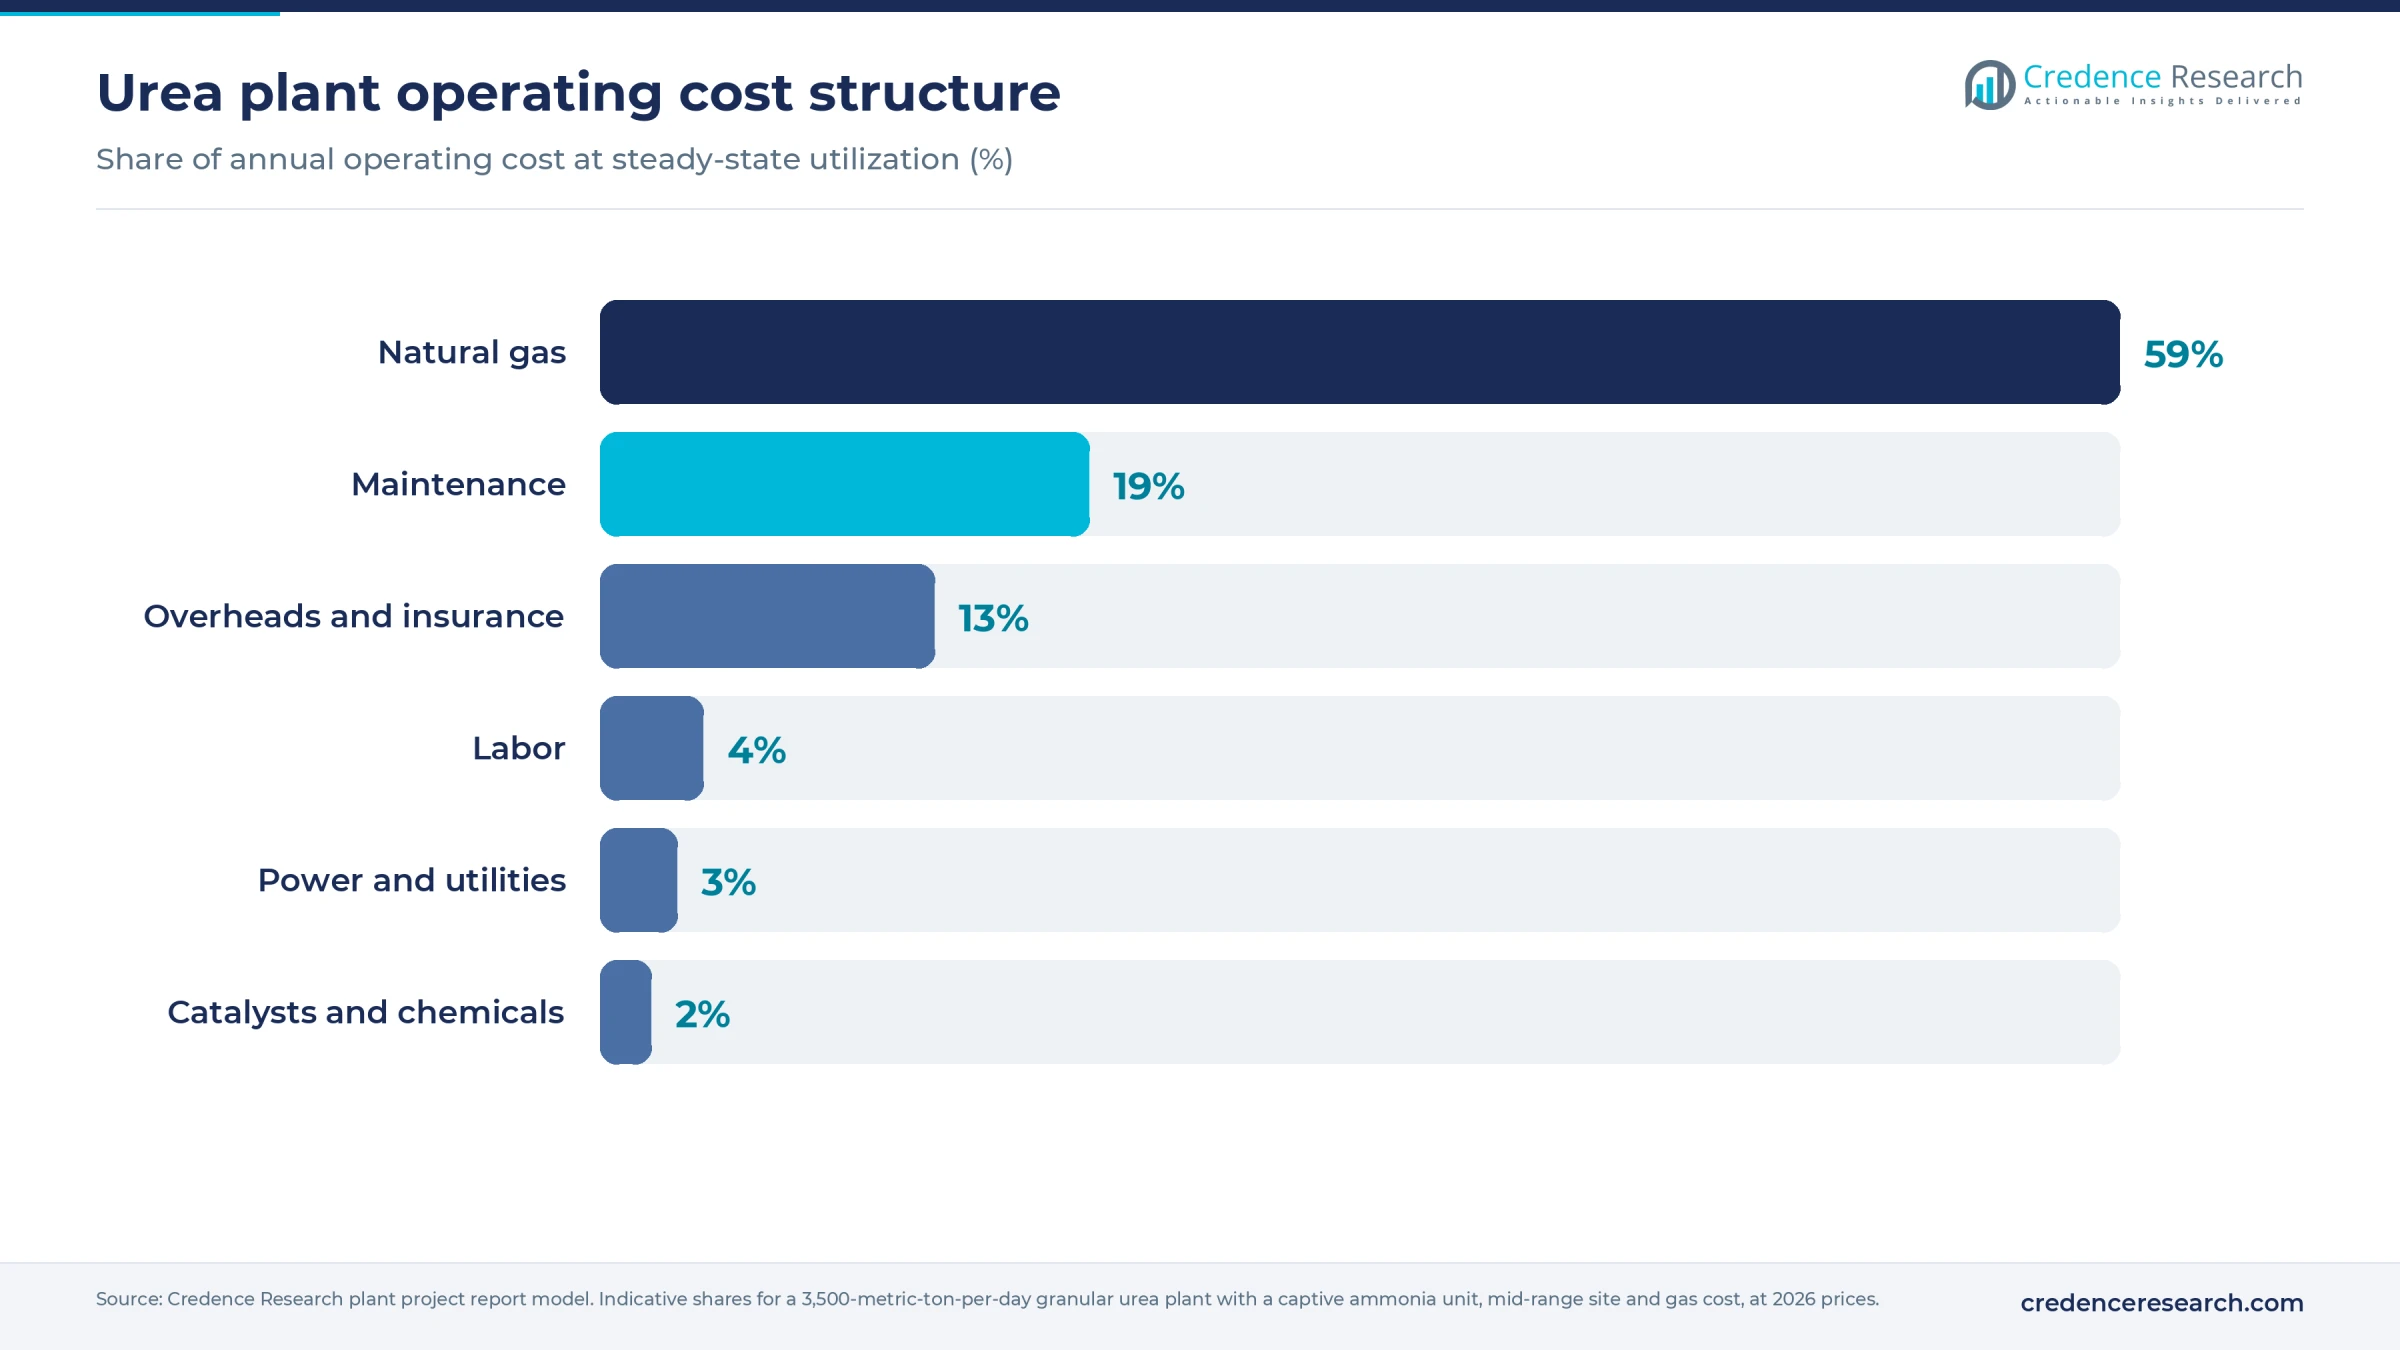
Natural gas makes up about 59% of operating cost in the central case, and maintenance on a capital-heavy plant is the next largest item. The full report can be customized to any country or region.
Machinery and raw materials for a urea plant
The main equipment groups are listed below; ratings, makes and the full schedule are in the report.
- Gas metering, desulfurization vessels, primary reformer furnace and secondary reformer
- High- and low-temperature shift converters, CO2 absorber and regenerator, and methanator
- Synthesis gas, CO2 and refrigeration compressors driven by steam turbines
- Ammonia converter, waste heat boilers, refrigerated ammonia storage tanks
- Urea reactor, high-pressure stripper, carbamate condenser and scrubber in stainless or duplex alloys
- Low-pressure decomposers, vacuum evaporators and a condensate hydrolyzer
- Fluid-bed granulator or prilling tower, coolers, screens, crushers and dust scrubbers
- Bulk storage sheds, reclaimers, bagging lines, conveyors and ship or rail loaders
- Auxiliary boilers, gas turbine generators, cooling towers, demineralized water plant and a distributed control system
At 90% utilization, the plant needs about 23–26 trillion Btu of gas a year for feed and fuel, plus air and treated water, and makes its own CO2 and ammonia. Low-cost gas comes from the Persian Gulf states, North Africa, Russia, Central Asia, Nigeria, Trinidad and Tobago and the U.S. shale basins, while most Chinese capacity gasifies coal instead. Long-term gas pricing is the single cost lever that decides whether a site can compete in export markets. Plants that capture CO2 or buy low-carbon hydrogen can target blue ammonia and low-carbon urea buyers in Europe and Japan.
Urea business profit margin and ROI
Gross margin is estimated at 48–71%, measured as the ex-works urea price minus gas and direct conversion cost, as a share of price. The build assumes an ex-works price of USD 380–460 per ton, bracketing the 2025 Pink Sheet average of USD 423 and the June to October 2026 range of USD 390–453. It uses 22–25 million Btu of gas per ton of urea at an assumed USD 4.00–5.50, above the U.S. Henry Hub average of USD 3.53 in 2025 to allow for transport and contract premiums, and direct conversion cost of an assumed USD 45–60 per ton, mostly maintenance.
At 90% utilization, or about 1.04 million tons, revenue is about USD 440 million in the central case. After assumed overheads and insurance of USD 20–30 million, annual cash profit is about USD 160–320 million, so payback on mid-range CapEx of USD 2.1 billion runs about 7–13 years, with a central case near 9 years. A Gulf site with gas near USD 2–3 and CapEx near the low end can approach 5 years. Europe shows the other extreme: at Dutch TTF gas of about USD 12 in 2025, gas alone costs near USD 280 per ton and margin falls to about 20%.
Gas is the main sensitivity, since each USD 1 change per million Btu moves cost by about USD 23.5 per ton, or about USD 24 million a year.
| Metric | Value |
|---|---|
| Gross margin | 48–71% |
| Payback period | 7–13 years |
| IRR (post-tax) | Available in report |
| NPV | Available in report |
| Return on investment | Available in report |
| DSCR | Available in report |
| Break-even utilization | Available in report |
How to start a urea business, licenses and approvals
A urea project typically moves through company and tax registration, a long-term gas supply agreement, industrial land allocation and building permits, an environmental and social impact assessment, air permits covering reformer flue gas, ammonia and urea dust, a water abstraction and effluent discharge consent, process safety approval for anhydrous ammonia storage, boiler and pressure vessel certification, greenhouse gas reporting, fertilizer product registration and port or export clearances.
| Market | Key approvals for a urea plant |
|---|---|
| United States | State air construction and Title V operating permits, with Prevention of Significant Deterioration review for a major source; NPDES permit under the fertilizer manufacturing effluent guidelines in 40 CFR Part 418, which has a urea subcategory; EPA Risk Management Program under 40 CFR Part 68 and OSHA process safety management in 29 CFR 1910.119 for anhydrous ammonia; greenhouse gas reporting under 40 CFR Part 98 Subpart G; state fertilizer licensing and product registration |
| European Union | Integrated permit under the Industrial Emissions Directive applying best available techniques for ammonia, acids and fertilizers; EU Emissions Trading System permit for ammonia production; Carbon Border Adjustment Mechanism obligations on imported fertilizers; REACH registration; Seveso III safety report for ammonia inventories; Fertilising Products Regulation (EU) 2019/1009 for CE-marked fertilizer |
| India | Environmental clearance under the EIA Notification 2006 for chemical fertilizer projects; consent to establish and operate from the state pollution control board, as a red category industry; manufacturer registration and urea specifications under the Fertiliser (Control) Order 1985; Department of Fertilizers approval, since urea is sold at a controlled price; PESO license for ammonia storage vessels; factory license under the Factories Act and hazardous chemical rules |
Gas allocation usually sets the timeline, because lenders rarely commit before a long-term supply and price formula is signed.
Key urea manufacturers and recent developments
QatarEnergy's QAFCO, SABIC Agri-Nutrients and Ma'aden in the Gulf, Fertiglobe, now controlled by ADNOC, and Egypt's MOPCO lead export supply. In the Americas, Nutrien, CF Industries and Koch Fertilizer dominate, while Yara, EuroChem and Acron are major European and Russian producers. Asia's leaders include Pupuk Indonesia, Petronas Chemicals, IFFCO, National Fertilizers and Chambal Fertilisers in India, Fauji Fertilizer and Engro in Pakistan, and coal-based Chinese groups such as China Coal and Hubei Yihua. Indorama and Dangote anchor Nigeria's export capacity.
- July 2026: Pampa Energía approved its USD 2.7 billion Bahía Blanca complex and Tecnimont, a MAIRE subsidiary, won the roughly 1.3 billion euro engineering, procurement and commissioning contract for its ammonia plant and two urea trains totaling 6,000 tons a day.
- September 2026: SABIC Agri-Nutrients took a final investment decision on a USD 3.47 billion Jubail project adding 1.2 million tons of ammonia and 2.6 million tons of urea a year, with Samsung E&A as contractor and start-up targeted for 2030.
- September 2026: Toyo Engineering completed Indorama Fertilizer's third line in Rivers State, Nigeria, with a 2,300-ton-a-day ammonia plant and a 4,000-ton-a-day urea plant.
New supply is concentrated where gas is cheapest, squeezing high-cost producers.
What's inside the Urea project report PDF
The report runs to 21 chapters. Open a chapter to see its sections.
1. Preface
2. Scope and Methodology
- 2.1 Objectives of the Study
- 2.2 Stakeholders
- 2.3 Research Methodology
- 2.4 Data Sources and Key Assumptions
3. Executive Summary
- 3.1 Market Snapshot
- 3.2 Project at a Glance (Capacity, CapEx, OpEx)
- 3.3 Key Financial Indicators (IRR, NPV, Payback, Break-even)
- 3.4 Feasibility Verdict
4. Product Overview
- 4.1 Urea Definition and Properties
- 4.2 Grades and Specifications (BIS / ISO / ASTM)
- 4.3 HS Code and Classification
- 4.4 Key Applications
- 4.5 Substitutes
5. Global Urea Market
- 5.1 Market Overview
- 5.2 Historical and Current Market Performance (Volume and Value)
- 5.3 Market Breakup by Grade / Type
- 5.4 Market Breakup by End-Use Industry
- 5.5 Market Breakup by Region
- 5.6 Market Drivers, Restraints and Trends
- 5.7 Value Chain Analysis
- 5.8 Market Forecast
6. Target Country Urea Market Analysis
- 6.1 Demand and Supply Analysis
- 6.2 Installed Capacity vs Demand Gap
- 6.3 Import Dependence
- 6.4 Demand Forecast by End-Use
7. Trade Analysis
- 7.1 Imports by Volume, Value and Country
- 7.2 Exports by Volume, Value and Country
- 7.3 Trade Balance and Opportunities
8. Price Analysis
- 8.1 Historical Urea Price Trends by Region
- 8.2 Raw Material / Feedstock Price Trends and Linkage
- 8.3 Price Forecast
- 8.4 Margins Across the Value Chain
9. Competitive Landscape
- 9.1 Market Structure
- 9.2 Key Players and Installed Capacities
- 9.3 Profiles of Key Players
- 9.4 Recent Developments (Expansions, M&A, New Plants)
10. Manufacturing Process and Technology
- 10.1 Comparison of Technology Routes
- 10.2 Selected Route and Process Flow Diagram
- 10.3 Unit Operations Involved
- 10.4 Chemical Reactions Involved
- 10.5 Mass Balance and Raw Material Requirements
- 10.6 Energy Balance
- 10.7 Quality Assurance Criteria and Technical Tests
- 10.8 By-products and Waste Handling
- 10.9 Technology Licensors / Providers
11. Project Details, Requirements and Costs
- 11.1 Land, Location and Site Development
- 11.1.1 Site Selection Criteria
- 11.1.2 Location Analysis
- 11.1.3 Land Requirement and Costs
- 11.1.4 Site Development Costs
- 11.2 Plant Layout
- 11.2.1 Layout Principles
- 11.2.2 Proposed Layout
- 11.2.3 Factors Influencing Layout
- 11.3 Civil Works and Buildings
- 11.4 Plant Machinery
- 11.4.1 Machinery Requirements and Specifications
- 11.4.2 Machinery Costs
- 11.4.3 Machinery Suppliers
- 11.5 Raw Materials
- 11.5.1 Requirements per Tonne of Output
- 11.5.2 Procurement and Sourcing
- 11.5.3 Costs
- 11.5.4 Suppliers
- 11.6 Packaging
- 11.6.1 Packaging Requirements
- 11.6.2 Packaging Costs
- 11.6.3 Packaging Suppliers
- 11.7 Storage and Material Handling
- 11.8 Transportation Requirements and Costs
- 11.9 Utilities
- 11.9.1 Power Requirements and Costs
- 11.9.2 Water Requirements and Costs
- 11.9.3 Steam, Fuel and Other Utilities
- 11.10 Manpower Requirements and Wages
12. Environment, Health, Safety and Sustainability
- 12.1 Effluent and Emissions Management
- 12.2 Hazard Classification and Safety Measures
- 12.3 Carbon Footprint
- 12.4 Green / Low-Carbon Process Options
13. Regulatory Procedures, Approvals and Certifications
- 13.1 Licences and Registrations
- 13.2 Environmental Clearances
- 13.3 Product Certifications (BIS, REACH, etc.)
- 13.4 Approval Timeline
14. Project Implementation Schedule
15. Project Economics
- 15.1 Capital Cost of the Project
- 15.2 Techno-Economic Parameters
- 15.3 Capacity Utilization and Ramp-up
- 15.4 Product Pricing and Margins
- 15.5 Income Projections
- 15.6 Expenditure Projections
- 15.7 Working Capital Requirement
- 15.8 Taxation
- 15.9 Depreciation
16. Financial Analysis
- 16.1 Projected Profit and Loss Account
- 16.2 Projected Cash Flow Statement
- 16.3 Projected Balance Sheet
- 16.4 Liquidity Analysis
- 16.5 Profitability Analysis (Payback, NPV, IRR, ROI)
- 16.6 Break-even Analysis
- 16.7 Debt Service Coverage Ratio (DSCR)
- 16.8 Sensitivity Analysis
- 16.9 Scenario and Uncertainty Analysis
17. Funding and Incentives
- 17.1 Means of Finance and Debt-Equity Structure
- 17.2 Loans and Financial Assistance
- 17.3 Government Schemes and Subsidies (PLI, State Policies)
18. Risk Assessment
- 18.1 Key Success Factors
- 18.2 Key Risk Factors
- 18.3 Risk Mitigation
19. Strategic Recommendations
20. Case Study of a Successful Venture
21. Appendix
- 21.1 Detailed Assumptions
- 21.2 Abbreviations
- 21.3 List of Tables and Figures
- 21.4 Sources
This page vs. the full report
| Data point | On this page (free) | In the full report |
|---|---|---|
| Total CapEx | One rounded range at one capacity | Exact figure at three capacities with a line-item breakup |
| CapEx breakup | Category shares (%) only | Cost, quantity and supplier for every machine |
| Operating cost | Share of raw materials, utilities and labor | Per-unit cost sheet with each input price and consumption |
| Profitability | Gross margin range and payback band | Exact IRR, NPV, ROI, break-even and DSCR |
| Financial statements | List of what is included | 10-year P&L, cash flow, balance sheet and Excel model |
| Sensitivity | One directional line | Full sensitivity and scenario tables |
| Process | Simplified flow diagram | Detailed process flow, mass and energy balance, operating conditions |
| Machinery | Names of the main machines | Specifications, capacity, cost and supplier list |
| Market | Headline size, growth and global demand | Segment, region, trade and price forecast tables |
| Suppliers and buyers | Supplier types and sourcing hubs | Named suppliers and buyers |
Urea project report: FAQs
How much does it cost to set up a urea plant?
Can a small urea plant be profitable?
What raw materials does a urea plant need?
What is the profit margin in urea manufacturing?
What is the payback period for a urea plant?
What is the difference between prilled and granular urea?

About the analyst
Nisha Gupta, Senior Research Analyst
Nisha Gupta is a Senior Research Analyst at Credence Research Inc. who works across industry domains, including packaging, automotive parts and machinery. Her focus is the modelling engine behind each study: she builds quantitative market databases and econometric forecasting frameworks, and developed automated Excel-based market modelling templates that cut client turnaround time by 30%.
Related market research
- Blue Ammonia Market Size, Share, Growth and Forecast, 2025-2035
- Green Ammonia Market Size, Share, Growth and Forecast, 2025-2035
- Diesel Exhaust Fluid Market Size, Growth and Forecast 2032
- Urea Formaldehyde Market Size, Share, Growth and Forecast 2032
- Agriculture Fertilizers Market Size and Forecast Report 2032
- Europe Nitrogen Fertilizers Market Size, Growth and Forecast 2032
More plant project reports
- Methacrylic Acid Manufacturing Plant Project Report (DPR) 2026
- Vinyl Acetate Monomer Manufacturing Plant Project Report (DPR) 2026
- Vinyl Chloride Manufacturing Plant Project Report (DPR) 2026
- Neopentyl Glycol Manufacturing Plant Project Report (DPR) 2026
- Citric Acid Manufacturing Plant Project Report (DPR) 2026
- Castor Oil Processing Plant Project Report (DPR) 2026