
Market Overview:
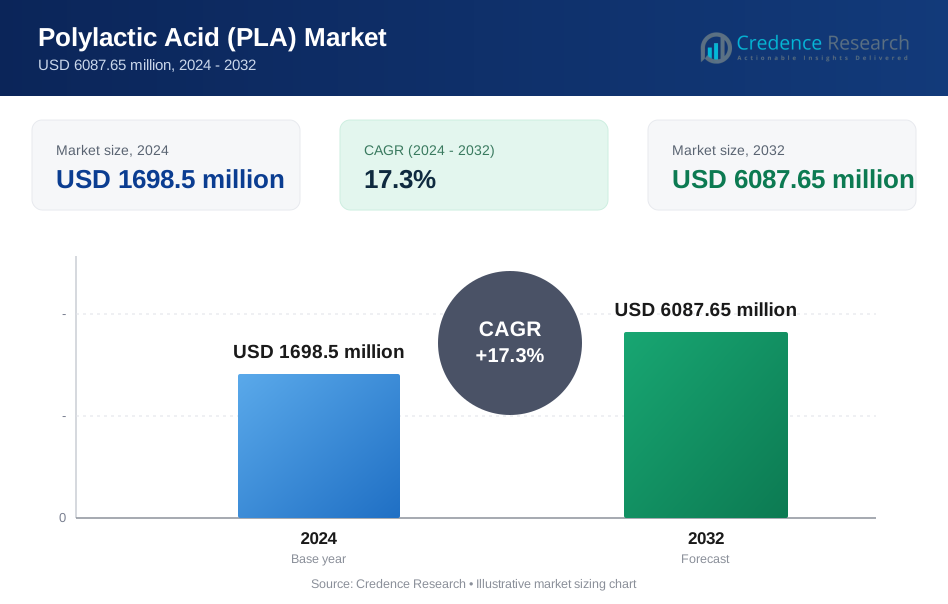
Polylactic Acid (PLA) Market was valued at USD 1698.5 million in 2024 and is anticipated to reach USD 6087.65 million by 2032, growing at a CAGR of 17.3 % during the forecast period.
| REPORT ATTRIBUTE | DETAILS |
|---|---|
| Historical Period | 2020-2023 |
| Base Year | 2024 |
| Forecast Period | 2025-2032 |
| Polylactic Acid (PLA) Market Size 2024 | USD 1698.5 Million |
| Polylactic Acid (PLA) Market, CAGR | 17.3 % |
| Polylactic Acid (PLA) Market Size 2032 | USD 6087.65 Million |
North America led the Polylactic Acid (PLA) Market in 2024 with about 37% share, supported by strong bioplastic adoption and robust corn-based feedstock supply. Key players including NatureWorks, Total Corbion PLA, BASF SE, Sulzer, COFCO Biochemical, FUTERRO S.A., Zhejiang Hisun Biomaterials, Nantong Jiuding Biological Engineering, Chongqing Bofei Biochemical Products, and UNITIKA LTD. expanded their presence through capacity upgrades, advanced fermentation technologies, and development of high-performance PLA grades. These companies focused on sustainable packaging demand, stronger regulatory support, and rising interest in circular biopolymer systems, which reinforced North America’s leadership and encouraged broader global deployment of PLA solutions.
Market Insights:
- The Polylactic Acid (PLA) Market was valued at USD 5 million in 2024 and is projected to reach USD 6087.65 million by 2032, growing at a CAGR of 17.3%
- Strong demand from sustainable packaging drives PLA adoption, with packaging holding about 58% share due to regulatory pressure on single-use plastics and rapid uptake in food service and retail.
- Trends highlight rising use of high-performance PLA grades in textiles, consumer goods, and biomedical applications, supported by advances in heat-resistant and durable formulations.
- Key players such as NatureWorks, Total Corbion PLA, BASF SE, COFCO Biochemical, FUTERRO S.A., and Zhejiang Hisun Biomaterials expand capacity and invest in bio-refineries, while competition remains shaped by cost pressure from petro-based plastics.
- North America led the market with 37% share in 2024, followed by Europe at 33% and Asia-Pacific at 25%, supported by strong packaging demand and abundant feedstock availability for corn-, sugarcane-, and cassava-based PLA.
Market Segmentation Analysis:
By Raw Material
Corn starch led the Polylactic Acid (PLA) Market in 2024 with an estimated 62% share. Producers favored corn feedstock due to strong global supply, established refining chains, and lower conversion costs. Rising demand for compostable plastics in food service and retail packaging also pushed corn-based PLA output. Sugarcane and cassava grades grew at a steady rate as Asian and Latin American suppliers expanded bio-based chemical capacity. Other niche raw materials saw limited use because feedstock availability and processing efficiency remained uneven across regions.
- For instance, one market‑analysis report estimated that corn‑based PLA accounted for about 65.5% of global PLA output in 2024 supported by corn’s abundant supply, high starch content, and established processing infrastructure.
By Application
Rigid thermoform dominated the Polylactic Acid (PLA) Market in 2024 with nearly 48% share. Packaging firms relied on PLA thermoformed trays, cups, and containers due to rising bans on single-use plastics and shifting consumer preference toward renewable materials. Film and sheets followed as demand increased in bags, wraps, and agricultural mulch applications. Bottles gained uptake in niche beverage and personal care formats. Other uses stayed modest because performance gaps in heat resistance and barrier strength restricted adoption in high-stress environments.
- For instance, another report notes that PLA-based films & sheets (flexible packaging) remain a significant portion of non-rigid PLA applications, complementing rigid thermoforms under the packaging umbrella.
By End-use
Packaging held the leading share in the Polylactic Acid (PLA) Market in 2024 with about 58%. Brand owners adopted PLA packaging to meet sustainability targets, reduce landfill waste, and comply with tightening regulations across Europe and North America. Agriculture saw growing PLA mulch and clips demand due to easier field disposal and lower soil impact. Automotive, electronics, and textiles used PLA in lightweight interior parts, casings, and fibers. Consumer goods and biomedical uses expanded as companies adopted biodegradable materials for cutlery, toys, implants, and controlled-release devices.
Key Growth Drivers:
Rising Global Demand for Sustainable Packaging
Growing restrictions on single-use plastics and rising demand for eco-friendly materials strongly push Polylactic Acid (PLA) adoption. Many countries enforce rules that require recyclable or compostable packaging, which places PLA in a favorable position due to its renewable feedstock and lower carbon footprint. Brands in food service, retail, and fast-moving consumer goods use PLA products to meet internal sustainability goals and avoid penalties linked to plastic waste. Strong interest from e-commerce packaging also lifts consumption as companies shift to lighter and greener materials. PLA producers expand capacity to meet supply shortages, especially in Asia and Europe. These combined forces create stable long-term demand for PLA packaging formats such as thermoformed trays, films, and disposable serviceware.
- For instance, in Europe the Single‑Use Plastics Directive (SUPD) has led several EU countries to ban disposable cutlery, plates, and polystyrene containers.
Expansion of Bio-Refineries and Feedstock Availability
Large investments in bio-refineries strengthen PLA supply by improving access to corn, sugarcane, and cassava feedstocks. Many producers upgrade fermentation and polymerization technology to reduce costs and improve conversion efficiency. Nations with strong agricultural output, such as the United States, Thailand, and Brazil, support PLA growth by offering stable crop supply and improving logistics for biopolymer manufacturing. Feedstock diversification also helps protect the market from price fluctuations in corn and sugar. Lower production costs encourage wider use of PLA in textiles, consumer goods, and agriculture. As capacity additions come online, market players secure long-term contracts with packaging, automotive, and electronics firms. These steps deepen PLA integration across multiple industries.
- For instance, TotalEnergies Corbion operates a PLA production facility in Thailand that uses sugarcane‑derived raw sugar from local mills leveraging tropical‑region agriculture to secure stable feedstock supply and reduce logistic emission burdens relative to imported starch.
R&D Progress in High-Performance PLA Grades
Research efforts improve PLA’s heat resistance, impact strength, and barrier properties, allowing wider use in demanding applications. Modified PLA blends replace traditional plastics in automotive panels, electronic casings, and premium rigid packaging. Advancements in crystallization control and compounding also create PLA materials suitable for hot-fill containers and microwave-safe products. Universities and chemical companies collaborate to develop next-generation PLA grades with longer life cycles and better recyclability. New processing technologies reduce energy use and enhance product consistency, supporting mass adoption. As high-performance variants enter the market, industries gain confidence in PLA’s ability to meet functional and regulatory needs, leading to broader commercial acceptance.
Key Trends & Opportunities:
Shift Toward Circular Bioplastics Systems
Circular economy programs accelerate opportunities for PLA through composting, chemical recycling, and controlled feedstock recovery. Governments invest in industrial composting networks to support wider disposal options for PLA-based products. Technology developers scale depolymerization systems that convert PLA waste back into lactic acid, creating a closed-loop supply chain. Retailers and food service brands adopt take-back programs that highlight the environmental benefits of biodegradable packaging. These changes increase PLA visibility and raise consumer acceptance.
- For instance, TotalEnergies Corbion recently announced a commercially viable process for producing 100% chemically recycled PLA from post‑consumer waste: used PLA is depolymerized back into its original monomer (lactide), which can then be repolymerized into new PLA resin with properties identical to virgin material.
Growing Use in High-Value Medical and Textile Applications
PLA gains momentum in biomedical devices and technical textiles due to better biocompatibility and improved fiber properties. Medical firms adopt PLA for sutures, tissue scaffolds, and drug-delivery systems. Textile producers use PLA fibers for lightweight clothing, hygiene products, and eco-friendly blends. Rising demand for sustainable materials in fashion and healthcare supports long-term opportunity creation.
- For instance, PLA is widely used in 3D‑printed medical devices: researchers have successfully created bone‑tissue scaffolds, drug‑eluting constructs, and biodegradable implants with PLA that support tissue regeneration and controlled release of active agents.
Key Challenges:
Competition from Lower-Cost Petrochemical Plastics
Traditional plastics such as PET, PP, and PS maintain strong cost advantages, especially in regions with low oil prices. Large converters hesitate to adopt PLA in high-volume applications due to higher material prices and performance gaps in heat stability. Limited global capacity also restricts scaling benefits. These cost pressures slow PLA penetration in mainstream packaging and consumer goods.
Inadequate Composting and Recycling Infrastructure
PLA adoption faces barriers in regions without industrial composting systems or proper sorting facilities. Many municipalities lack the ability to process PLA waste, which can undermine environmental claims and raise disposal costs for brands. Confusion among consumers about composting standards further limits PLA recovery rates. These gaps reduce PLA’s sustainability impact and challenge its long-term acceptance.
Regional Analysis:
North America
North America led the Polylactic Acid (PLA) Market in 2024 with about 37% share. Strong regulations on single-use plastics and rising adoption of compostable packaging supported PLA demand across food service, retail, and e-commerce sectors. The United States remained the largest consumer due to steady bioplastic investments and strong availability of corn-based feedstocks. Brands in consumer goods and healthcare also expanded PLA use in fibers, casings, and medical-grade materials. Increased focus on closed-loop systems and industrial composting programs further strengthened the region’s leadership in PLA production and consumption.
Europe
Europe held nearly 33% share of the global Polylactic Acid (PLA) Market in 2024. The European Union’s strict waste directives and plastic taxation drove strong demand for bio-based packaging. Countries such as Germany, France, and the Netherlands accelerated PLA adoption through advanced composting networks and sustainability-focused retail chains. Food packaging, cutlery, and films remained leading users, supported by expanding recycling and organic waste treatment capacity. Rising interest in textile-grade PLA and eco-friendly consumer products further boosted regional growth as brands aligned with circular economy goals.
Asia-Pacific
Asia-Pacific accounted for roughly 25% of the Polylactic Acid (PLA) Market in 2024 and recorded the fastest growth rate. China, Japan, Thailand, and South Korea expanded biopolymer production backed by strong government incentives and rising demand for greener packaging. Abundant sugarcane and cassava feedstock supply in Southeast Asia also increased PLA output. Expanding applications in textiles, automotive interiors, and electronics strengthened market penetration. E-commerce packaging and food delivery platforms further accelerated adoption, making Asia-Pacific a key future growth hub for PLA manufacturers.
Latin America
Latin America held close to 3% share of the Polylactic Acid (PLA) Market in 2024. Brazil led regional consumption due to large sugarcane reserves, strong bio-refinery activity, and growing interest in sustainable packaging. Food and beverage brands adopted PLA trays, bottles, and films to meet rising environmental commitments. Mexico and Chile also showed steady demand as retailers shifted toward compostable materials. Limited industrial composting infrastructure and higher import dependence outside Brazil kept adoption moderate, but ongoing investment in bio-based materials supports long-term opportunity.
Middle East & Africa
The Middle East & Africa region captured around 2% share of the Polylactic Acid (PLA) Market in 2024. Adoption grew slowly due to limited composting systems and higher prices compared to petrochemical plastics. However, rising sustainability programs in the UAE, Saudi Arabia, and South Africa supported niche demand in food packaging and consumer goods. Import-driven supply chains continued to dominate, though emerging bio-based project investments signaled long-term potential. Growing awareness of environmental waste issues and planned regulatory reforms are expected to lift regional PLA usage over the forecast period.
Market Segmentations:
By Raw Material
- Corn starch
- Sugarcane
- Cassava
- Others
By Application
- Rigid thermoform
- Film & sheets
- Bottles
- Others
By End-use
- Packaging
- Agriculture
- Automotive & transportation
- Electronics
- Textile
- Consumer goods
- Bio-medical
- Others
By Geography
- North America
- U.S.
- Canada
- Mexico
- Europe
- Germany
- France
- U.K.
- Italy
- Spain
- Rest of Europe
- Asia Pacific
- China
- Japan
- India
- South Korea
- South-east Asia
- Rest of Asia Pacific
- Latin America
- Brazil
- Argentina
- Rest of Latin America
- Middle East & Africa
- GCC Countries
- South Africa
- Rest of the Middle East and Africa
Competitive Landscape:
The Polylactic Acid (PLA) Market features leading players such as NatureWorks, Total Corbion PLA, BASF SE, Sulzer, COFCO Biochemical, FUTERRO S.A., Zhejiang Hisun Biomaterials, Nantong Jiuding Biological Engineering, Chongqing Bofei Biochemical Products, and UNITIKA LTD. These companies strengthen their positions by expanding biopolymer production, securing long-term feedstock contracts, and developing high-performance PLA grades with better heat resistance and mechanical strength. Many firms invest in large-scale bio-refineries to improve cost efficiency and meet rising demand from packaging, textiles, consumer goods, and automotive sectors. Strategic collaborations between technology providers and manufacturers support rapid adoption of chemical recycling and advanced fermentation technologies. European and Asian players focus on scaling circular systems, while North American producers leverage strong corn supply to maintain cost advantages. Continuous product innovation and capacity expansion remain central to competition, with sustainability commitments guiding long-term industry strategies.
Key Player Analysis:
- FUTERRO S.A.
- UNITIKA LTD.
- COFCO Biochemical
- BASF SE (Ludwigshafen, Germany)
- Chongqing Bofei Biochemical Products, Ltd.
- Nantong Jiuding Biological Engineering
- Sulzer (Winterthur, Switzerland)
- Zhejiang Hisun Biomaterials Co., Ltd
- Total Corbion PLA (Gorinchem, Netherlands)
- NatureWorks (Minnetonka, Minnesota, United States)
Recent Developments:
- In October 2025, FUTERRO S.A. continued its Europe expansion push, publishing updates on its European biorefinery programme and company roadmap for scaling PLA/lactic-acid production.
- In February 2025, COFCO Biochemical (COFCO Biotechnology) filed plans to relocate its 30,000 t/y lactide production project to Bengbu, Anhui province, a strategic move to address PLA supply-chain bottlenecks (lactide = key PLA intermediate).
Report Coverage:
The research report offers an in-depth analysis based on Raw material, Application, End-Use and Geography. It details leading market players, providing an overview of their business, product offerings, investments, revenue streams, and key applications. Additionally, the report includes insights into the competitive environment, SWOT analysis, current market trends, as well as the primary drivers and constraints. Furthermore, it discusses various factors that have driven market expansion in recent years. The report also explores market dynamics, regulatory scenarios, and technological advancements that are shaping the industry. It assesses the impact of external factors and global economic changes on market growth. Lastly, it provides strategic recommendations for new entrants and established companies to navigate the complexities of the market.
Future Outlook:
- PLA demand will rise as global rules tighten on single-use plastics.
- Packaging firms will scale PLA use to meet sustainability targets.
- New high-heat and high-strength PLA grades will unlock advanced applications.
- Bio-refinery expansion will improve feedstock supply and reduce production costs.
- Chemical recycling and depolymerization will support circular PLA systems.
- Textile and fiber applications will grow with rising interest in eco-friendly materials.
- Automotive and electronics sectors will adopt PLA for lightweight parts and casings.
- Composting infrastructure improvements will increase end-of-life viability for PLA products.
- Asia-Pacific will become the fastest-growing region due to strong manufacturing capacity.
- Strategic partnerships among producers, converters, and brands will speed up PLA commercialization.
Request a Free Sample
Fill in your details and we'll send you a free sample report.
- Sample data tables & charts
- Research methodology
Market Dynamics
Rising Global Demand for Sustainable Packaging
Increasing regulatory restrictions on single-use plastics and growing consumer preference for eco-friendly packaging are driving rapid PLA adoption, especially in food service, retail, and e-commerce sectors. PLA's compostability and renewable feedstock position it as a preferred alternative to conventional plastics.
Expansion of Bio-Refineries and Feedstock Availability
Significant investments in bio-refineries and improvements in agricultural supply chains for corn, sugarcane, and cassava are enhancing PLA production capacity and reducing costs. This ensures a stable supply of raw materials and supports market growth across multiple regions.
R&D Progress in High-Performance PLA Grades
Advancements in PLA formulations have improved heat resistance, impact strength, and barrier properties, enabling PLA to penetrate new applications such as automotive parts, electronics casings, and premium packaging. These innovations increase PLA's competitiveness against traditional plastics.
Shift Toward Circular Bioplastics Systems
The development of industrial composting, chemical recycling, and closed-loop supply chains is making PLA more attractive to brands and consumers focused on circular economy goals. These systems enhance PLA's environmental credentials and support broader market acceptance.
Growing Use in Medical and Textile Applications
PLA's biocompatibility and improved fiber properties are driving its adoption in biomedical devices, sutures, tissue scaffolds, and technical textiles. The demand for sustainable materials in healthcare and fashion is opening new high-value markets for PLA.
Need a Custom Version of This Report?
Tailor the scope, geography, or segments to your exact requirements.
- Custom geography or segment scope
- Direct access to our analyst team
Frequently Asked Questions
What is the current market size for Polylactic Acid (PLA) Market, and what is its projected size in 2032?
At what Compound Annual Growth Rate is Polylactic Acid (PLA) Market projected to grow between 2024 and 2032?
Which Polylactic Acid (PLA) Market segment held the largest share in 2024?
What are the primary factors fueling the growth of Polylactic Acid (PLA) Market?
Who are the leading companies in Polylactic Acid (PLA) Market?
Which region commanded the largest share of Polylactic Acid (PLA) Market?
Table of Content
Chapter 1 Market Segmentation
- 1.1 Segmentation Framework
- 1.1.1 Product and Service Classification
- 1.1.2 Application and End-Use Classification
- 1.1.3 Technology and Solution Classification
- 1.1.4 Customer and Distribution Channel Classification
- 1.1.5 Geographic Segmentation
- 1.1.6 Market Segment Definitions and Boundaries
- 1.2 By End-use
- 1.2.1 Packaging
- 1.2.2 Agriculture
- 1.2.3 Automotive & transportation
- 1.2.4 Electronics
- 1.2.5 Textile
- 1.2.6 Consumer goods
- 1.2.7 Bio-medical
- 1.2.8 Others
- 1.3 By Application
- 1.3.1 Rigid thermoform
- 1.3.2 Film & sheets
- 1.3.3 Bottles
- 1.3.4 Others
- 1.4 By Raw Material
- 1.4.1 Corn starch
- 1.4.2 Sugarcane
- 1.4.3 Cassava
- 1.4.4 Others
Chapter 2 Introduction
- 2.1 Report Objectives and Scope
- 2.2 Product Definition and Industry Terminology
- 2.3 Market Inclusions and Exclusions
- 2.4 Research Process
- 2.4.1 Primary Research and Expert Interviews
- 2.4.2 Secondary Research and Source Review
- 2.4.3 Top-Down and Bottom-Up Estimation
- 2.4.4 Data Triangulation and Verification
- 2.5 Market Size Measurement Basis
- 2.5.1 2024: USD 1698.5 million → 2032: USD 6087.65 million
- 2.6 Historical and Forecast Reference Periods
- 2.6.1 Base Year: 2024
- 2.6.2 Forecast Period: 2024-2032
- 2.7 Research Assumptions and Limitations
Chapter 3 Executive Summary
- 3.1 Market Snapshot and Key Findings
- 3.2 Base-Year Market Size, 2024
- 3.3 Forecast Market Size, 2032
- 3.4 Revenue and Volume Growth Outlook
- 3.5 Key Demand and Supply Indicators
- 3.6 Leading Market Segments
- 3.7 Fastest-Growing Market Opportunities
- 3.8 Regional Performance Highlights
- 3.9 Technology and Industry Transformation
- 3.10 Competitive Landscape Summary
- 3.11 Analyst View and Strategic Implications
Chapter 4 Global Polylactic Acid (PLA) Market Trends and Developments
- 4.1 Historical Industry Development
- 4.2 Recent Market Trends and Developments
- 4.3 Demand and Customer Behavior Trends
- 4.4 Technology and Product Innovation
- 4.5 Artificial Intelligence, Automation and Digitalization
- 4.6 Local Manufacturing and Supply Chain Realignment
- 4.7 Industry Partnerships, Mergers and Acquisitions
- 4.8 Sustainability and Circular Economy Developments
- 4.9 Government and Private Sector Investment Trends
- 4.10 Emerging Business Models and Commercialization
- 4.11 Industry Developments and Announcements
Chapter 5 Global Polylactic Acid (PLA) Market Production, Supply and Demand Analysis
- 5.1 Demand Trend and Consumption Analysis
- 5.2 Demand Forecast, 2024-2032
- 5.3 Production and Output Trend
- 5.4 Production and Output Forecast, 2024-2032
- 5.5 Installed Capacity and Capacity Utilization
- 5.6 Company-Wise Production Plants and Statistics
- 5.6.1 Installed Production Capacity
- 5.6.2 Actual Production
- 5.6.3 Planned Capacity and Expansion Targets
- 5.7 Supply Chain Structure and Procurement Trends
- 5.8 Supply-Demand Gap and Bottlenecks
- 5.9 Import Dependence and Sourcing Structure
- 5.10 Contract Manufacturing and Outsourcing
- 5.11 Regional Supply and Demand Concentration
Chapter 6 Global Polylactic Acid (PLA) Market Pricing Analysis
- 6.1 Pricing Structure and Measurement
- 6.2 Historical Pricing Trends
- 6.3 Pricing Outlook, 2024-2032
- 6.4 Average Selling Price and Unit Economics
- 6.5 Pricing by Product and Market Segment
- 6.6 Geographic Pricing Differences
- 6.7 Key Input, Energy, Labor and Logistics Costs
- 6.8 Contract Pricing and Purchasing Models
- 6.9 Pricing Sensitivity and Competitive Positioning
- 6.10 Price, Margin and Profitability Implications
Chapter 7 Global Polylactic Acid (PLA) Market Dynamics
- 7.1 Market Growth Drivers
- 7.1.1 Demand-Side Drivers
- 7.1.2 Technology and Innovation Drivers
- 7.1.3 Infrastructure and Investment Drivers
- 7.1.4 Regulatory and Policy Drivers
- 7.2 Market Restraints
- 7.2.1 Cost and Affordability Constraints
- 7.2.2 Technology and Adoption Barriers
- 7.2.3 Supply Chain and Operational Constraints
- 7.3 Market Challenges
- 7.3.1 Competitive Pressure and Margin Erosion
- 7.3.2 Skills, Infrastructure and Implementation Gaps
- 7.4 Emerging Market Opportunities
- 7.5 Market Dynamics Impact and Time-Horizon Assessment
Chapter 8 Global Polylactic Acid (PLA) Value Chain Analysis
- 8.1 Industry Value Chain Overview
- 8.2 Upstream Suppliers and Critical Inputs
- 8.3 Technology and Component Providers
- 8.4 Manufacturing or Service Delivery
- 8.5 Distribution, Channel Partners and Integrators
- 8.6 Downstream Applications and End Users
- 8.7 Value Addition and Profit Pools
- 8.8 Vertical Integration and Outsourcing
- 8.9 Supplier Concentration and Risk
- 8.10 Supply Chain Localization and Resilience
Chapter 9 Global Polylactic Acid (PLA) Market Regulations and Policies
- 9.1 Relevant Laws, Standards and Compliance Frameworks
- 9.2 Product, Service, Safety and Quality Requirements
- 9.3 Government Policies, Incentives and Subsidies
- 9.4 Imports, Exports and Trade Barriers
- 9.5 Public Procurement and Local Content Requirements
- 9.6 Environmental and Sustainability Compliance
- 9.7 Upcoming Policy Changes and Market Implications
Chapter 10 Global Polylactic Acid (PLA) Market Hotspots and Opportunities
- 10.1 Market Opportunity Mapping and Growth Hotspots
- 10.2 High-Growth Applications and Customer Groups
- 10.3 Underserved Markets and White-Space Opportunities
- 10.4 Emerging Technology and Product Opportunities
- 10.5 New Capacity and Investment Hotspots
- 10.6 Market Entry and Expansion Opportunities
- 10.7 Distribution and Partnership Opportunities
- 10.8 Near-Term and Long-Term Commercial Potential
- 10.9 Opportunity Attractiveness and Execution Risks
Chapter 11 Global Polylactic Acid (PLA) Market Outlook, 2024-2032
- 11.1 Market Size and Analysis
- 11.1.1 Revenue (Market Measurement: 2024: USD 1698.5 million → 2032: USD 6087.65 million)
- 11.1.2 Market Volume and Quantity Sold
- 11.1.3 Historical Market Size
- 11.1.4 Base-Year Market Size, 2024
- 11.2 Market Forecast, 2024-2032
- 11.2.1 Revenue Forecast to 2032
- 11.2.2 Volume Forecast to 2032
- 11.2.3 CAGR and Year-on-Year Growth
- 11.2.4 Incremental Revenue Opportunity
- 11.3 Forecast Assumptions and Scenario Analysis
- 11.3.1 Base-Case Forecast
- 11.3.2 Optimistic and Conservative Scenarios
- 11.3.3 Technology, Pricing and Policy Sensitivities
- 11.4 Market Attractiveness and Growth Outlook
Chapter 12 Global Polylactic Acid (PLA) Market Segmentation and Outlook
- 12.1 Segmentation Summary and Market Shares, 2024
- 12.2 Largest and Fastest-Growing Segments
- 12.3 By End-use - Market Size and Forecast, 2024-2032
- 12.3.1 Segment Definition and Scope
- 12.3.2 Historical Market Size
- 12.3.3 Revenue Forecast, 2024-2032
- 12.3.4 Volume Forecast, 2024-2032
- 12.3.5 Base-Year Market Share, 2024
- 12.3.6 Segment CAGR and Growth Drivers
- 12.3.7 Subsegment Market Size and Forecast
- 12.3.7.1 Packaging
- 12.3.7.2 Agriculture
- 12.3.7.3 Automotive & transportation
- 12.3.7.4 Electronics
- 12.3.7.5 Textile
- 12.3.7.6 Consumer goods
- 12.3.7.7 Bio-medical
- 12.3.7.8 Others
- 12.3.8 Subsegment Pricing and Adoption Trends
- 12.3.9 Leading Suppliers and Competition
- 12.3.10 Regional Demand and Opportunities
- 12.4 By Application - Market Size and Forecast, 2024-2032
- 12.4.1 Segment Definition and Scope
- 12.4.2 Historical Market Size
- 12.4.3 Revenue Forecast, 2024-2032
- 12.4.4 Volume Forecast, 2024-2032
- 12.4.5 Base-Year Market Share, 2024
- 12.4.6 Segment CAGR and Growth Drivers
- 12.4.7 Subsegment Market Size and Forecast
- 12.4.7.1 Rigid thermoform
- 12.4.7.2 Film & sheets
- 12.4.7.3 Bottles
- 12.4.7.4 Others
- 12.4.8 Subsegment Pricing and Adoption Trends
- 12.4.9 Leading Suppliers and Competition
- 12.4.10 Regional Demand and Opportunities
- 12.5 By Raw Material - Market Size and Forecast, 2024-2032
- 12.5.1 Segment Definition and Scope
- 12.5.2 Historical Market Size
- 12.5.3 Revenue Forecast, 2024-2032
- 12.5.4 Volume Forecast, 2024-2032
- 12.5.5 Base-Year Market Share, 2024
- 12.5.6 Segment CAGR and Growth Drivers
- 12.5.7 Subsegment Market Size and Forecast
- 12.5.7.1 Corn starch
- 12.5.7.2 Sugarcane
- 12.5.7.3 Cassava
- 12.5.7.4 Others
- 12.5.8 Subsegment Pricing and Adoption Trends
- 12.5.9 Leading Suppliers and Competition
- 12.5.10 Regional Demand and Opportunities
- 12.6 Segment Growth Comparison
- 12.7 Segment Attractiveness and Priority Matrix
Chapter 13 Global Polylactic Acid (PLA) End-Use and Application Market Outlook
- 13.1 End-Use Industry and Customer Demand Structure
- 13.2 Leading Applications and Customer Groups
- 13.3 End-Use Market Size, Share and Forecast
- 13.4 Major End-Use Industry Deep Dives
- 13.4.1 Customer Requirements and Use Cases
- 13.4.2 Demand and Replacement Cycles
- 13.4.3 Technical and Regulatory Considerations
- 13.4.4 Purchasing and Procurement Models
- 13.4.5 Leading Vendors and Distribution Channels
- 13.4.6 Forecast and Commercial Opportunities
- 13.5 Emerging Applications and Cross-Segment Demand
- 13.6 End-Use Industry Investment Priorities
Chapter 14 Global Polylactic Acid (PLA) Geographic Market Outlook, 2024-2032
- 14.1 Regional Market Size and Share, 2024
- 14.2 Regional Market Forecast, 2024-2032
- 14.3 Regional Pricing, Production and Demand Differences
- 14.4 North America
- 14.4.1 United States
- 14.4.2 Canada
- 14.4.3 Mexico
- 14.5 Europe
- 14.5.1 Germany
- 14.5.2 France
- 14.5.3 Italy
- 14.5.4 United Kingdom
- 14.5.5 Spain
- 14.5.6 Poland
- 14.5.7 Russia
- 14.5.8 Netherlands
- 14.5.9 Belgium
- 14.5.10 Sweden
- 14.5.11 Denmark
- 14.5.12 Norway
- 14.5.13 Rest of Europe
- 14.6 Asia Pacific
- 14.6.1 China
- 14.6.2 India
- 14.6.3 Japan
- 14.6.4 South Korea
- 14.6.5 Thailand
- 14.6.6 Indonesia
- 14.6.7 Vietnam
- 14.6.8 Malaysia
- 14.6.9 Australia
- 14.6.10 Rest of Asia Pacific
- 14.7 Latin America
- 14.7.1 Brazil
- 14.7.2 Argentina
- 14.7.3 Colombia
- 14.7.4 Chile
- 14.7.5 Rest of Latin America
- 14.8 Middle East
- 14.8.1 Saudi Arabia
- 14.8.2 United Arab Emirates
- 14.8.3 Turkey
- 14.8.4 Israel
- 14.8.5 Iran
- 14.8.6 Rest of the Middle East
- 14.9 Africa
- 14.9.1 South Africa
- 14.9.2 Egypt
- 14.9.3 Nigeria
- 14.9.4 Morocco
- 14.9.5 Rest of Africa
- 14.10 Regional Investment, Policy and Supply Chain Differences
- 14.11 Regional Competitive Landscape
- 14.12 Geographic Growth Hotspots
Chapter 15 Global Polylactic Acid (PLA) Technology, Innovation and Sustainability Outlook
- 15.1 Technology Landscape and Maturity
- 15.2 Product, Process and Service Innovation
- 15.3 AI, Automation and Digital Tools in the Industry
- 15.4 Technology Adoption and Performance Benchmarking
- 15.5 Innovation Pipeline and R&D Investment
- 15.6 Patent and Intellectual Property Trends
- 15.7 Energy Efficiency and Resource Management
- 15.8 Sustainability, Recycling and Circularity
- 15.9 Technology Roadmap, 2024-2032
- 15.10 Risks of Obsolescence and Technology Substitution
Chapter 16 Global Polylactic Acid (PLA) Market Key Strategic Imperatives
- 16.1 Growth and Market Entry Priorities
- 16.2 High-Return Products and Segments
- 16.3 Pricing, Profitability and Cost Optimization
- 16.4 Technology Investment and Product Differentiation
- 16.5 Supply Chain Localization and Resilience
- 16.6 Distribution and Customer Acquisition
- 16.7 Partnership, Acquisition and Capacity Strategy
- 16.8 Regional Expansion Priorities
- 16.9 Short-, Medium- and Long-Term Actions
Chapter 17 Competition Outlook
- 17.1 Industry Competition Characteristics
- 17.2 Market Structure and Concentration
- 17.3 Market Share and Competitive Positioning, 2024
- 17.4 Company-Wise Revenue and Product Benchmarking
- 17.5 Production and Service Capacity Benchmarking
- 17.6 Technology, Pricing and Differentiation
- 17.7 Regional Footprint and Distribution Strength
- 17.8 Mergers, Acquisitions and Strategic Alliances
- 17.9 New Entrants and Competitive Threats
- 17.10 Porter's Five Forces and Industry Attractiveness
- 17.11 Competitive Outlook, 2024-2032
Chapter 18 Company Profiles
- 18.1 Company Coverage and Selection Criteria
- 18.2 NatureWorks
- 18.2.1 Business Description
- 18.2.2 Company Ownership and Geographic Presence
- 18.2.3 Product and Service Portfolio
- 18.2.4 Manufacturing and Operating Footprint
- 18.2.5 Production Capacity and Expansion Plans
- 18.2.6 Financial Performance and Investment
- 18.2.7 Market Share and Competitive Position
- 18.2.8 Technology and Innovation Capabilities
- 18.2.9 Strategic Alliances or Partnerships
- 18.2.10 Recent Developments
- 18.2.11 Growth Strategy and Outlook
- 18.3 Total Corbion PLA
- 18.4 BASF SE
- 18.5 Sulzer
- 18.6 COFCO Biochemical
- 18.7 FUTERRO S.A.
- 18.8 Zhejiang Hisun Biomaterials
- 18.9 Nantong Jiuding Biological Engineering
- 18.10 Chongqing Bofei Biochemical Products
- 18.11 UNITIKA LTD.
- 18.12 Other Relevant Market Participants
Note: Every listed company is profiled on the structure shown under the first company. The company list is preliminary and may change based on research findings, market developments, data availability and client requirements.
Chapter 19 Disclaimer
- 19.1 Research and Forecast Disclaimer
- 19.2 Data Source and Estimation Limitations
Note: The depth of individual sections depends on data availability for this market. Volume, capacity, trade and other unit-based metrics are included where applicable.

