
Advanced Visualization Market Overview:
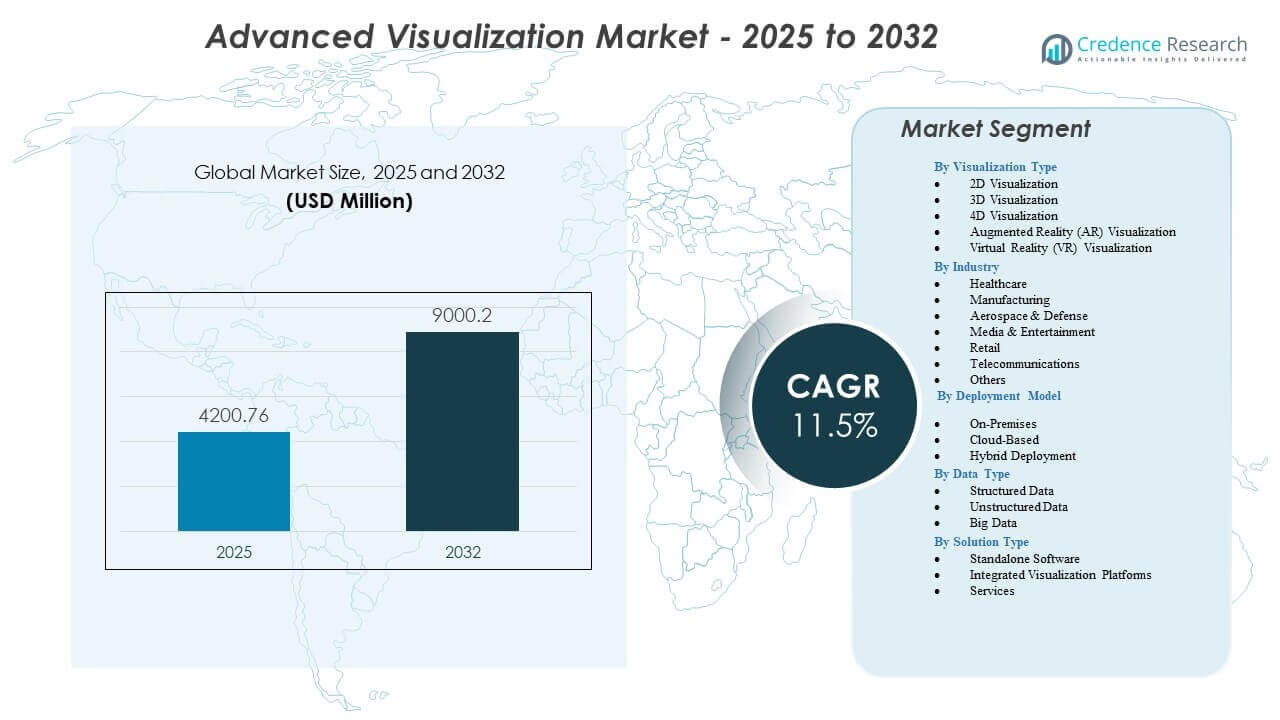
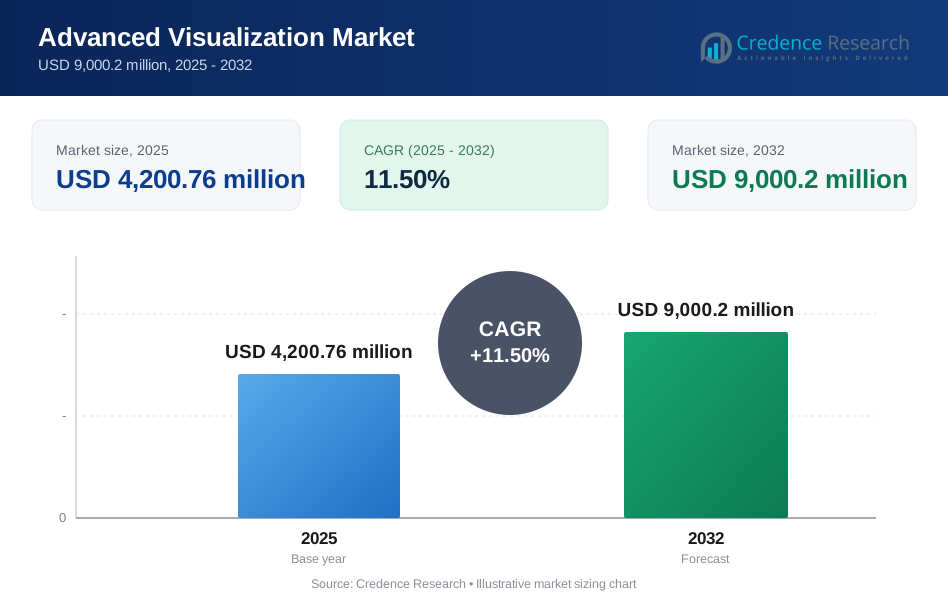
The Advanced Visualization Market is projected to grow from USD 4,200.76 million in 2025 to an estimated USD 9,000.2 million by 2032, with a compound annual growth rate (CAGR) of 11.5% from 2025 to 2032.
| REPORT ATTRIBUTE | DETAILS |
|---|---|
| Historical Period | 2020-2023 |
| Base Year | 2024 |
| Forecast Period | 2025-2032 |
| Advanced Visualization Market Size 2025 | USD 4,200.76 million |
| Advanced Visualization Market, CAGR | 11.5% |
| Advanced Visualization Market Size 2032 | USD 9,000.2 million |
Market drivers include strong demand for accurate diagnostics, faster clinical workflows, and high-resolution imaging across radiology, oncology, cardiology, and surgery. Healthcare providers use advanced visualization to improve interpretation precision, reduce review time, and enhance clinical confidence. Rising deployment of AI-powered image analysis, multimodality fusion, and real-time rendering supports advanced decision-making in hospitals. Non-healthcare sectors, including manufacturing, aerospace, and telecommunications, adopt visualization platforms to strengthen simulation, design optimization, and infrastructure mapping. Growth accelerates as organizations prioritize efficiency, automation, and improved insight extraction.
Regionally, North America leads due to advanced healthcare infrastructure, strong adoption of AI-powered imaging tools, and early integration of cloud-based visualization systems. Europe follows with growing demand for interoperable imaging platforms and structured digital health expansion across major economies. Asia-Pacific emerges as the fastest-growing region, supported by rapid upgrades in hospital infrastructure, rising imaging volumes, and broader acceptance of high-performance visualization tools. Latin America and the Middle East show gradual growth as modernization efforts accelerate and clinical imaging capabilities expand across developing markets.
Advanced Visualization Market Insights:
- The Advanced Visualization Market is projected to grow from USD 4,200.76 million in 2025 to an estimated USD 9,000.2 million by 2032, with a compound annual growth rate (CAGR) of 11.5% from 2025 to 2032, supported by rising adoption of multi-format imaging and AI-enabled visualization platforms.
- Strong market drivers include growing demand for high-resolution diagnostics, faster interpretation workflows, and wider integration of 3D, 4D, AR, and VR tools across clinical and industrial settings.
- Key restraints involve high implementation costs, limited interoperability across legacy systems, and training challenges in facilities transitioning to advanced visualization platforms.
- North America leads due to strong digital infrastructure and early use of AI-based imaging, while Europe expands through structured modernization of diagnostic networks.
- Asia-Pacific emerges as a high-growth region driven by rising imaging capacity and rapid adoption of advanced visualization systems across hospitals and engineering sectors.
Advanced Visualization Market Drivers
Growing Preference For High-Resolution Imaging To Improve Diagnostic Accuracy
Healthcare providers increase the use of high-resolution imaging to support stronger diagnostic outcomes. Many hospitals shift toward platforms that deliver clearer views for complex cases. Clinicians rely on these tools to interpret conditions with higher confidence. The Advanced Visualization Market benefits from this shift as demand for precision grows. It supports workflows that depend on detailed anatomical scans. Strong uptake in radiology encourages vendors to refine software output. Rising clinical workloads push teams to adopt tools that reduce interpretation time. Higher accuracy strengthens trust in digital imaging upgrades.
- For instance, Canon Medical’s Aquilion Precision CT system achieves a 23 mm spatial resolution, the highest clinical resolution available in CT, enabling unprecedented anatomical detail.
Rising Use Of AI-Integrated Visualization Systems Across Clinical Departments
AI-enabled visualization gains strong traction in major medical centers. Many teams adopt AI features to speed detection tasks and reduce manual review strain. Automated support tools guide clinicians toward faster decisions. The Advanced Visualization Market moves forward with wider AI integration. It improves recognition of subtle structures in CT, MRI, and ultrasound. Strong vendor focus on intelligent automation expands system utility. Hospitals aim to reduce diagnostic variation through consistent image review. AI adoption encourages teams to refine quality standards for routine imaging.
Increasing Demand For Workflow Optimization In High-Volume Imaging Facilities
High-volume imaging centers deploy advanced tools to streamline their daily workload. Many facilities manage large case loads and require faster processing. It helps teams cut review delays and maintain steady throughput. The Advanced Visualization Market aligns with goals to improve efficiency. Tools with automated reconstruction support quicker case completion. Strong integration with PACS and RIS strengthens workflow speed. Departments reduce reporting gaps through smoother data exchange. Faster turnaround enhances patient management in busy diagnostic environments.
Growing Adoption Of Visualization Platforms In Minimally Invasive Procedures
Minimally invasive procedures rely on strong visualization support to guide clinical actions. Surgeons use detailed images to plan interventions and reduce procedural risk. Many operating rooms upgrade their systems to support real-time clarity. The Advanced Visualization Market gains momentum through this shift. It enables surgical teams to monitor progress with greater control. Integration with robotic surgical systems elevates precision. Hospitals value platforms that support multiple procedural requirements. Strong focus on safety drives deeper investment in advanced imaging tools.
- For instance, Intuitive’s da Vinci Xi system provides 10× optical magnification and high-definition 3D visualization, improving surgeon accuracy during complex robotic procedures.
Advanced Visualization Market Trends
Expansion Of Cloud-Based Visualization Platforms Across Healthcare Networks
Cloud adoption rises as hospitals seek flexible deployment models. Many networks shift toward remote access tools that support faster collaboration. It enables clinicians to view complex scans from any location. The Advanced Visualization Market adapts to this need through strong cloud expansion. Vendors improve security layers to protect patient data during transfer. Multisite networks rely on cloud access to support shared diagnostics. Remote review workflows gain acceptance across large systems. Cloud scalability supports long-term imaging demand.
- For instance, Sectra’s Cloud PACS operates with a documented 9% uptime SLA, ensuring stable remote access across enterprise imaging networks.
Integration Of Multi-Modality Imaging For Comprehensive Case Assessment
Healthcare teams increase the use of multi-modality workflows for complex cases. Many platforms merge CT, MRI, PET, and ultrasound views into unified dashboards. It supports stronger assessment by combining functional and anatomical detail. The Advanced Visualization Market moves toward deeper fusion capability. Clinicians value systems that reduce the need for multiple review sessions. Vendors refine algorithms that align images with higher precision. Multi-modality insights improve treatment planning in oncology and cardiology. Demand rises for platforms that manage complex data loads.
Growing Use Of Advanced Visualization In Predictive And Personalized Care Models
Predictive care gains attention due to rising interest in early disease detection. Visualization tools support risk modeling through detailed imaging cues. It helps clinicians predict disease progression with higher certainty. The Advanced Visualization Market aligns with these frameworks. Many teams apply visualization outputs to guide personalized treatment paths. Integration with clinical decision systems strengthens adoption. Analysts view this trend as a major shift toward proactive care. Imaging insights support more accurate long-term planning.
Adoption Of Real-Time Rendering And Faster Processing Engines In Diagnostic Imaging
Diagnostic departments prioritize speed to reduce patient waiting time. Many vendors introduce faster rendering engines to meet this need. It enables near real-time interaction with complex scans. The Advanced Visualization Market sees rising interest in these upgrades. Clinicians gain smoother manipulation of large datasets during review. Engineers refine GPU acceleration to cut processing delays. High-speed tools support urgent care settings with rapid diagnostic output. Market players invest in performance enhancements to meet rising demand.
- For instance, NVIDIA Clara Holoscan delivers sub-50 ms latency for real-time surgical and imaging applications, enabling smooth visualization of large datasets.
Advanced Visualization Market Challenges Analysis
High System Costs And Complex Integration Requirements Across Healthcare Settings
Hospitals face difficulty managing costs linked to high-end visualization platforms. Many systems require strong hardware, which raises financial pressure. It leads some providers to delay adoption in lower-budget regions. The Advanced Visualization Market experiences slower uptake in cost-sensitive areas. Integration with existing IT structures increases implementation time. Teams often handle training needs that extend the transition period. Healthcare networks work to balance performance and budget. Vendors continue refining solutions to ease compatibility concerns.
Limited Standardization And Rising Data Management Complexity Across Imaging Departments
Healthcare facilities manage diverse imaging modalities with varying data formats. Teams struggle to maintain consistent visualization output across systems. It creates gaps in diagnostic consistency across departments. The Advanced Visualization Market faces complexity linked to fragmented standards. Many facilities need strong data pipelines to support smooth workflows. Storage and retrieval tasks become difficult when imaging volumes rise. IT teams invest time in maintaining system health. Vendors work to improve interoperability across varied imaging environments.
Advanced Visualization Market Opportunities
Growing Demand For Advanced Tools In Emerging Healthcare Markets With Expanding Imaging Capacity
Emerging regions upgrade diagnostic infrastructure to support wider patient access. Many countries increase imaging capacity across public and private hospitals. It encourages providers to adopt advanced platforms for stronger clinical output. The Advanced Visualization Market gains new growth lanes through this shift. Vendors target regions seeking modern digital imaging ecosystems. Facilities look for tools that strengthen diagnostic confidence. Adoption grows where healthcare networks modernize equipment. Local distributors expand support to accelerate market entry.
Expansion Of AI-Driven Visualization Platforms Supporting Precision Medicine Programs
Precision medicine initiatives gain strong support across major healthcare systems. Visualization outputs help clinicians assess disease markers with greater clarity. It supports programs focused on tailored treatment planning. The Advanced Visualization Market benefits from deeper AI integration. Hospitals invest in platforms that enhance predictive accuracy. Research centers rely on advanced tools for high-volume studies. Growth potential increases where AI becomes a core clinical asset. Vendors highlight solutions that align imaging with precision care goals.
Advanced Visualization Market Segmentation Analysis:
By Visualization Type
The Advanced Visualization Market expands through strong use of 2D, 3D, and 4D tools in diagnostic, engineering, and simulation workflows. Healthcare teams rely on 2D and 3D formats for faster review, while 4D visualization supports motion-based assessment in cardiology and surgery. AR platforms gain traction in training, procedural guidance, and design tasks. VR strengthens adoption in simulation, remote collaboration, and immersive learning. It enhances clarity across complex datasets and improves decision-making in high-accuracy environments. Strong performance across all formats supports wide integration.
By Industry
The Advanced Visualization Market sees strongest demand from healthcare, where imaging volumes rise across radiology, oncology, and surgery. Manufacturing uses these tools for design validation, prototyping, and quality inspection. Aerospace and defense apply visualization in simulation, mission planning, and engineering review. Media and entertainment drive demand for high-end rendering across animation, VFX, and virtual production. Retail deploys visualization for merchandising and store planning, while telecom firms use it for network mapping. It finds expanding use in education and automotive under the Others category.
By Deployment Model
The Advanced Visualization Market shifts toward cloud-based deployment due to stronger collaboration needs and scalable processing. On-premises systems remain important for high-security environments and facilities prioritizing local control. Hybrid deployment gains acceptance where organizations balance cloud flexibility with internal data policies. Many enterprises choose hybrid setups to store sensitive data locally while using remote rendering for peak workloads. It supports broad adoption across mixed infrastructure models and enables smoother transitions in digital transformation programs.
- For instance, Siemens Healthineers’ syngo Carbon platform supports hybrid deployments with unified data access across more than 500 imaging formats.
By Data Type
The Advanced Visualization Market works across structured, unstructured, and big data environments. Structured data supports integration with EHRs, databases, and enterprise systems. Unstructured data drives strong demand due to large imaging files, multimedia content, and simulation outputs. Big data gains importance in research centers, telecom networks, and large hospitals that manage high-volume imaging archives. It enables teams to extract insights from complex datasets and strengthens performance across predictive modeling, planning, and operational analysis.
By Solution Type
The Advanced Visualization Market includes standalone software, integrated platforms, and services. Standalone tools support targeted use cases in diagnostic imaging, engineering review, and simulation. Integrated platforms gain traction where organizations need unified workflows across PACS, RIS, and enterprise systems. Services play a vital role in consulting, deployment, training, and managed support. It helps users adopt advanced solutions with minimal disruption and supports continuous improvements in system performance.
- For instance, TeraRecon’s Intuition platform integrates with over 800 hospital systems globally and supports AI-driven automation that reduces manual contouring time by up to 70%.
Advanced Visualization Market Segmentation:
By Visualization Type
- 2D Visualization
- 3D Visualization
- 4D Visualization
- Augmented Reality (AR) Visualization
- Virtual Reality (VR) Visualization
By Industry
- Healthcare
- Manufacturing
- Aerospace & Defense
- Media & Entertainment
- Retail
- Telecommunications
- Others
By Deployment Model
- On-Premises
- Cloud-Based
- Hybrid Deployment
By Data Type
- Structured Data
- Unstructured Data
- Big Data
By Solution Type
- Standalone Software
- Integrated Visualization Platforms
- Services
By Region
- North America
- U.S.
- Canada
- Mexico
- Europe
- Germany
- France
- U.K.
- Italy
- Spain
- Rest of Europe
- Asia Pacific
- China
- Japan
- India
- South Korea
- South-east Asia
- Rest of Asia Pacific
- Latin America
- Brazil
- Argentina
- Rest of Latin America
- Middle East & Africa
- GCC Countries
- South Africa
- Rest of the Middle East and Africa
Regional Analysis:
North America holds the dominant share of the Advanced Visualization Market with nearly 38%, supported by advanced healthcare infrastructure, strong imaging volumes, and rapid adoption of AI-enabled visualization systems. The region benefits from high investment in diagnostic imaging, surgical navigation, and enterprise visualization platforms. Many hospitals deploy cloud-based visualization to improve workflow efficiency. The region maintains strong reimbursement support for advanced imaging procedures. It continues to lead global innovation activity through major OEMs and research institutions. Strong digital maturity strengthens technology uptake across both clinical and enterprise settings.
Europe follows with roughly 27% of global share, driven by expanding digital health programs, structured imaging networks, and strong regulatory support for precision diagnostics. Many countries invest in interoperable visualization platforms to support cross-border data exchange. Hospitals upgrade PACS, RIS, and surgical imaging suites to meet rising demand for 3D and 4D visualization. The region benefits from established radiology networks that encourage wide use of advanced tools. It supports structured adoption across oncology, cardiology, and neurology workflows. The Advanced Visualization Market in Europe maintains steady expansion through technology modernization.
Asia-Pacific secures close to 25% of market share and demonstrates the fastest growth due to rapid healthcare infrastructure upgrades. Emerging economies increase imaging capacity across public and private hospitals. It sees rising use of visualization tools in surgical planning, telemedicine, and medical training. Strong government support for digital health accelerates platform adoption. The region benefits from expanding manufacturing and aerospace sectors that deploy visualization in design and simulation. Latin America and the Middle East & Africa together account for about 10%, supported by gradual modernization efforts and rising demand for digital imaging capabilities.
Key Player Analysis:
- GE Healthcare
- Siemens Healthineers
- Canon Medical Systems
- Fujifilm Holdings Corporation
- Koninklijke Philips N.V.
- Agfa-Gevaert Group
- Carestream Health
- Ziosoft
- Visage Imaging
- Pro Medicus Ltd.
- TeraRecon Inc.
- Sectra
- Hitachi Medical Systems
- Toshiba Medical Systems
- Stryker
Competitive Analysis:
The Advanced Visualization Market features a competitive landscape shaped by global OEMs, specialized software vendors, and platform integrators. Leading companies strengthen their presence through AI integration, cloud-based deployments, and multi-modality visualization tools. The market includes GE Healthcare, Siemens Healthineers, Canon Medical Systems, Fujifilm, Philips, Agfa, Carestream, TeraRecon, Ziosoft, Pro Medicus, Visage Imaging, Hitachi, Toshiba Medical Systems, Sectra, and Stryker. It evolves through continuous upgrades to rendering engines, workflow orchestration tools, and enterprise interoperability features. Vendors compete by offering faster processing, improved image fusion, and broader integration with PACS and EMR systems. Partnerships with hospitals and research institutions strengthen product validation. Pricing strategies, service quality, and deployment flexibility influence buying decisions across regions.
Recent Developments:
- In March 2025, GE HealthCare expanded its NVIDIA partnership to develop AI-driven autonomous X-ray and ultrasound solutions, reducing workloads for technologists in advanced imaging contexts.
- In February 2026, GE HealthCare announced a $35 million collaboration with BARDA focusing on AI-powered ultrasound developments that support advanced visualization capabilities.
Report Coverage:
The research report offers an in-depth analysis based on Visualization Type, Industry, Deployment Model, Data Type, and Solution Type. It details leading market players, providing an overview of their business, product offerings, investments, revenue streams, and key applications. Additionally, the report includes insights into the competitive environment, SWOT analysis, current market trends, as well as the primary drivers and constraints. Furthermore, it discusses various factors that have driven market expansion in recent years. The report also explores market dynamics, regulatory scenarios, and technological advancements that are shaping the industry. It assesses the impact of external factors and global economic changes on market growth. Lastly, it provides strategic recommendations for new entrants and established companies to navigate the complexities of the market.
Future Outlook:
- Wider use of AI-driven visualization will strengthen diagnostic accuracy and expand adoption across clinical and enterprise settings in the Advanced Visualization Market.
- Rising demand for real-time rendering will support faster decision cycles in surgical planning, radiology, aerospace design, and industrial engineering.
- Cloud-based platforms will scale further, enabling remote collaboration and multisite visualization workflows across global networks.
- Expansion of AR and VR tools will support immersive training, pre-operative assessment, simulation, and high-complexity design environments.
- Growth in multimodality imaging will drive deeper integration of CT, MRI, PET, and ultrasound within unified visualization ecosystems.
- Strong uptake in emerging regions will increase platform penetration due to ongoing healthcare investments and digital transformation policies.
- Hybrid deployment models will gain momentum among organizations balancing data control, cost efficiency, and workload flexibility.
- Big data analytics will enhance insight extraction from large imaging repositories and support advanced predictive care models.
- Visualization platforms will evolve toward modular designs that support interoperability across PACS, EMR, and enterprise engineering systems.
- Service expansion through training, consulting, and workflow optimization will help users maximize platform value and improve system performance.
Request a Free Sample
Fill in your details and we'll send you a free sample report.
- Sample data tables & charts
- Research methodology
Need a Custom Version of This Report?
Tailor the scope, geography, or segments to your exact requirements.
- Custom geography or segment scope
- Direct access to our analyst team
Frequently Asked Questions
What is the current market size for the Advanced Visualization Market, and what is its projected size in 2032?
At what Compound Annual Growth Rate is the Advanced Visualization Market projected to grow between 2025 and 2032?
Which Advanced Visualization Market segment held the largest share in 2025?
What are the primary factors fueling the growth of the Advanced Visualization Market?
Who are the leading companies in the Advanced Visualization Market?
Which region commanded the largest share of the Advanced Visualization Market in 2025?
Table of Content
Chapter 1. Report Introduction
- 1.1 Report Description & Purpose
- 1.1.1 Report Title & Market Definition
- 1.1.2 Unique Selling Propositions (USP) & Key Differentiators
- 1.1.3 Value Proposition for Stakeholders
- 1.2 Research Objectives
- 1.2.1 Market Sizing Objectives (Volume & Revenue)
- 1.2.2 Segmentation Objectives
- 1.2.3 Competitive Intelligence Objectives
- 1.2.4 Forecast & Scenario Objectives
- 1.3 Report Scope
- 1.3.1 Advanced Visualization Scope – Types & Subtypes Covered
- 1.3.2 Geographic Scope – Regions & Countries Covered
- 1.3.3 Historical Period, Base Year & Forecast Period (2025; forecast to 2032)
- 1.3.4 Inclusions & Exclusions
- 1.4 HS Code & Classification Framework
- 1.5 Currency, Units & Pricing Basis
- 1.6 Target Stakeholders
- 1.7 Limitations & Assumptions
Chapter 2. Executive Summary
- 2.1 Global Advanced Visualization Market Snapshot
- 2.1.1 Market Size – Historical (2025) & Forecast (2025-2032) (2025: USD 4,200.76 million → 2032: USD 9,000.2 million)
- 2.1.2 Volume & Revenue – Global Totals
- 2.1.3 Key Market Highlights – Top Five Facts
- 2.2 Advanced Visualization Market Segmentation Snapshot
- 2.2.1 Market Split by Region – 2025 vs. 2032
- 2.3 Competitive Snapshot
- 2.3.1 Top 10 Players by Revenue Share – 2025
- 2.3.2 Top 10 Players by Volume Share – 2025
- 2.3.3 Recent Strategic Developments (18-Month Summary)
- 2.4 Key Investment Highlights & Strategic Conclusions
Chapter 3. Advanced Visualization Market Dynamics & Industry Analysis
- 3.1 Market Overview & Context
- 3.1.1 Advanced Visualization Market Position in the Broader Automotive Value Chain
- 3.1.2 OEM vs. Replacement Market Dynamics
- 3.1.3 Market Maturity & Development Stage by Region
- 3.2 Advanced Visualization Market Drivers
- 3.3 Advanced Visualization Market Restraints & Challenges
- 3.4 Advanced Visualization Market Opportunities
- 3.5 Porter's Five Forces Analysis
- 3.5.1 Threat of New Entrants
- 3.5.2 Bargaining Power of Suppliers
- 3.5.3 Bargaining Power of Buyers
- 3.5.4 Threat of Substitutes
- 3.5.5 Competitive Rivalry – Intensity Assessment
- 3.6 Advanced Visualization Value Chain Analysis
- 3.6.1 Upstream – Raw Material/Input Suppliers
- 3.6.1.1 Raw Material/Input 1
- 3.6.1.2 Raw Material/Input 2
- 3.6.1.3 Raw Material/Input 3
- 3.6.2 Midstream – Production/Manufacturing/Service Delivery
- 3.6.2.1 Production/Process Overview
- 3.6.2.2 Key Facility Locations & Capacity by Manufacturer
- 3.6.3 Downstream – Distribution & End Consumer
- 3.6.3.1 Primary Channel – B2B/OEM
- 3.6.3.2 Secondary Channels – Dealer, Retail, Online, Direct
- 3.6.4 Value Chain Profitability Analysis
- 3.6.1 Upstream – Raw Material/Input Suppliers
- 3.7 PESTEL Analysis
- 3.7.1 Political Factors
- 3.7.2 Economic Factors
- 3.7.3 Social Factors
- 3.7.4 Technological Factors
- 3.7.5 Environmental Factors
- 3.7.6 Legal Factors
- 3.8 Advanced Visualization Supply Chain Analysis
- 3.8.1 Raw Material/Input Supply Risk Assessment
- 3.8.2 Manufacturing Concentration Risk (Geographic Exposure)
- 3.8.3 Trade Disruption Impact Analysis
- 3.9 Regulatory & Policy Landscape
Note: The regulatory and policy landscape section covers regulations based on their applicability to the market, Advanced Visualization category, geography, and scope of the study. Only regulatory frameworks with a material impact on operations, compliance, trade, sustainability, or market access are analyzed in detail.
Chapter 4. Key Investment Pockets & Opportunity Analysis
- 4.1 Advanced Visualization Market Attractiveness Analysis
- 4.1.1 By Region – Investment Attractiveness Matrix (Volume × CAGR)
- 4.2 Absolute Revenue Growth Opportunity
- 4.2.1 By Region – Absolute USD Growth Through 2032
- 4.3 Incremental Volume Opportunity
- 4.3.1 By Region – Incremental Volume Through 2032
- 4.3.2 Segment – Incremental Volume
- 4.4 Emerging Submarket Opportunity Deep Dive (Subject to Applicability)
- 4.5 Emerging Market Opportunity Scorecards
- 4.5.1 United States
- 4.5.2 Europe
- 4.5.3 Asia
- 4.5.4 Middle East & Africa
Note: Emerging Market Opportunity Scorecards will be included based on relevance and strategic importance. Regions listed are indicative and may vary depending on data availability and market dynamics.
Chapter 5. Advanced Visualization Import-Export Analysis & Trade Flows
- 5.1 Global Trade Overview
- 5.1.1 Global Export Value by Country (2025)
- 5.1.2 Global Export Volume by Country (2025)
- 5.1.3 Global Import Value by Country (2025)
- 5.1.4 Global Import Volume by Country (2025)
- 5.1.5 Net Trade Balance by Country (2025)
- 5.2 Export Analysis – Segment
- 5.2.1 Type 1 (HS Code)
- 5.2.2 Type 2 (HS Code)
- 5.2.3 Type 3 (HS Code)
- 5.2.4 Type 4 (HS Code)
- 5.2.5 Type 5 (HS Code)
- 5.3 Import Analysis – Segment
- 5.3.1 Type 1 (HS Code)
- 5.3.2 Type 2 (HS Code)
- 5.3.3 Type 3 (HS Code)
- 5.3.4 Type 4 (HS Code)
- 5.3.5 Type 5 (HS Code)
- 5.4 Average Unit Trade Prices
- 5.4.1 Average Export Price – Segment & Country
- 5.4.2 Average Import Price – Segment & Source Country
- 5.4.3 Price Trends (2025)
- 5.5 Key Trade Route Analysis
- 5.5.1 Trade Route 1
- 5.5.2 Trade Route 2
- 5.5.3 Trade Route 3
- 5.5.4 Trade Route 4
- 5.5.5 Trade Route 5
- 5.6 Trade Policy Impact Assessment
- 5.6.1 US Anti-Dumping & Section 301 Tariffs
- 5.6.2 EU Customs Union Impact
- 5.6.3 Major Free Trade Agreements
- 5.6.4 USMCA Rules of Origin
Note: Trade policy analysis will be included only where relevant to the Advanced Visualization market.
Chapter 6. Competitive Landscape & Company Benchmarking
- 6.1 Advanced Visualization Market Concentration & Structure
- 6.1.1 Herfindahl-Hirschman Index (HHI) – vs. 2025
- 6.1.2 Tier 1, Tier 2 & Tier 3 Market Structure
- 6.1.3 Global, Regional & Local Player Dynamics
- 6.2 Advanced Visualization Market Share Analysis – 2025
- 6.2.1 Global Revenue Share by Company
- 6.2.2 Global Volume Share by Company
- 6.2.3 Regional Revenue Share
- 6.2.4 Market Share Evolution ( vs. 2025)
- 6.2.5 OEM Segment Share by Company
- 6.2.6 Replacement Segment Share by Company
- 6.3 Production/Delivery Capacity & Facility Analysis
- 6.3.1 Global Installed Capacity
- 6.3.2 Capacity Utilization Rates
- 6.3.3 Production/Output Volume
- 6.3.4 Facility Locations & Capacity Map
- 6.3.5 Planned Capacity Additions
- 6.4 Advanced Visualization Competitive Benchmarking Matrix
- 6.4.1 Revenue, Volume, CAGR & Profitability Comparison
- 6.4.2 Channel Revenue Mix
- 6.4.3 Geographic Revenue Exposure
- 6.4.4 R&D Intensity
- 6.4.5 Sustainability Maturity
- 6.5 Strategic Developments in Advanced Visualization (Last 24 Months)
- 6.5.1 Mergers, Acquisitions & Divestments
- 6.5.2 New Advanced Visualization Launches
- 6.5.3 Facility Expansions
- 6.5.4 Strategic Alliances, Joint Ventures & Partnerships
- 6.5.5 Distribution Expansion & Market Entry
- 6.5.6 Sustainability & ESG Initiatives
- 6.6 Competitive Strategy Mapping
- 6.6.1 Leader, Challenger, Follower & Niche Classification
- 6.6.2 Pricing Strategy Comparison
- 6.6.3 Channel Strategy Matrix
Note: Strategic developments are included based on their materiality and the availability of reliable information.
Chapter 7. Global Advanced Visualization Market – By Distribution Channel
- 7.1 Segment Overview
- 7.1.1 Volume & Revenue Split by Channel (2025 & 2032)
- 7.1.2 Channel Mix Evolution (2025-2032)
Chapter 8. Regional Market Analysis – Global Overview
- 8.1 Global Regional Overview
- 8.1.1 Regional Volume Share
- 8.1.2 Regional Revenue Share
- 8.1.3 Regional Volume by Region
- 8.1.4 Regional Revenue by Region
- 8.1.5 Regional Forecast Through 2032
- 8.2 Cross-Regional Segment Analysis
- 8.2.1 By Distribution Channel
- 8.2.2 By Brand/Price Tier
Chapter 9. North America Advanced Visualization Market
- 9.1 United States
- 9.2 Canada
- 9.3 Mexico
Chapter 10. Europe Advanced Visualization Market
- 10.1 Germany
- 10.2 France
- 10.3 Italy
- 10.4 United Kingdom
- 10.5 Spain
- 10.6 Poland
- 10.7 Russia
- 10.8 Netherlands
- 10.9 Belgium
- 10.10 Sweden
- 10.11 Denmark
- 10.12 Norway
- 10.13 Rest of Europe
Chapter 11. Asia Pacific Advanced Visualization Market
- 11.1 China
- 11.2 India
- 11.3 Japan
- 11.4 South Korea
- 11.5 Thailand
- 11.6 Indonesia
- 11.7 Vietnam
- 11.8 Malaysia
- 11.9 Australia
- 11.10 Rest of Asia Pacific
Chapter 12. Latin America Advanced Visualization Market
- 12.1 Brazil
- 12.2 Argentina
- 12.3 Colombia
- 12.4 Chile
- 12.5 Rest of Latin America
Chapter 13. Middle East Advanced Visualization Market
- 13.1 Saudi Arabia
- 13.2 United Arab Emirates
- 13.3 Turkey
- 13.4 Israel
- 13.5 Iran
- 13.6 Rest of the Middle East
Chapter 14. Africa Advanced Visualization Market
- 14.1 South Africa
- 14.2 Egypt
- 14.3 Nigeria
- 14.4 Morocco
- 14.5 Rest of Africa
Chapter 15. Advanced Visualization Company Profiles
- 15.1 [Company 01]
- 15.1.1 Company Overview
- 15.1.2 Key Management Personnel
- 15.1.3 Products & Services Portfolio
- 15.1.4 Financial Performance
- 15.1.5 Key Market Focus & Geographic Presence
- 15.1.6 Recent Developments & Strategic Initiatives
Note: The company profile list is preliminary and may change based on research findings, market developments, data availability, and client requirements.
Chapter 16. Appendices
- Appendix A – List of Abbreviations & Acronyms
- Appendix B – Industry Classification Code Reference – Full Series
- Appendix C – Production & Capacity Data Tables
- Appendix D – End-Use & Demand Base Tables
- Appendix E – Consumption & Replacement Rate Assumptions
- Appendix F – ASP Reference Tables
- Appendix G – Manufacturing & Facility Database
- Appendix H – Import-Export Data Tables
- Appendix I – Regulatory Summary Tables
- Appendix J – Primary Research Participant List (Anonymized)
- Appendix K – Primary Research Questionnaire Framework
- Appendix L – Data Sources & Bibliography
- Appendix M – Market Size Divergence & Source Comparison
Chapter 17. Research Methodology
- 17.1 Research Framework & Philosophy
- 17.2 Secondary Research – Sources, Hierarchy & Data Extraction
- 17.3 Data Modeling – Bottom-Up & Top-Down Market Sizing
- 17.4 Primary Research – Stakeholder Framework, LOI & Sample Sizes
- 17.5 Forecast Methodology – Regression, Scenario & Sensitivity Analysis
- 17.6 Quality Control – Four-Layer Validation Framework
- 17.7 Limitations & Standard Assumptions
- 17.8 Disclaimer
