
Older mothers and funded RhD tests widen cfDNA screening
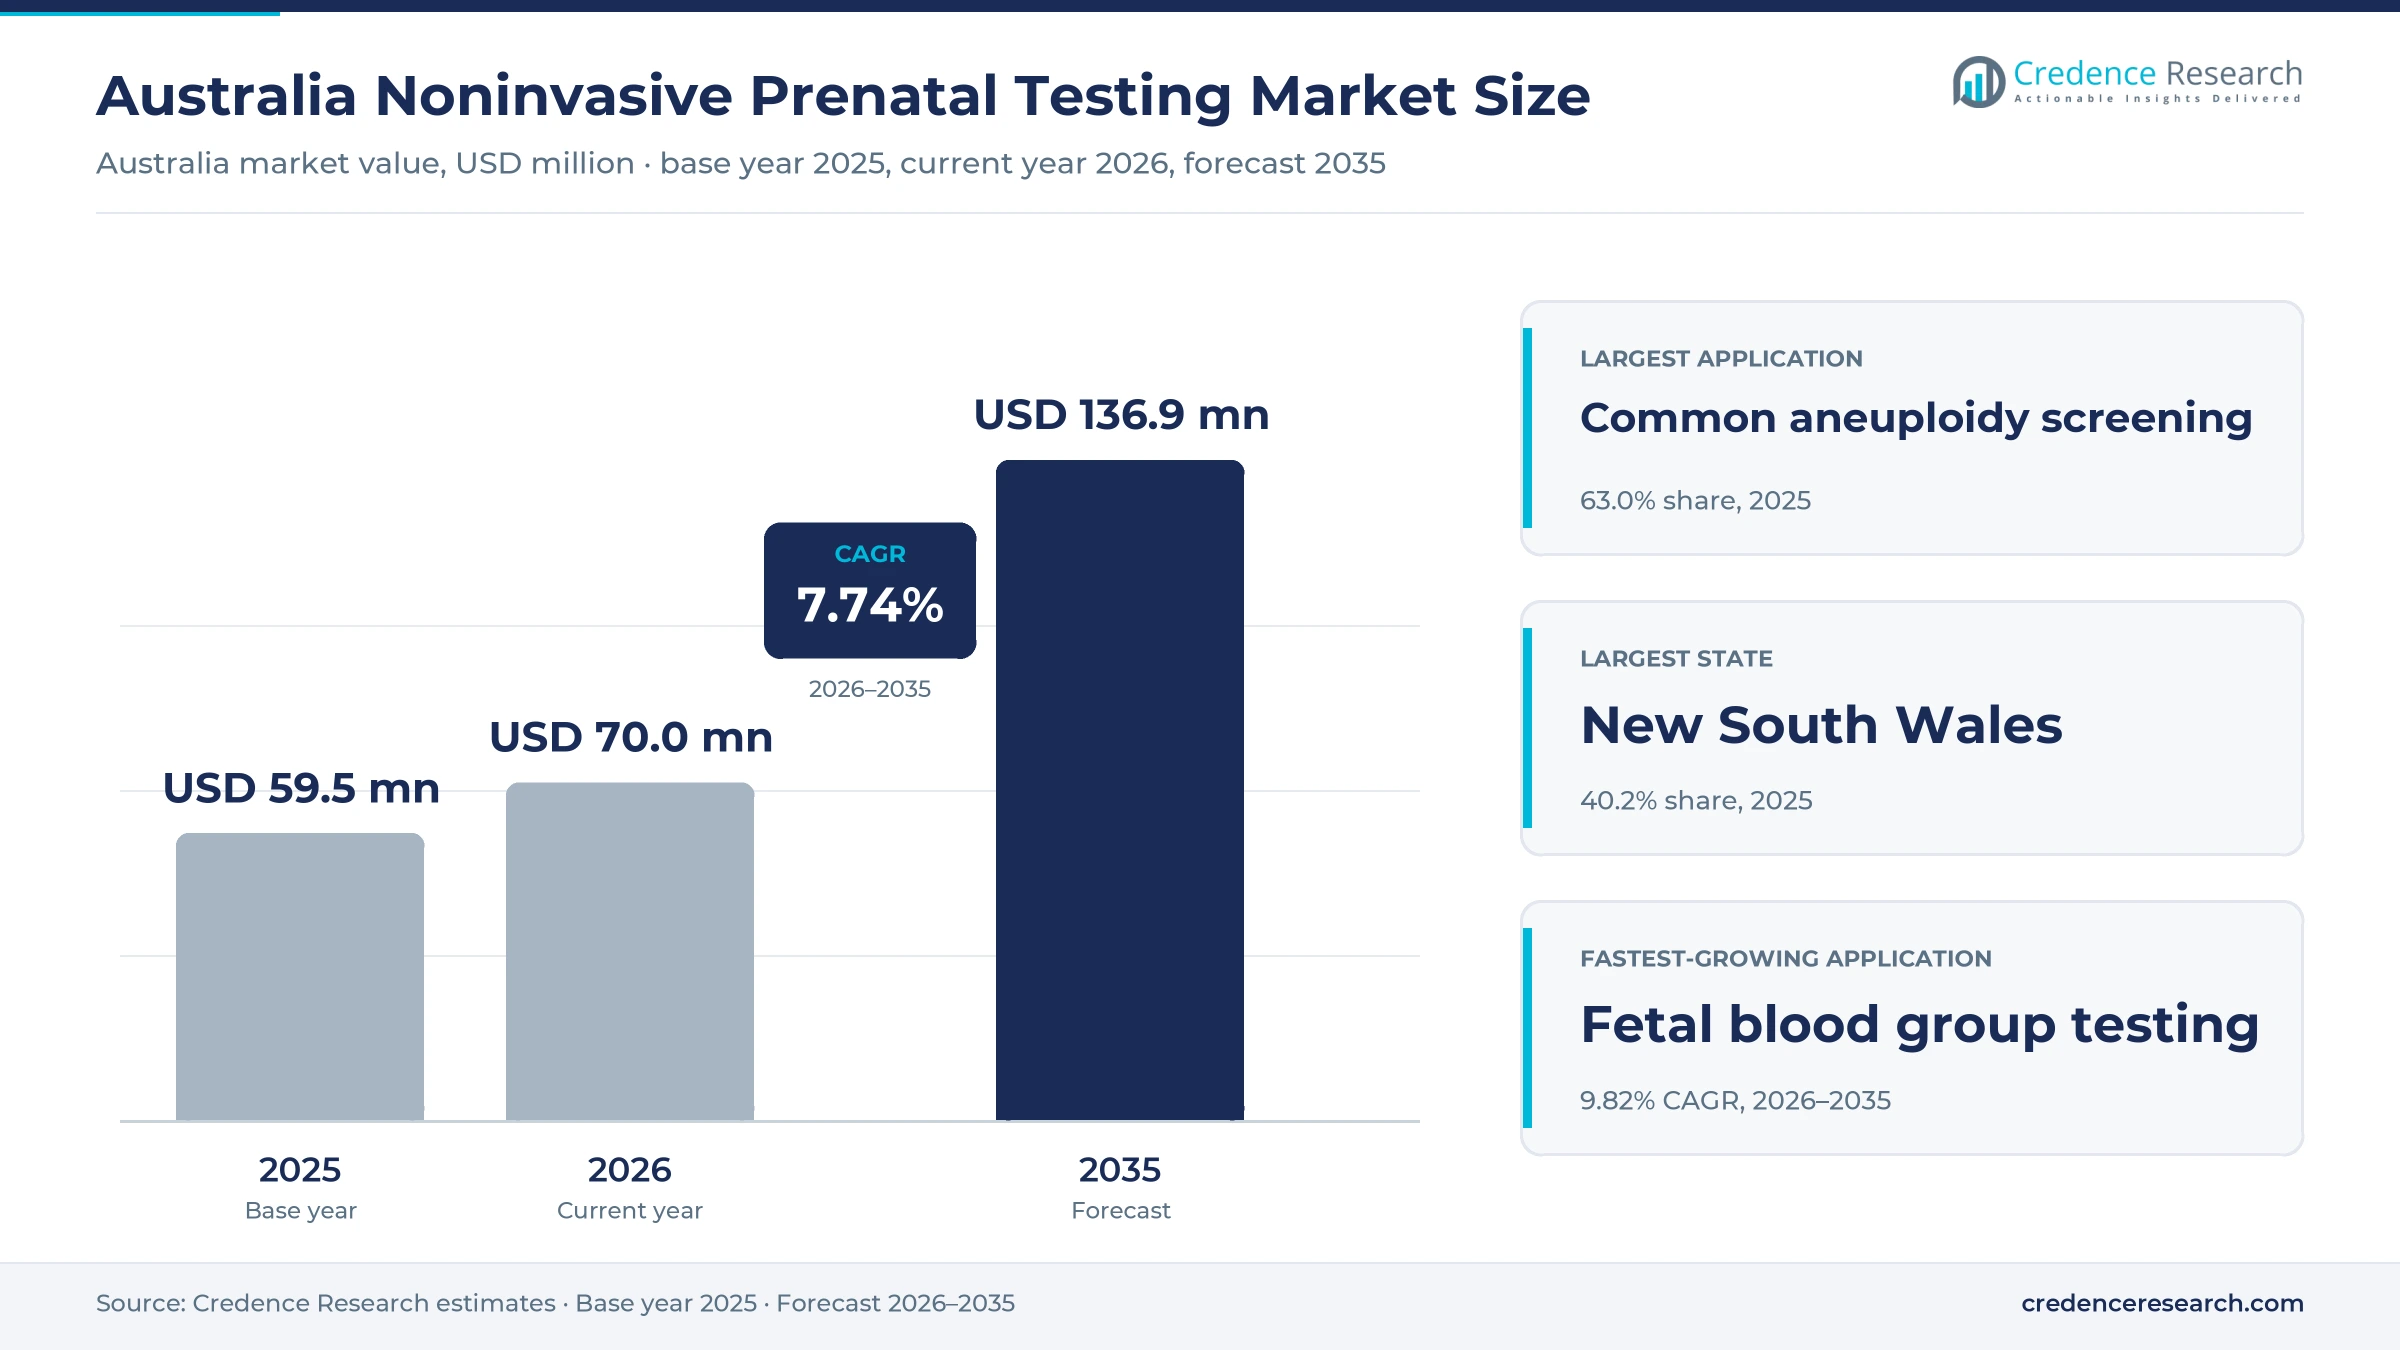
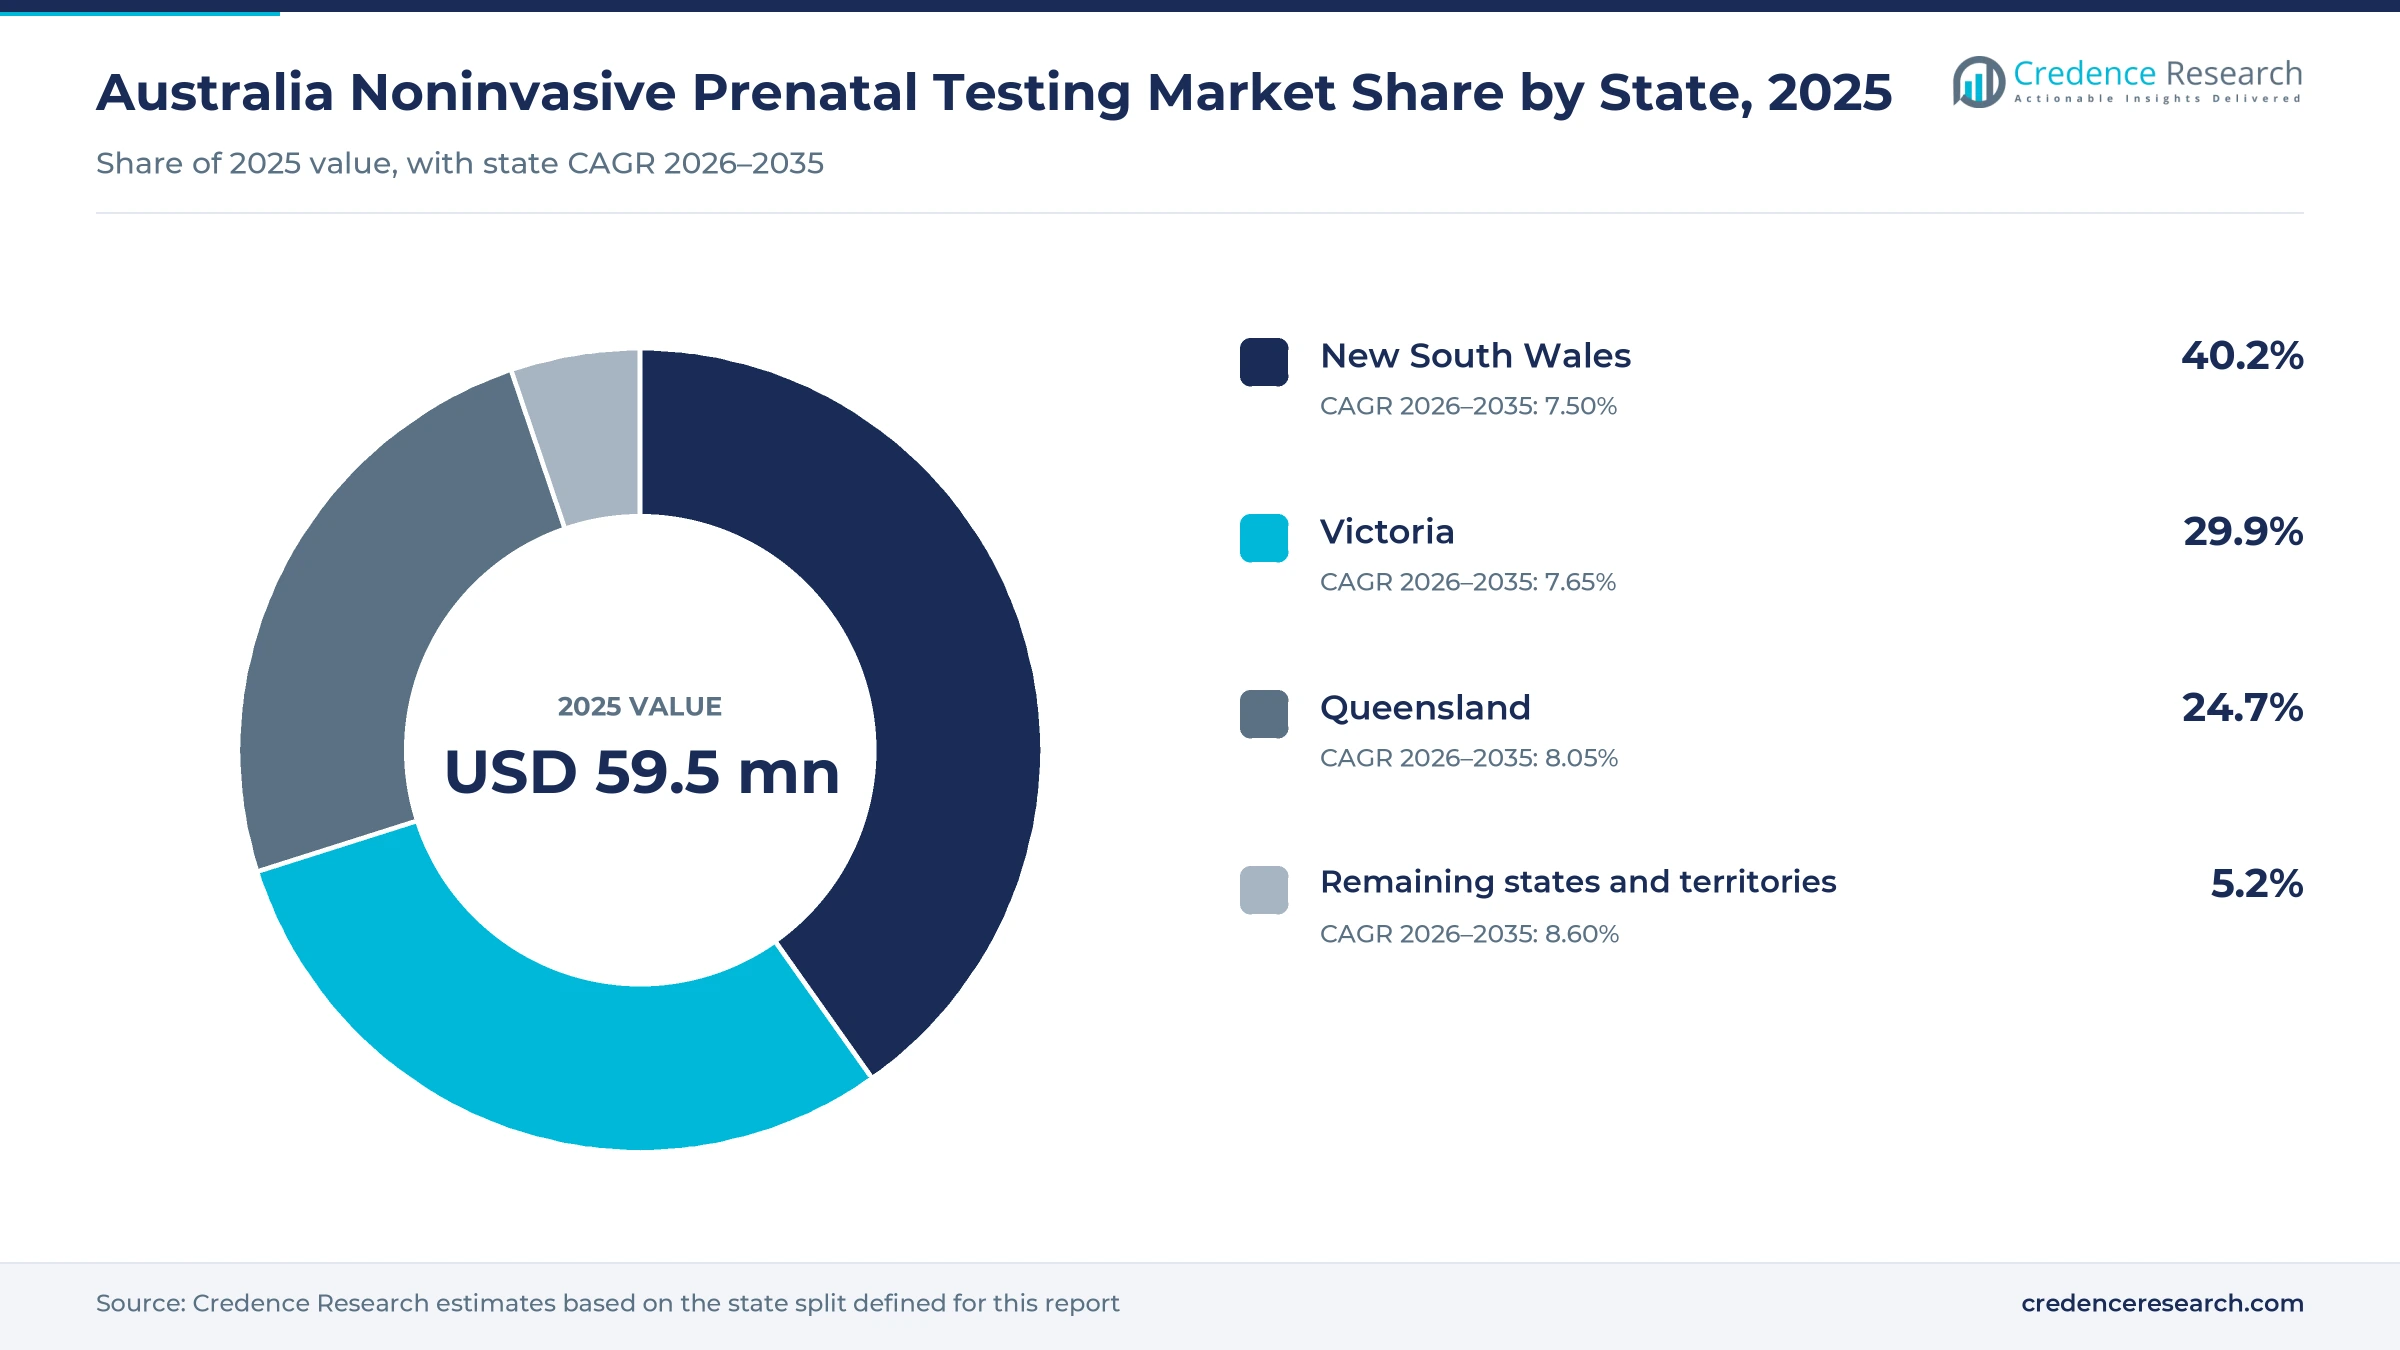
The Australia noninvasive prenatal testing market was valued at USD 59.5 million in 2025 and is projected to increase from USD 70.0 million in 2026 to USD 136.9 million by 2035, registering a CAGR of 7.74% during 2026–2035. Demand comes from older mothers who seek the most accurate first-trimester screen, from obstetricians and general practitioners who now offer cell-free DNA screening ahead of serum-based risk scores, and from a Medicare-funded pathway that predicts fetal RhD status for RhD-negative women. New South Wales held the largest share, 40.2% in 2025, because the state records the most births and hosts large private pathology laboratories. Remaining states and territories form the fastest-growing group at 8.60% a year, as public laboratories in Western Australia add funded RhD testing for local patients. Most chromosome screens remain self-funded, so price, turnaround and bundled genetic counseling decide which laboratory wins each referral.
Which cell-free DNA pregnancy tests does the estimate count?
The estimate counts spending on laboratory tests that analyze cell-free fetal DNA in a pregnant woman's blood to screen for chromosome conditions, predict fetal blood group or assess single-gene conditions in Australia. It includes self-paid chromosome screens, Medicare-billed fetal RhD tests and work performed under hospital or state contracts, whether processed in Australian or overseas laboratories.
The estimate excludes maternal serum screening, nuchal translucency scans, amniocentesis, chorionic villus sampling and newborn screening, as well as the sale of sequencers and reagents to laboratories. The value chain runs from collection centers and fertility clinics through accredited genetics laboratories to the obstetricians, midwives and general practitioners who request the test and explain results.
Australia Noninvasive Prenatal Testing Market Insights
- The Australia noninvasive prenatal testing market was valued at USD 59.5 million in 2025 and is projected to reach USD 136.9 million by 2035, registering a CAGR of 7.74% during 2026–2035.
- New South Wales held a 40.2% share of 2025 value, supported by 86,978 registered births in 2024 and dense private pathology networks.
- Common aneuploidy screening led applications with a 63.0% share of 2025 value, because trisomy 21, 18 and 13 screens form the core self-paid test.
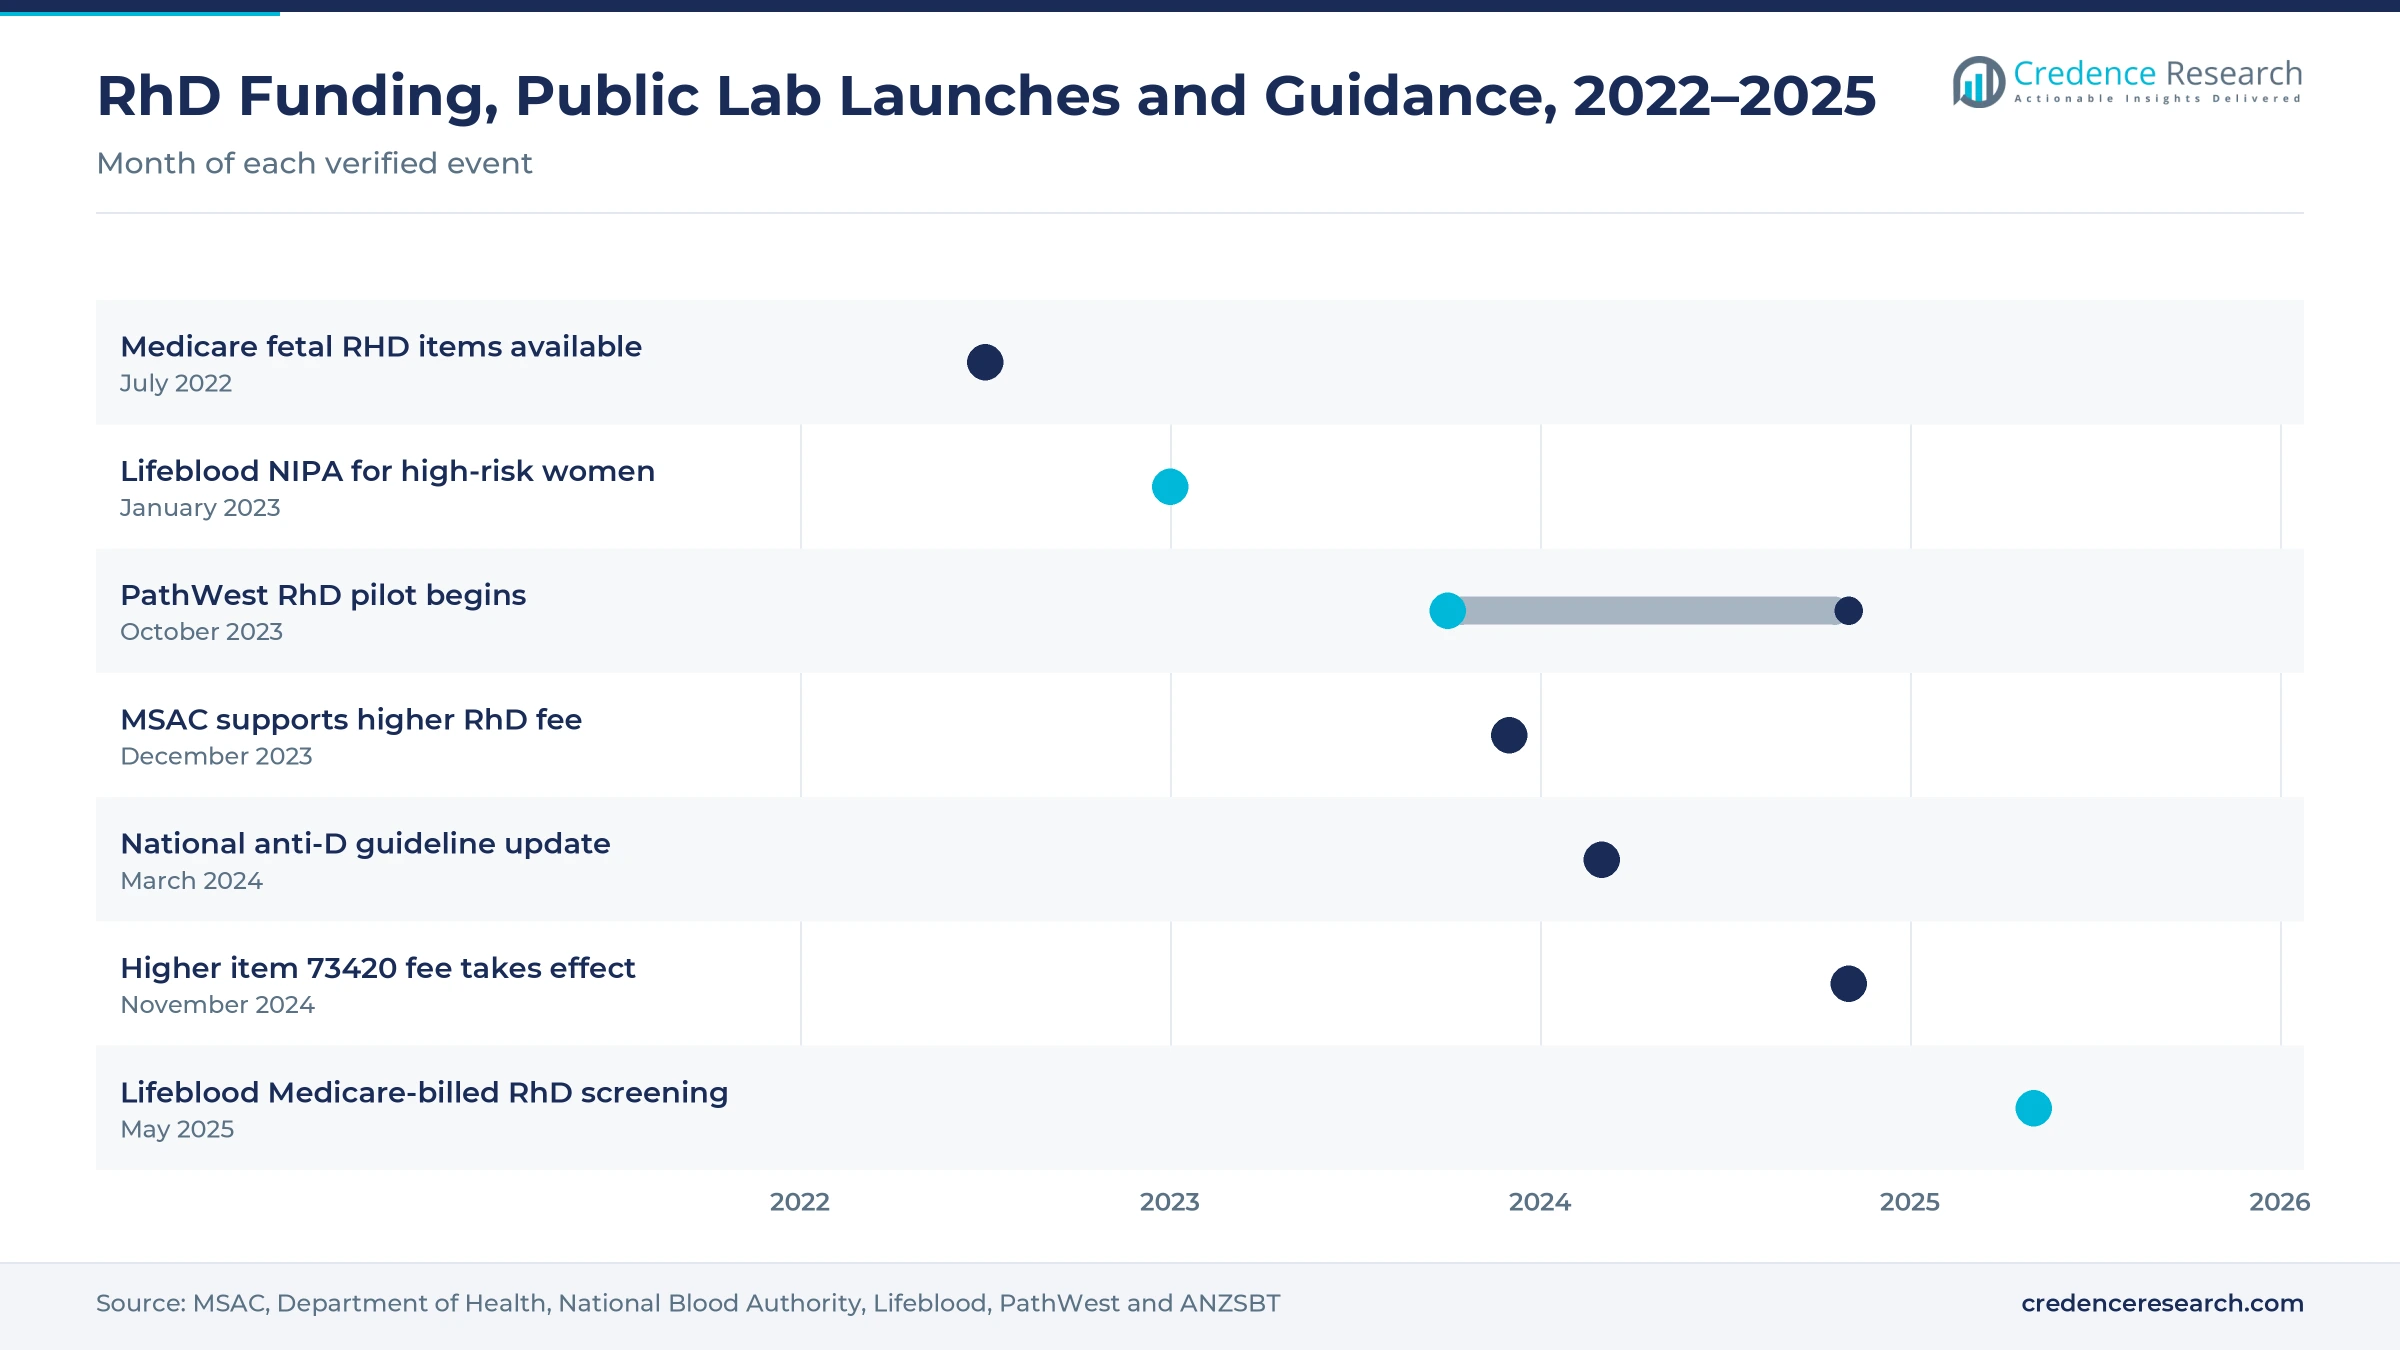
- Australian Red Cross Lifeblood began offering Medicare-billed RhD screening for non-alloimmunized RhD-negative women on May 28, 2025, at no cost to eligible patients.
- Fetal blood group testing grows fastest among applications at 9.82% a year during 2026–2035, as funded RhD prediction replaces blanket anti-D prophylaxis.
Aneuploidy screens lead while fetal RhD tests grow fastest
Why does common aneuploidy screening hold the largest share?
Based on application, the market is categorized into Common aneuploidy screening, Expanded chromosomal screening, Fetal blood group testing and Monogenic prenatal testing. Common aneuploidy screening led with a 63.0% share of 2025 value, because screens for trisomy 21, 18 and 13 are the standard self-paid test. Fetal blood group testing grows fastest at 9.82% a year, as Medicare-funded RhD prediction reaches more RhD-negative women.
Which laboratory methods dominate cell-free DNA screening?
Based on technology, the market is categorized into Chromosome-counting sequencing, Targeted chromosomal assays and Fetal genotyping assays. Chromosome-counting sequencing led with a 68.0% share of 2025 value, because most Australian laboratories run whole-genome counting methods that also support genome-wide options. Fetal genotyping assays grow fastest at 9.23% a year, as quantitative PCR methods for fetal RHD spread from one national service to public and private laboratories.
How do pregnancy risk groups shape test volumes?
Based on customer type, the market is categorized into Routine-risk pregnancies, Elevated-risk pregnancies and RhD-negative pregnancies. Routine-risk pregnancies led with a 64.0% share of 2025 value, because clinicians now offer cell-free DNA screening as a first-line option rather than only after a high serum risk score. RhD-negative pregnancies grow fastest at 9.29% a year, as national guidance supports fetal RHD testing for every RhD-negative woman.
Who pays for cell-free DNA screening in Australia?
Based on revenue model, the market is categorized into Patient self-pay, Medicare-funded and Institutional contracts. Patient self-pay led with 80.0% of 2025 value, because chromosome screens carry no Medicare rebate and patients pay the laboratory directly. Medicare-funded work grows fastest at 9.64% a year, as more RhD tests are billed to Medicare and a wider subsidy remains under debate alongside reproductive carrier screening items.
| Segment Group | Leading Sub-segment | Share, 2025 | Fastest-growing Sub-segment | CAGR, 2026–2035 |
|---|---|---|---|---|
| By Application | Common aneuploidy screening | 63.0% | Fetal blood group testing | 9.82% |
| By Technology | Chromosome-counting sequencing | 68.0% | Fetal genotyping assays | 9.23% |
| By Customer Type | Routine-risk pregnancies | 64.0% | RhD-negative pregnancies | 9.29% |
| By Revenue Model | Patient self-pay | 80.0% | Medicare-funded | 9.64% |
Request a Free Sample
Fill in your details and we'll send you a free sample report.
- Sample data tables & charts
- Research methodology
Maternal age, serum test substitution and RhD funding
Why do older mothers keep screening demand rising?
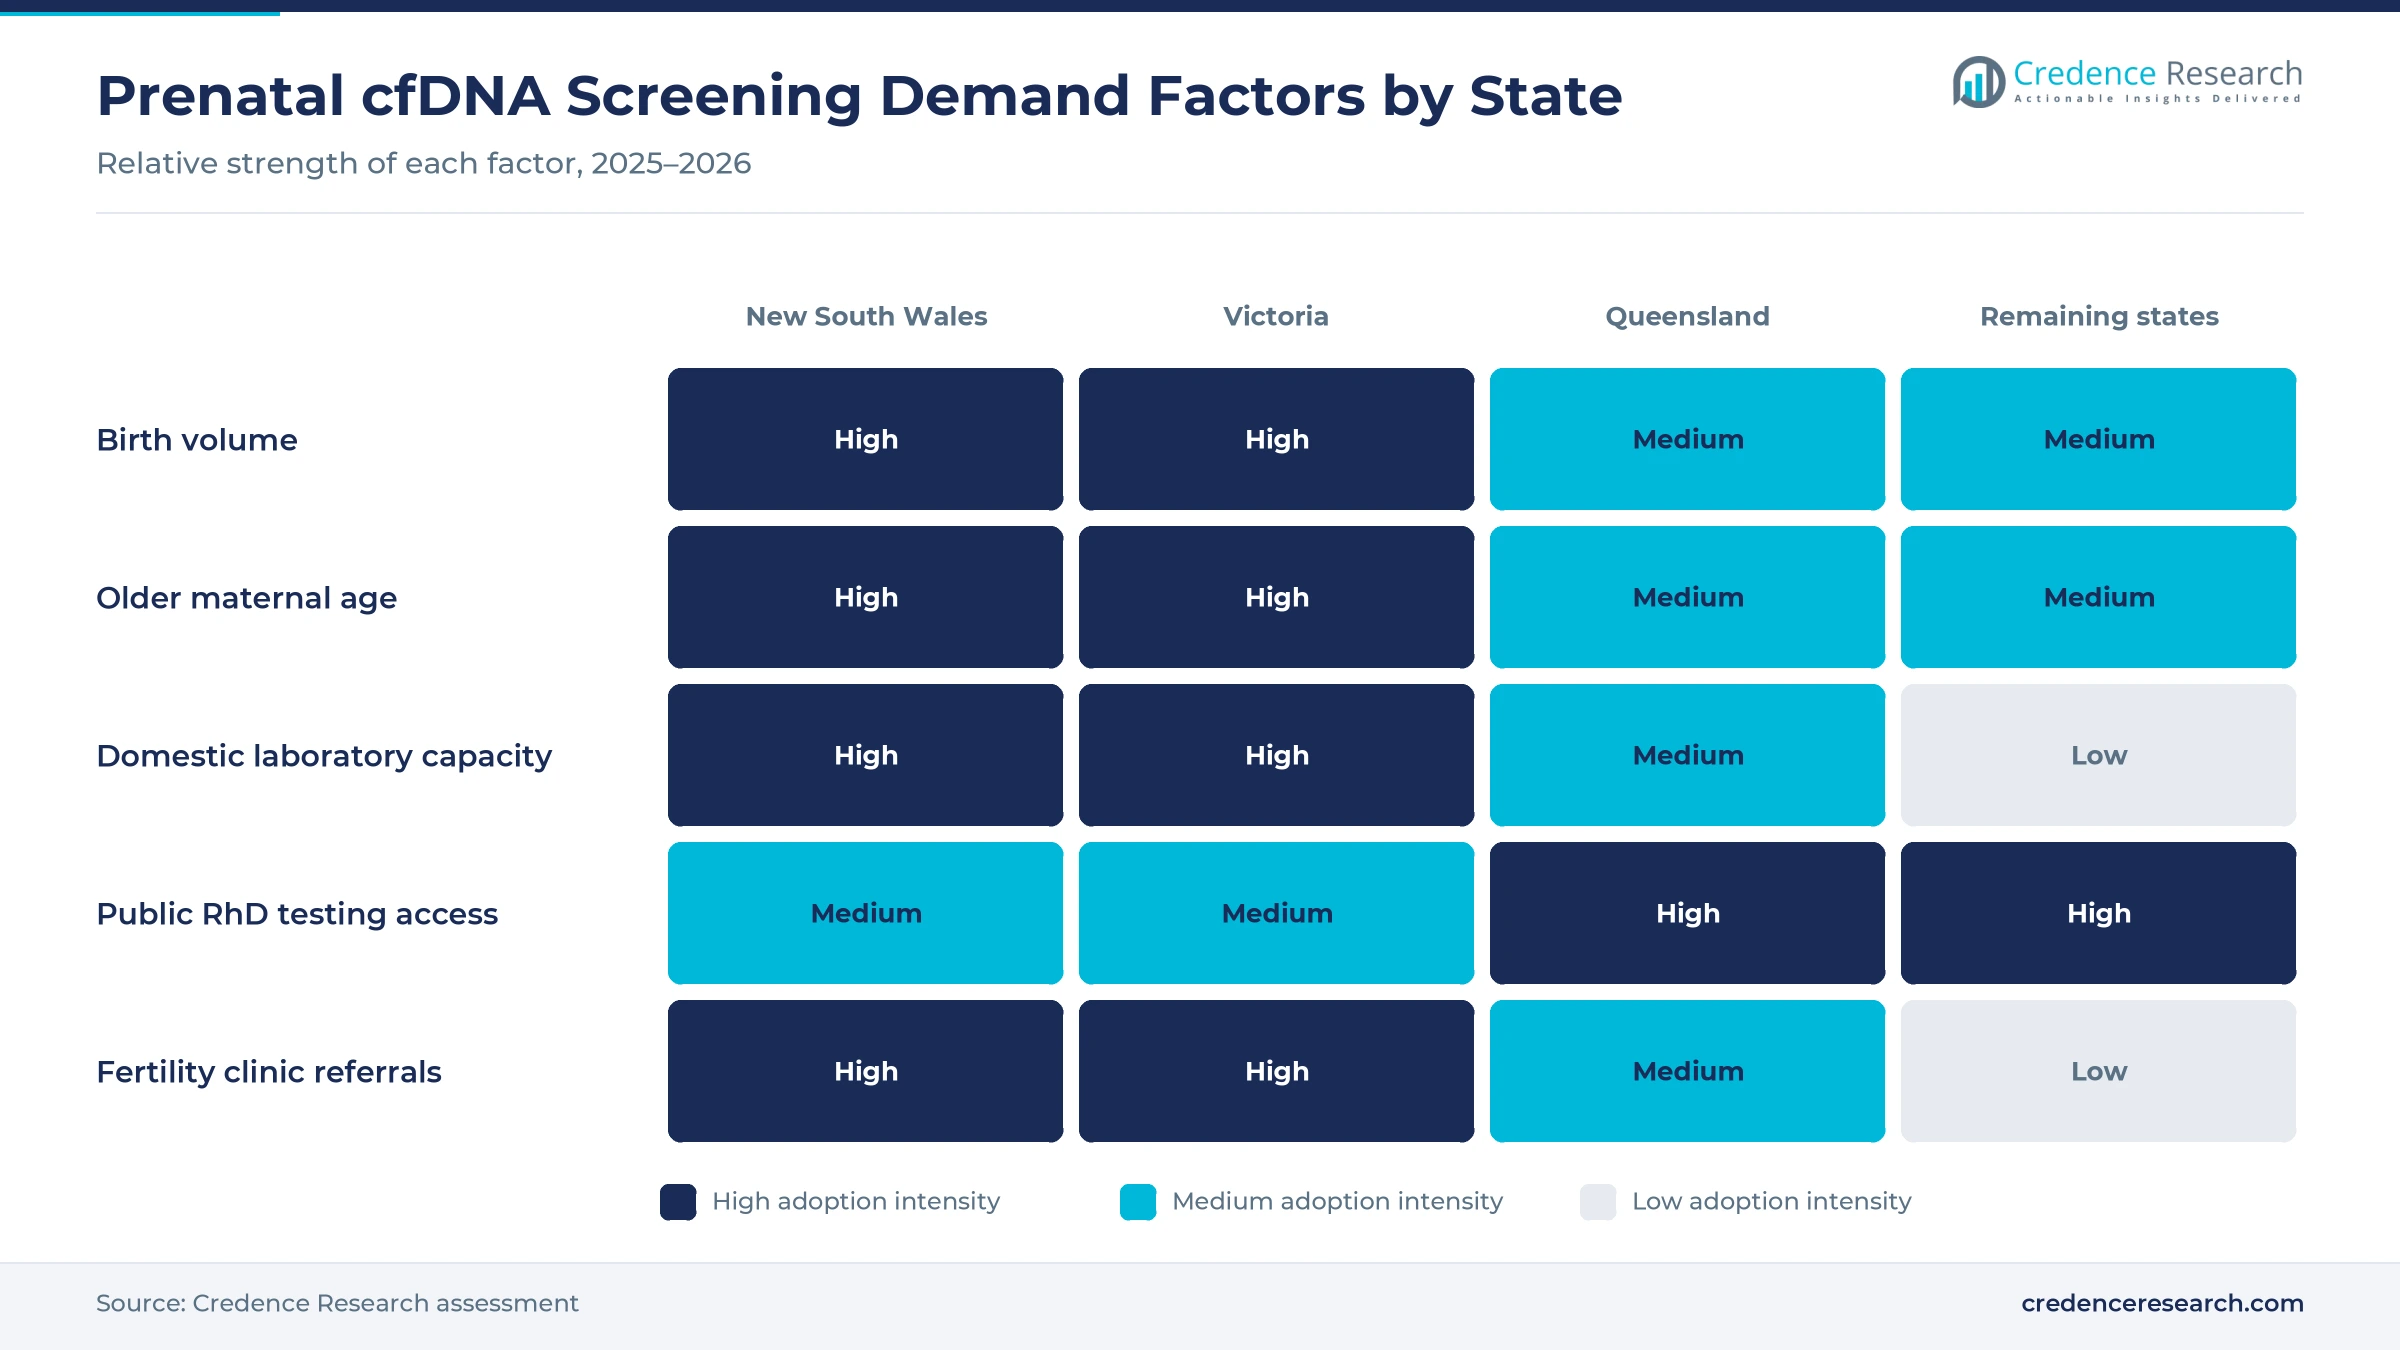
Australian mothers are having children later, and the chance of a chromosome condition rises with maternal age, which keeps demand for the most sensitive screen high. The Australian Bureau of Statistics reported a median maternal age of 32.1 years for births registered in 2024, with 292,318 births in total. The ABS Births, Australia, 2024 publication showed fertility rates for women aged 30 to 49 rising while rates for women under 30 declined. Women aged 35 to 39 recorded 66.6 births per 1,000 women in 2024, up from 65.5 a year earlier. As a result, Common aneuploidy screening keeps 63.0% of 2025 value, while older first-time mothers often add genome-wide options.
How is cell-free DNA screening displacing serum-based risk scores?
Clinicians and patients increasingly choose cell-free DNA screening as the primary test instead of the combined first-trimester serum and ultrasound screen, which shifts spending toward laboratories that run it. A population study of Victoria published in Genetics in Medicine found that combined first-trimester screening uptake fell from 77.5% in 2013 to 68.1% in 2015 as the newer test spread. The same study recorded a 39.6% drop in invasive diagnostic procedures between 2012 and 2015. Pregnancy, Birth and Baby, the federal information service, states that the test detects more than 99% of Down syndrome cases from about 10 weeks. Consequently, Routine-risk pregnancies hold 64.0% of 2025 value as first-line screening spreads.
How does Medicare funding widen fetal RhD testing?
A funded pathway now lets RhD-negative women learn the fetal blood group before receiving anti-D, which turns a niche reference test into a routine pregnancy service. Medicare items for fetal RHD testing have been available since July 2022, and the Medical Services Advisory Committee supported raising the fee for item 73420 from A$56.00 to A$150.40, with modeled volumes above 51,000 services a year. The Australian and New Zealand Society of Blood Transfusion estimates about 45,000 RhD-negative women give birth each year. Australian Red Cross Lifeblood then began Medicare-billed testing on May 28, 2025. As a result, RhD-negative pregnancies grow fastest at 9.29% a year.
Why do genome-wide options raise spending per test?
Laboratories are adding genome-wide and microdeletion options to the standard trisomy screen, which raises the average value of each request. Sonic Genetics offers genome-wide screening for an additional charge, while Genomic Diagnostics lists its Generation test at A$485, Generation 46 at A$525 and Generation Plus at A$799 as of August 2025. Victorian Clinical Genetics Services prices its percept test, which reviews all 23 chromosome pairs, at A$475. Monash IVF also markets a genome-wide nest+ option alongside its standard nest test. In turn, Expanded chromosomal screening and wider chromosome reviews lift revenue even when birth numbers stay flat.
Domestic labs, public RhD services and subsidy openings
Why is the shift to domestic sequencing laboratories accelerating?
Chromosome screening has shifted from overseas send-out models to Australian laboratories that offer faster results and local data handling. Sonic Genetics has provided the test since 2013, brought it into its Australian laboratories in 2015 and now runs it in 2 accredited sites. Australian Clinical Labs processes its Harmony screen in its own genetics laboratory, with results reaching the doctor in 5 to 10 business days. Victorian Clinical Genetics Services returns percept results 3 to 5 working days after receipt using massively parallel sequencing. However, Genomic Diagnostics still sends its Generation Plus test to an accredited laboratory in California. As a result, Chromosome-counting sequencing keeps 68.0% of 2025 value.
How are public RhD testing services changing supply?
Fetal RHD testing is moving from a single reference laboratory into public pathology services in several states, which widens access for RhD-negative women. PathWest began a pilot at King Edward Memorial Hospital in October 2023 and opened RhD screening to Medicare-eligible patients on Nov. 4, 2024. Lifeblood now processes samples collected after 15 weeks at its Brisbane center, with referring laboratories arranging refrigerated transport within 72 hours. Western Australia and New South Wales had both decided to set up public-provider testing, according to a February 2024 report for the Australian Government. Consequently, the smaller states and territories gain funded capacity, which also supports demand for blood group typing services.
Could a Medicare subsidy unlock wider screening uptake?
A public subsidy for chromosome screening would open the test to families who now skip it because of cost. A survey of health professionals led by Monash University and reported by newsGP on June 17, 2024, found that 94.1% named out-of-pocket costs as the main barrier. Patients typically pay about A$400 to A$500 because the test carries no Medicare rebate. The researchers recommended a Medicare subsidy, noting that carrier testing for cystic fibrosis, spinal muscular atrophy and fragile X gained an item in November 2023. Even without that subsidy, Medicare-funded work grows fastest at 9.64% a year as billed RhD testing volumes rise.
Can fertility clinic referrals open a higher-value channel?
Fertility clinics see patients who are older, already counseled on genetics and willing to pay for broader screening, which makes them an attractive referral channel. Monash IVF performs its nest test at its own clinics and specialist women's ultrasound centers across Australia and includes genetic counseling at no extra cost. Victorian Clinical Genetics Services markets percept for donor egg or sperm pregnancies, twins and triplets, while Australian Clinical Labs accepts IVF singleton and twin pregnancies, including egg donor cases. Many of these patients already use next-generation sequencing panels before conception, and the ABS counted 4,191 multiple-birth pregnancies in 2024. Monash IVF also offers its screen from 10 weeks of pregnancy. As a result, Expanded chromosomal screening gains from fertility clinic referrals that combine several genetic tests.
Out-of-pocket fees, fewer births and thin RhD rebates
How do out-of-pocket fees limit equitable access?
Chromosome screens remain self-funded, so lower-income families are less likely to use them. Pregnancy, Birth and Baby states that the test is not covered by Medicare or private health insurance. As a result, uptake depends on household budgets and on whether clinicians raise the option during short consultations. Laboratories respond with bundled counseling, flat pricing and tiered options that keep the basic screen near A$450.
Why does a falling birth rate cap volume growth?
Fewer births per woman limit how many pregnancies can be screened each year. Australia's total fertility rate fell to 1.481 births per woman in 2024 from 1.855 in 2013, according to the World Bank. As a result, volume growth now depends on higher uptake per pregnancy rather than more pregnancies. Laboratories offset this by selling genome-wide options and by adding funded RhD testing.
Why have thin RhD rebates slowed commercial rollout?
The original A$56 rebate for fetal RHD testing was too low to attract most commercial laboratories. A February 2024 report for the Australian Government described the rebate as considerably underfunded and noted that no TGA-registered RHD kits were approved. As a result, only a few public and national services offered the test at first. The higher fee from Nov. 1, 2024, improves the economics for new entrants.
How do accuracy limits of expanded screens affect demand?
Expanded screens find more conditions but carry lower accuracy than the core trisomy test, which complicates counseling. Sonic Genetics states that genome-wide accuracy is good but lower than for sex chromosome conditions, with limited data in twins. As a result, some clinicians hesitate to recommend expanded options for routine pregnancies. Laboratories respond with post-test genetic counseling and clear guidance on confirmatory diagnostic procedures.
New South Wales leads while smaller states grow fastest
| State | Value, 2025 (USD million) | Share, 2025 | CAGR, 2026–2035 |
|---|---|---|---|
| New South Wales | 23.9 | 40.2% | 7.50% |
| Victoria | 17.8 | 29.9% | 7.65% |
| Queensland | 14.7 | 24.7% | 8.05% |
| Remaining states and territories | 3.1 | 5.2% | 8.60% |
Why does New South Wales hold the largest share?
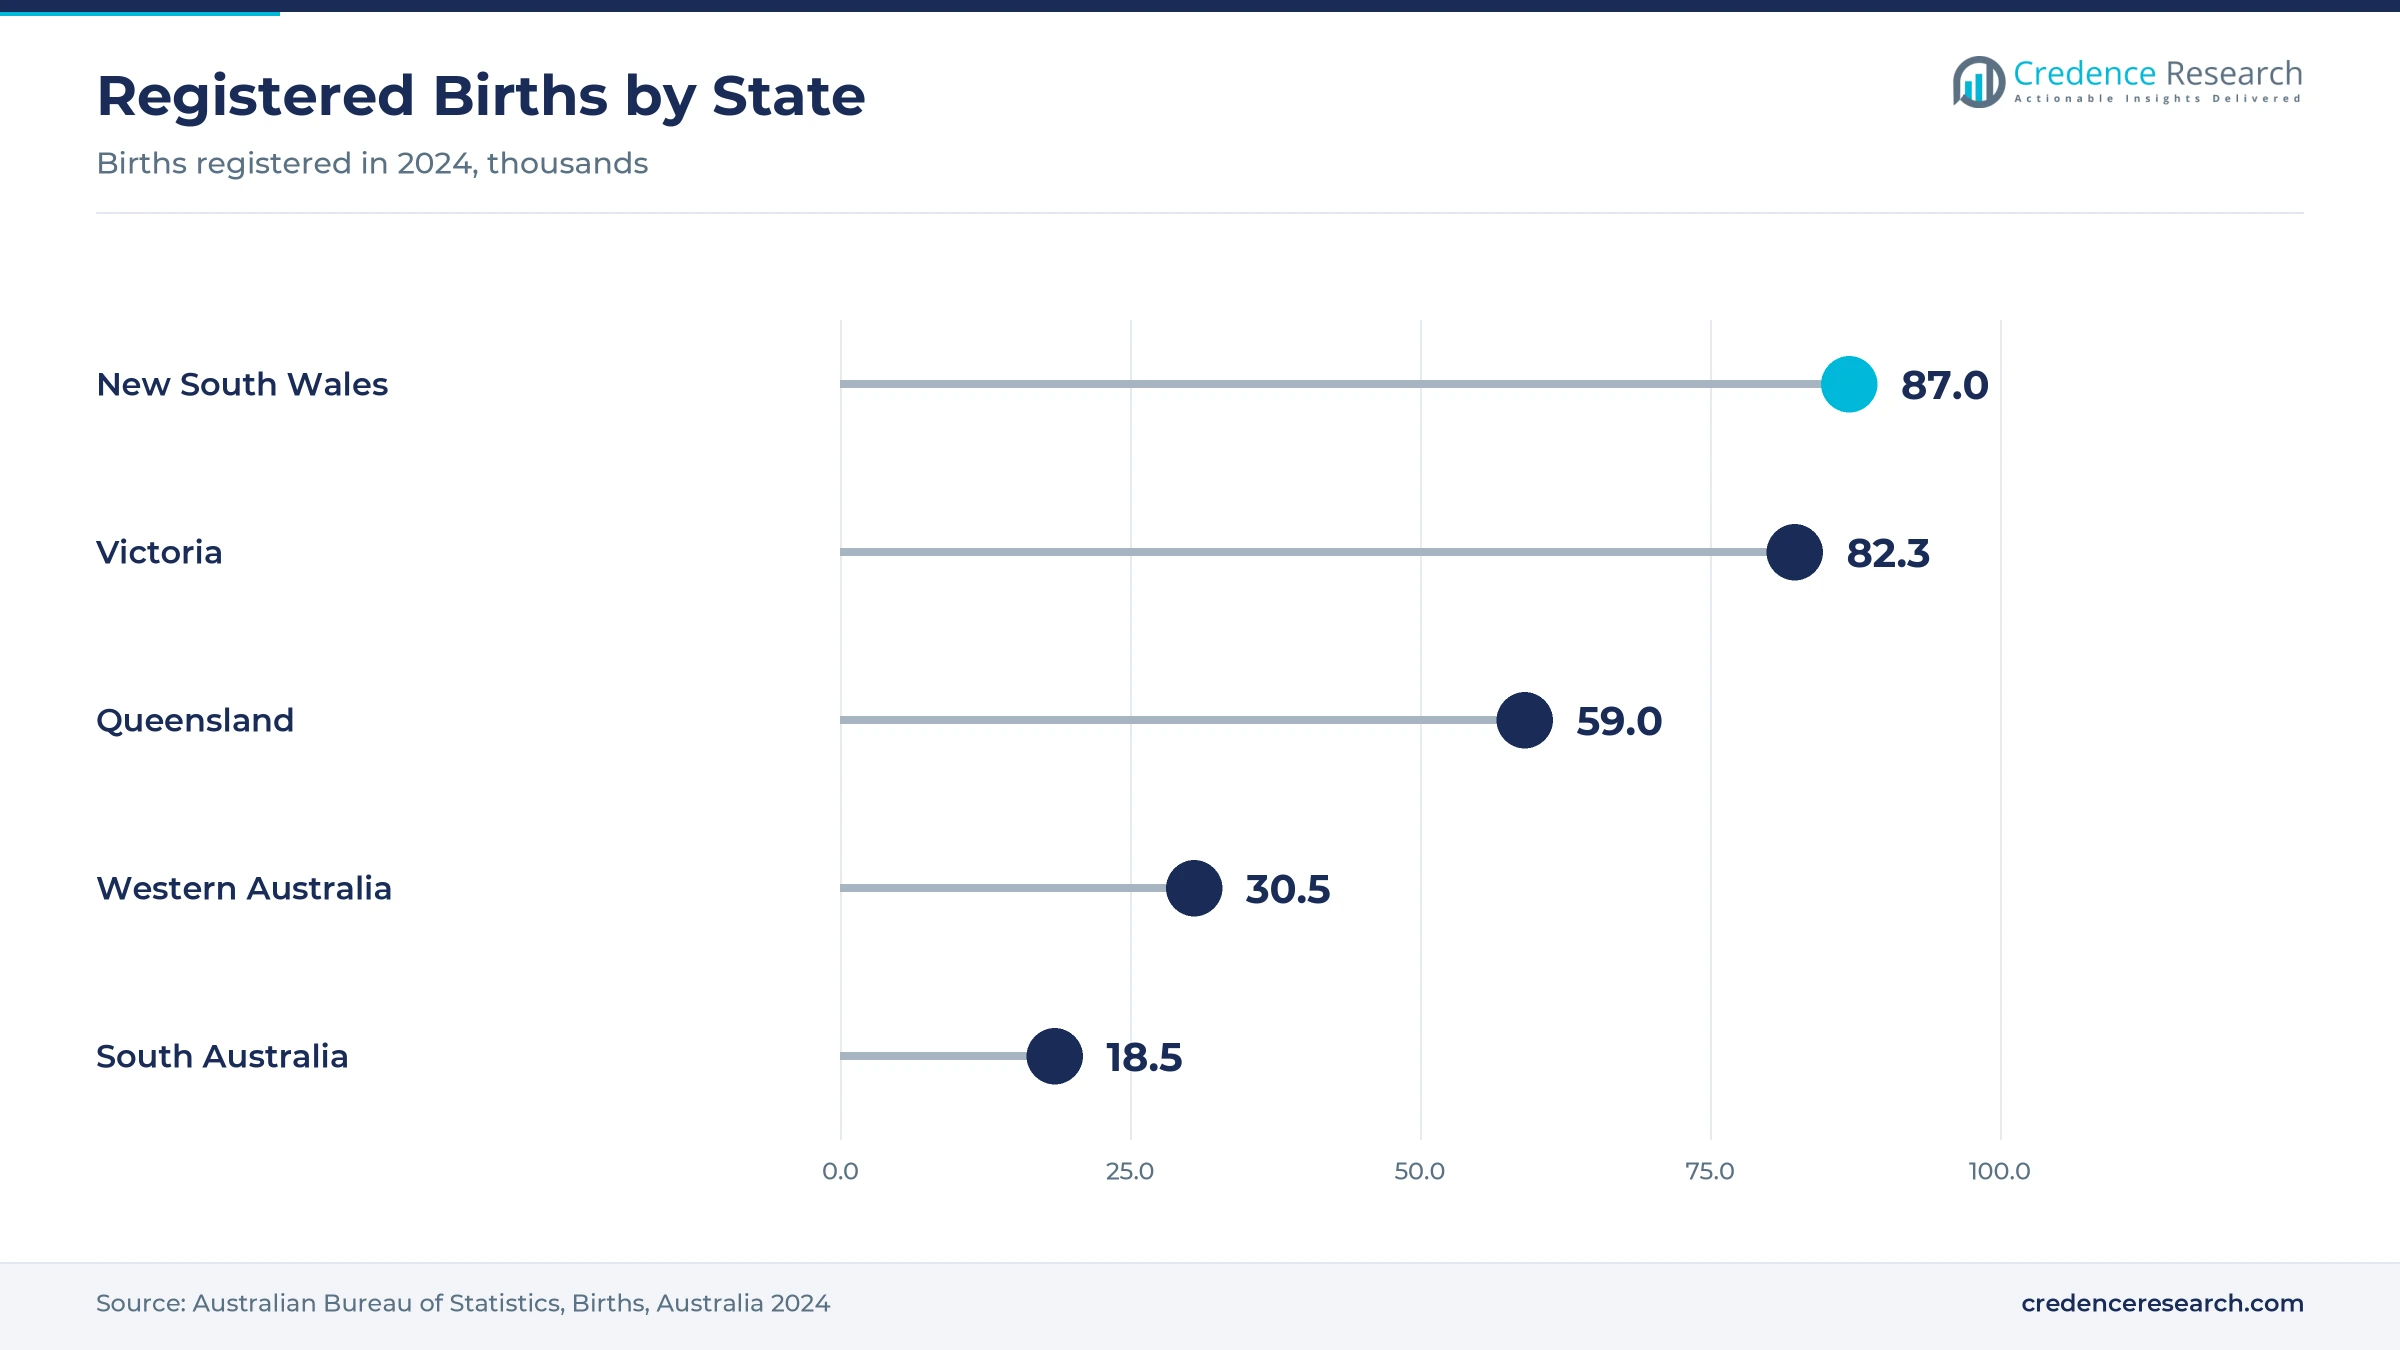
New South Wales held 40.2% of 2025 value and grows at 7.50% a year, because it records the most births of any region and hosts large private genetics laboratories. The Australian Bureau of Statistics counted 86,978 registered births in New South Wales in 2024, the highest of any state. Sonic Genetics and Australian Clinical Labs both process chromosome screens in their own Australian laboratories. New South Wales also decided to set up public RhD testing, which adds a funded stream over the forecast period.
How do clinical genetics services shape Victoria?
Victoria held a 29.9% share of 2025 value and grows at 7.65% a year, supported by a strong clinical genetics base and older mothers. Victorian Clinical Genetics Services runs the percept genome-wide test with results in three to five working days. Victoria registered 82,328 births in 2024, and its median maternal age of 32.7 years was among the highest in Australia. Victorian data also first showed how cell-free DNA screening displaced the combined first-trimester screen after 2013.
What supports demand in Queensland?
Queensland held a 24.7% share of 2025 value and grows at 8.05% a year, as birth numbers hold steady and RhD testing expands. The state registered 58,986 births in 2024, up 0.7% from 2023. Lifeblood processes national RhD screening samples at its Brisbane center, and its red cell reference laboratory in Queensland also provides specialized analysis for sensitized women. As a result, clinicians in the region gain early access to funded fetal blood group testing.
Why do the smaller states and territories grow fastest?
Remaining states and territories held a 5.2% share of 2025 value and grow fastest at 8.60% a year, as public RhD services expand. PathWest opened RhD screening to Medicare-eligible patients in Western Australia in November 2024, after a pilot at King Edward Memorial Hospital. Western Australia registered 30,516 births and South Australia 18,516 in 2024. The Australian Capital Territory recorded the highest median maternal age at 32.8 years, which supports screening uptake.
RhD funding, public lab launches and new pricing, 2024–2025
| Development | Status and market relevance |
|---|---|
| In November 2024, the higher Medicare fee for item 73420 took effect and item 73421 was amended to cover multiple pregnancies. | Widened funded fetal blood group testing |
| In November 2024, PathWest opened RhD screening to Medicare-eligible patients in Western Australia. | Added a public laboratory provider outside the eastern states |
| In May 2025, the Australian and New Zealand Society of Blood Transfusion amended its guidance on RHD testing for fetal RhD prediction in pregnancy. | Kept laboratory practice aligned with national RhD guidance |
| In May 2025, Australian Red Cross Lifeblood began Medicare-billed RhD screening for non-alloimmunized RhD-negative women. | Created a national no-cost RhD testing route |
| In August 2025, Genomic Diagnostics listed its Generation, Generation 46 and Generation Plus screens at A$485, A$525 and A$799. | Showed the price ladder from trisomy to genome-wide screens |
Sequencing, targeted assays and fetal genotyping compared
- Chromosome-counting sequencing reads millions of DNA fragments to count each chromosome, and it supports the genome-wide options sold by Sonic Genetics and Victorian Clinical Genetics Services.
- Targeted chromosomal assays analyze selected regions of chromosomes 21, 18, 13, X and Y, which keeps the cost per sample lower for the core screen.
- Fetal genotyping assays use quantitative PCR on cell-free DNA to detect the RHD gene, and laboratories validate them alongside other in vitro diagnostics before Medicare billing.
- Genome-wide add-ons look for segmental gains and losses across all chromosomes, although accuracy is lower than for the common trisomies.
Need a Custom Version of This Report?
Tailor the scope, geography, or segments to your exact requirements.
- Custom geography or segment scope
- Direct access to our analyst team
Private pathology, clinical genetics and public labs compete
Competition in Australian noninvasive prenatal testing splits between national private pathology groups, clinical genetics services and public laboratories that dominate funded RhD work. Sonic Genetics has offered the test since 2013 and runs it in two accredited Australian laboratories, with a genome-wide option. Australian Clinical Labs processes the Harmony screen in its own genetics laboratory, while Genomic Diagnostics sells its Generation range and sends Generation Plus to a partner laboratory in California. Victorian Clinical Genetics Services competes on turnaround with percept, and Monash IVF bundles nest with genetic counseling in its clinics. In the funded segment, Australian Red Cross Lifeblood and PathWest lead RhD screening. Laboratories compete on price, turnaround, counseling support and the breadth of genome-wide options.
Which laboratories lead cell-free DNA screening in Australia?
| Company | Type | Role in the market |
|---|---|---|
| Sonic Genetics | National private pathology laboratory | Offers the test since 2013 in two accredited Australian laboratories, with a genome-wide option |
| Australian Clinical Labs | National private pathology laboratory | Processes Harmony screens in its own genetics laboratory, with an optional 22q11.2 deletion screen |
| Victorian Clinical Genetics Services | Clinical genetics service | Runs the percept genome-wide test at A$475 with three to five working day turnaround |
| Genomic Diagnostics | Private genomics laboratory | Sells Generation, Generation 46 and Generation Plus, with the last processed in California |
| Monash IVF | Fertility clinic group | Offers nest and nest+ through its clinics and ultrasound centers with genetic counseling included |
| Australian Red Cross Lifeblood | National blood service | Medicare-billed RhD screening since May 2025 and specialized analysis for sensitized women |
| PathWest | State public pathology service | RhD screening for Medicare-eligible patients in Western Australia since November 2024 |
Credence Research view on cfDNA screening in Australia
Credence Research's view is that the Australia noninvasive prenatal testing market will grow steadily, because older mothers, clinician preference and funded RhD testing raise use per pregnancy even as births stay flat. Self-paid chromosome screens will keep most of the value, while fetal blood group testing adds the fastest growth as public and national services scale up. Genome-wide options also lift the average spending on each laboratory request. A Medicare subsidy for chromosome screening would be the largest upside, while falling fertility and price-sensitive patients will limit volume gains.
How the prenatal cfDNA screening estimate was built
The report uses 2025 as the base year on a calendar basis, and market values come from the Credence Research model. That model combines birth statistics, published test prices, Medicare fee and volume estimates, laboratory announcements and public guidance on RhD testing. Segment splits and state growth rates are Credence Research estimates, while state shares follow the split defined for this report. Sources used are government agencies, health regulators, official statistics, international agency data, peer-reviewed studies and company publications, and no interviews or surveys were used.
Funded RhD pathways and genome-wide screens carry growth
Australian noninvasive prenatal testing spending is expected to reach USD 136.9 million by 2035, a 7.74% CAGR during 2026–2035, as cell-free DNA screening becomes the default first-trimester choice and funded RhD testing reaches most RhD-negative women. New South Wales should keep the largest share, while the smaller states and territories grow fastest as public laboratories expand. Genome-wide options and single-gene analysis will add value per test. Laboratories that combine domestic processing, fast results and included genetic counseling should win the most referrals.
Frequently Asked Questions
How big is the Australia noninvasive prenatal testing market?
Which application leads noninvasive prenatal testing in Australia?
Which state leads noninvasive prenatal testing spending?
Is noninvasive prenatal testing covered by Medicare in Australia?
When did Lifeblood start funded RhD screening?
How does maternal age affect demand for this test?
Which companies lead noninvasive prenatal testing in Australia?
What are the main challenges for this market?
Table of Content
Chapter 1 Market Segmentation
- 1.1 Segmentation Framework
- 1.1.1 Product and Service Classification
- 1.1.2 Application and End-Use Classification
- 1.1.3 Technology and Solution Classification
- 1.1.4 Customer and Distribution Channel Classification
- 1.1.5 Geographic Segmentation
- 1.1.6 Market Segment Definitions and Boundaries
- 1.2 By Application
- 1.2.1 Common aneuploidy screening
- 1.2.2 Expanded chromosomal screening
- 1.2.3 Fetal blood group testing
- 1.2.4 Monogenic prenatal testing
- 1.3 By Technology
- 1.3.1 Chromosome-counting sequencing
- 1.3.2 Targeted chromosomal assays
- 1.3.3 Fetal genotyping assays
- 1.4 By Customer Type
- 1.4.1 Routine-risk pregnancies
- 1.4.2 Elevated-risk pregnancies
- 1.4.3 RhD-negative pregnancies
- 1.5 By Revenue Model
- 1.5.1 Patient self-pay
- 1.5.2 Medicare-funded
- 1.5.3 Institutional contracts
- 1.6 By State
- 1.6.1 New South Wales
- 1.6.2 Victoria
- 1.6.3 Queensland
- 1.6.4 Remaining states and territories
Chapter 2 Introduction
- 2.1 Report Objectives and Scope
- 2.2 Product Definition and Industry Terminology
- 2.3 Market Inclusions and Exclusions
- 2.4 Research Process
- 2.4.1 Primary Research and Expert Interviews
- 2.4.2 Secondary Research and Source Review
- 2.4.3 Top-Down and Bottom-Up Estimation
- 2.4.4 Data Triangulation and Verification
- 2.5 Market Size Measurement Basis
- 2.5.1 2025: USD 59.5 million → 2035: USD 136.9 million
- 2.6 Historical and Forecast Reference Periods
- 2.6.1 Historical Period: 2018-2025
- 2.6.2 Base Year: 2025
- 2.6.3 Forecast Period: 2025-2035
- 2.7 Research Assumptions and Limitations
Chapter 3 Executive Summary
- 3.1 Market Snapshot and Key Findings
- 3.2 Base-Year Market Size, 2025
- 3.3 Forecast Market Size, 2035
- 3.4 Revenue and Volume Growth Outlook
- 3.5 Key Demand and Supply Indicators
- 3.6 Leading Market Segments
- 3.7 Fastest-Growing Market Opportunities
- 3.8 Regional Performance Highlights
- 3.9 Technology and Industry Transformation
- 3.10 Competitive Landscape Summary
- 3.11 Analyst View and Strategic Implications
Chapter 4 Australia Noninvasive Prenatal Testing Market Trends and Developments
- 4.1 Historical Industry Development, 2018-2025
- 4.2 Recent Market Trends and Developments
- 4.3 Demand and Customer Behavior Trends
- 4.4 Technology and Product Innovation
- 4.5 Artificial Intelligence, Automation and Digitalization
- 4.6 Local Manufacturing and Supply Chain Realignment
- 4.7 Industry Partnerships, Mergers and Acquisitions
- 4.8 Sustainability and Circular Economy Developments
- 4.9 Government and Private Sector Investment Trends
- 4.10 Emerging Business Models and Commercialization
- 4.11 Industry Developments and Announcements
Chapter 5 Australia Noninvasive Prenatal Testing Market Production, Supply and Demand Analysis
- 5.1 Demand Trend and Consumption Analysis, 2018-2025
- 5.2 Demand Forecast, 2025-2035
- 5.3 Production and Output Trend, 2018-2025
- 5.4 Production and Output Forecast, 2025-2035
- 5.5 Installed Capacity and Capacity Utilization
- 5.6 Company-Wise Production Plants and Statistics
- 5.6.1 Installed Production Capacity
- 5.6.2 Actual Production
- 5.6.3 Planned Capacity and Expansion Targets
- 5.7 Supply Chain Structure and Procurement Trends
- 5.8 Supply-Demand Gap and Bottlenecks
- 5.9 Import Dependence and Sourcing Structure
- 5.10 Contract Manufacturing and Outsourcing
- 5.11 Regional Supply and Demand Concentration
Chapter 6 Australia Noninvasive Prenatal Testing Market Pricing Analysis
- 6.1 Pricing Structure and Measurement
- 6.2 Historical Pricing Trends, 2018-2025
- 6.3 Pricing Outlook, 2025-2035
- 6.4 Average Selling Price and Unit Economics
- 6.5 Pricing by Product and Market Segment
- 6.6 Geographic Pricing Differences
- 6.7 Key Input, Energy, Labor and Logistics Costs
- 6.8 Contract Pricing and Purchasing Models
- 6.9 Pricing Sensitivity and Competitive Positioning
- 6.10 Price, Margin and Profitability Implications
Chapter 7 Australia Noninvasive Prenatal Testing Market Dynamics
- 7.1 Market Growth Drivers
- 7.1.1 Demand-Side Drivers
- 7.1.2 Technology and Innovation Drivers
- 7.1.3 Infrastructure and Investment Drivers
- 7.1.4 Regulatory and Policy Drivers
- 7.2 Market Restraints
- 7.2.1 Cost and Affordability Constraints
- 7.2.2 Technology and Adoption Barriers
- 7.2.3 Supply Chain and Operational Constraints
- 7.3 Market Challenges
- 7.3.1 Competitive Pressure and Margin Erosion
- 7.3.2 Skills, Infrastructure and Implementation Gaps
- 7.4 Emerging Market Opportunities
- 7.5 Market Dynamics Impact and Time-Horizon Assessment
Chapter 8 Australia Noninvasive Prenatal Testing Value Chain Analysis
- 8.1 Industry Value Chain Overview
- 8.2 Upstream Suppliers and Critical Inputs
- 8.3 Technology and Component Providers
- 8.4 Manufacturing or Service Delivery
- 8.5 Distribution, Channel Partners and Integrators
- 8.6 Downstream Applications and End Users
- 8.7 Value Addition and Profit Pools
- 8.8 Vertical Integration and Outsourcing
- 8.9 Supplier Concentration and Risk
- 8.10 Supply Chain Localization and Resilience
Chapter 9 Australia Noninvasive Prenatal Testing Market Regulations and Policies
- 9.1 Relevant Laws, Standards and Compliance Frameworks
- 9.2 Product, Service, Safety and Quality Requirements
- 9.3 Government Policies, Incentives and Subsidies
- 9.4 Imports, Exports and Trade Barriers
- 9.5 Public Procurement and Local Content Requirements
- 9.6 Environmental and Sustainability Compliance
- 9.7 Upcoming Policy Changes and Market Implications
Chapter 10 Australia Noninvasive Prenatal Testing Market Hotspots and Opportunities
- 10.1 Market Opportunity Mapping and Growth Hotspots
- 10.2 High-Growth Applications and Customer Groups
- 10.3 Underserved Markets and White-Space Opportunities
- 10.4 Emerging Technology and Product Opportunities
- 10.5 New Capacity and Investment Hotspots
- 10.6 Market Entry and Expansion Opportunities
- 10.7 Distribution and Partnership Opportunities
- 10.8 Near-Term and Long-Term Commercial Potential
- 10.9 Opportunity Attractiveness and Execution Risks
Chapter 11 Australia Noninvasive Prenatal Testing Market Outlook, 2025-2035
- 11.1 Market Size and Analysis
- 11.1.1 Revenue (Market Measurement: 2025: USD 59.5 million → 2035: USD 136.9 million)
- 11.1.2 Market Volume and Quantity Sold
- 11.1.3 Historical Market Size, 2018-2025
- 11.1.4 Base-Year Market Size, 2025
- 11.2 Market Forecast, 2025-2035
- 11.2.1 Revenue Forecast to 2035
- 11.2.2 Volume Forecast to 2035
- 11.2.3 CAGR and Year-on-Year Growth
- 11.2.4 Incremental Revenue Opportunity
- 11.3 Forecast Assumptions and Scenario Analysis
- 11.3.1 Base-Case Forecast
- 11.3.2 Optimistic and Conservative Scenarios
- 11.3.3 Technology, Pricing and Policy Sensitivities
- 11.4 Market Attractiveness and Growth Outlook
Chapter 12 Australia Noninvasive Prenatal Testing Market Segmentation and Outlook
- 12.1 Segmentation Summary and Market Shares, 2025
- 12.2 Largest and Fastest-Growing Segments
- 12.3 By Application - Market Size and Forecast, 2025-2035
- 12.3.1 Segment Definition and Scope
- 12.3.2 Historical Market Size, 2018-2025
- 12.3.3 Revenue Forecast, 2025-2035
- 12.3.4 Volume Forecast, 2025-2035
- 12.3.5 Base-Year Market Share, 2025
- 12.3.6 Segment CAGR and Growth Drivers
- 12.3.7 Subsegment Market Size and Forecast
- 12.3.7.1 Common aneuploidy screening
- 12.3.7.2 Expanded chromosomal screening
- 12.3.7.3 Fetal blood group testing
- 12.3.7.4 Monogenic prenatal testing
- 12.3.8 Subsegment Pricing and Adoption Trends
- 12.3.9 Leading Suppliers and Competition
- 12.3.10 Regional Demand and Opportunities
- 12.4 By Technology - Market Size and Forecast, 2025-2035
- 12.4.1 Segment Definition and Scope
- 12.4.2 Historical Market Size, 2018-2025
- 12.4.3 Revenue Forecast, 2025-2035
- 12.4.4 Volume Forecast, 2025-2035
- 12.4.5 Base-Year Market Share, 2025
- 12.4.6 Segment CAGR and Growth Drivers
- 12.4.7 Subsegment Market Size and Forecast
- 12.4.7.1 Chromosome-counting sequencing
- 12.4.7.2 Targeted chromosomal assays
- 12.4.7.3 Fetal genotyping assays
- 12.4.8 Subsegment Pricing and Adoption Trends
- 12.4.9 Leading Suppliers and Competition
- 12.4.10 Regional Demand and Opportunities
- 12.5 By Customer Type - Market Size and Forecast, 2025-2035
- 12.5.1 Segment Definition and Scope
- 12.5.2 Historical Market Size, 2018-2025
- 12.5.3 Revenue Forecast, 2025-2035
- 12.5.4 Volume Forecast, 2025-2035
- 12.5.5 Base-Year Market Share, 2025
- 12.5.6 Segment CAGR and Growth Drivers
- 12.5.7 Subsegment Market Size and Forecast
- 12.5.7.1 Routine-risk pregnancies
- 12.5.7.2 Elevated-risk pregnancies
- 12.5.7.3 RhD-negative pregnancies
- 12.5.8 Subsegment Pricing and Adoption Trends
- 12.5.9 Leading Suppliers and Competition
- 12.5.10 Regional Demand and Opportunities
- 12.6 By Revenue Model - Market Size and Forecast, 2025-2035
- 12.6.1 Segment Definition and Scope
- 12.6.2 Historical Market Size, 2018-2025
- 12.6.3 Revenue Forecast, 2025-2035
- 12.6.4 Volume Forecast, 2025-2035
- 12.6.5 Base-Year Market Share, 2025
- 12.6.6 Segment CAGR and Growth Drivers
- 12.6.7 Subsegment Market Size and Forecast
- 12.6.7.1 Patient self-pay
- 12.6.7.2 Medicare-funded
- 12.6.7.3 Institutional contracts
- 12.6.8 Subsegment Pricing and Adoption Trends
- 12.6.9 Leading Suppliers and Competition
- 12.6.10 Regional Demand and Opportunities
- 12.7 By State - Market Size and Forecast, 2025-2035
- 12.7.1 Segment Definition and Scope
- 12.7.2 Historical Market Size, 2018-2025
- 12.7.3 Revenue Forecast, 2025-2035
- 12.7.4 Volume Forecast, 2025-2035
- 12.7.5 Base-Year Market Share, 2025
- 12.7.6 Segment CAGR and Growth Drivers
- 12.7.7 Subsegment Market Size and Forecast
- 12.7.7.1 New South Wales
- 12.7.7.2 Victoria
- 12.7.7.3 Queensland
- 12.7.7.4 Remaining states and territories
- 12.7.8 Subsegment Pricing and Adoption Trends
- 12.7.9 Leading Suppliers and Competition
- 12.7.10 Regional Demand and Opportunities
- 12.8 Segment Growth Comparison
- 12.9 Segment Attractiveness and Priority Matrix
Chapter 13 Australia Noninvasive Prenatal Testing End-Use and Application Market Outlook
- 13.1 End-Use Industry and Customer Demand Structure
- 13.2 Leading Applications and Customer Groups
- 13.3 End-Use Market Size, Share and Forecast
- 13.4 Major End-Use Industry Deep Dives
- 13.4.1 Customer Requirements and Use Cases
- 13.4.2 Demand and Replacement Cycles
- 13.4.3 Technical and Regulatory Considerations
- 13.4.4 Purchasing and Procurement Models
- 13.4.5 Leading Vendors and Distribution Channels
- 13.4.6 Forecast and Commercial Opportunities
- 13.5 Emerging Applications and Cross-Segment Demand
- 13.6 End-Use Industry Investment Priorities
Chapter 14 Australia Noninvasive Prenatal Testing Geographic Market Outlook, 2025-2035
- 14.1 Domestic Market Distribution and Demand Clusters
- 14.2 State- or Province-Wise Market Size and Forecast, 2025-2035
- 14.3 City and Metropolitan Market Outlook
- 14.4 Industrial, Manufacturing and Commercial Clusters
- 14.5 Geographic Concentration of Key End Users
- 14.6 Local Pricing and Purchasing Differences
- 14.7 Domestic Production Facilities and Capacity Map
- 14.8 Local Infrastructure and Project Pipeline
- 14.9 State-Level Policy and Incentive Differences
- 14.10 Subnational Investment Hotspots and Opportunities
- 14.11 Distribution and Logistics Networks
- 14.12 Domestic Competitive Footprint
Chapter 15 Australia Noninvasive Prenatal Testing Technology, Innovation and Sustainability Outlook
- 15.1 Technology Landscape and Maturity
- 15.2 Product, Process and Service Innovation
- 15.3 AI, Automation and Digital Tools in the Industry
- 15.4 Technology Adoption and Performance Benchmarking
- 15.5 Innovation Pipeline and R&D Investment
- 15.6 Patent and Intellectual Property Trends
- 15.7 Energy Efficiency and Resource Management
- 15.8 Sustainability, Recycling and Circularity
- 15.9 Technology Roadmap, 2025-2035
- 15.10 Risks of Obsolescence and Technology Substitution
Chapter 16 Australia Noninvasive Prenatal Testing Market Key Strategic Imperatives
- 16.1 Growth and Market Entry Priorities
- 16.2 High-Return Products and Segments
- 16.3 Pricing, Profitability and Cost Optimization
- 16.4 Technology Investment and Product Differentiation
- 16.5 Supply Chain Localization and Resilience
- 16.6 Distribution and Customer Acquisition
- 16.7 Partnership, Acquisition and Capacity Strategy
- 16.8 Regional Expansion Priorities
- 16.9 Short-, Medium- and Long-Term Actions
Chapter 17 Competition Outlook
- 17.1 Industry Competition Characteristics
- 17.2 Market Structure and Concentration
- 17.3 Market Share and Competitive Positioning, 2025
- 17.4 Company-Wise Revenue and Product Benchmarking
- 17.5 Production and Service Capacity Benchmarking
- 17.6 Technology, Pricing and Differentiation
- 17.7 Regional Footprint and Distribution Strength
- 17.8 Mergers, Acquisitions and Strategic Alliances
- 17.9 New Entrants and Competitive Threats
- 17.10 Porter's Five Forces and Industry Attractiveness
- 17.11 Competitive Outlook, 2025-2035
Chapter 18 Company Profiles
- 18.1 Company Coverage and Selection Criteria
- 18.2 Australian Clinical Labs
- 18.2.1 Business Description
- 18.2.2 Company Ownership and Geographic Presence
- 18.2.3 Product and Service Portfolio
- 18.2.4 Manufacturing and Operating Footprint
- 18.2.5 Production Capacity and Expansion Plans
- 18.2.6 Financial Performance and Investment
- 18.2.7 Market Share and Competitive Position
- 18.2.8 Technology and Innovation Capabilities
- 18.2.9 Strategic Alliances or Partnerships
- 18.2.10 Recent Developments
- 18.2.11 Growth Strategy and Outlook
- 18.3 Sonic Genetics
- 18.4 Victorian Clinical Genetics Services
- 18.5 Genomic Diagnostics
- 18.6 Virtus Diagnostics
- 18.7 Monash IVF
- 18.8 Australian Red Cross Lifeblood
- 18.9 PathWest
- 18.10 Genea
- 18.11 Natera
- 18.12 Other Relevant Market Participants
Note: Every listed company is profiled on the structure shown under the first company. The company list is preliminary and may change based on research findings, market developments, data availability and client requirements.
Chapter 19 Disclaimer
- 19.1 Research and Forecast Disclaimer
- 19.2 Data Source and Estimation Limitations
Note: The depth of individual sections depends on data availability for this market. Volume, capacity, trade and other unit-based metrics are included where applicable.

