Market Overview
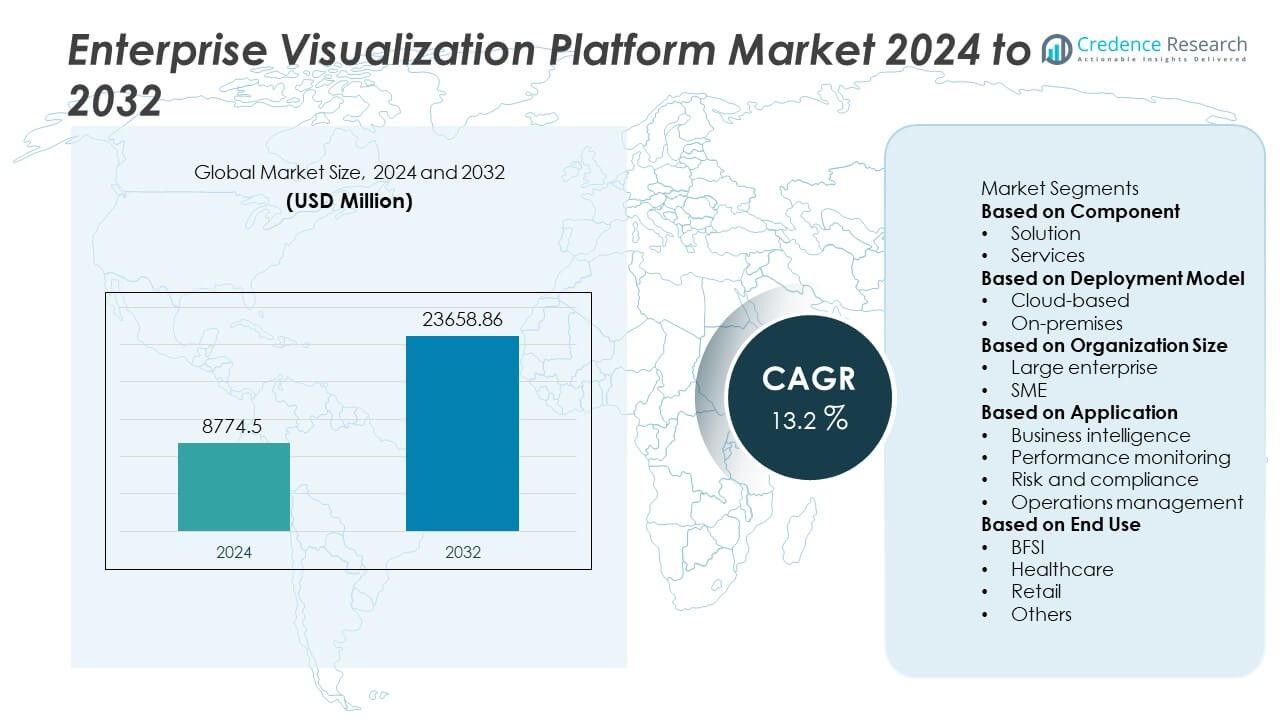
The enterprise visualization platform market size was valued at USD 8,774.5 million in 2024 and is projected to reach USD 23,658.86 million by 2032, growing at a CAGR of 13.2% during the forecast period.
| REPORT ATTRIBUTE |
DETAILS |
| Historical Period |
2020-2023 |
| Base Year |
2024 |
| Forecast Period |
2025-2032 |
| Enterprise Visualization Platform Market Size 2024 |
USD 8,774.5 Million |
| Enterprise Visualization Platform Market, CAGR |
13.2% |
| Enterprise Visualization Platform Market Size 2032 |
USD 23,658.86 Million |
The enterprise visualization platform market is driven by top players including Qlik, Amazon Web Services (AWS), Salesforce, Oracle Corporation, IBM Corporation, SAP SE, Microsoft Corporation, MicroStrategy, Google, and Domo. These companies strengthen the industry through AI-driven visualization, cloud integration, and real-time analytics capabilities. Microsoft, SAP, and Oracle lead with enterprise-focused solutions, while AWS and Google emphasize scalable cloud-based platforms. Salesforce leverages CRM integration, and Qlik, Domo, and MicroStrategy cater to agile, user-friendly visualization needs. Regionally, North America led with 39% share in 2024, followed by Europe at 30% and Asia Pacific at 22%, while Latin America accounted for 5% and the Middle East & Africa together held 4%, reflecting strong global adoption.
Access crucial information at unmatched prices!
Request your sample report today & start making informed decisions powered by Credence Research Inc.!
Download Sample
Market Insights
- The enterprise visualization platform market was valued at USD 8,774.5 million in 2024 and is projected to reach USD 23,658.86 million by 2032, growing at a CAGR of 13.2%.
- Rising demand for real-time data analysis and digital twin adoption is driving growth, with the solution segment holding 68% share and services supporting integration and customization.
- Cloud-based deployment led with 61% share in 2024, supported by hybrid work trends and scalability, while on-premises models retained importance in highly regulated industries.
- Key players such as Microsoft Corporation, SAP SE, Oracle Corporation, Qlik, AWS, Google, Salesforce, IBM, MicroStrategy, and Domo dominate through AI integration, cloud-first strategies, and industry-specific visualization tools.
- Regionally, North America led with 39% share, followed by Europe at 30% and Asia Pacific at 22%, while Latin America accounted for 5% and the Middle East & Africa together held 4%, reflecting balanced global adoption.
Market Segmentation Analysis:
By Component
The solution segment dominated the enterprise visualization platform market in 2024, accounting for 68% of the total share. Its leadership stems from rising adoption of advanced visualization tools that enable real-time data analysis, 3D modeling, and immersive simulations across industries such as manufacturing, healthcare, and IT. Solutions help enterprises enhance decision-making, streamline workflows, and support predictive insights through AI and analytics integration. The services segment held 32% share, driven by demand for consulting, integration, and maintenance support, ensuring smooth deployment and long-term optimization of visualization technologies in enterprise environments.
- For instance, Microsoft Power BI supports enterprises enabling visualization of complex datasets and gaining insights with AI features like Copilot.
By Deployment Model
Cloud-based deployment led the enterprise visualization platform market in 2024, capturing 61% of the deployment share. The growth is supported by its scalability, cost-effectiveness, and ease of integration with enterprise data systems. Organizations prefer cloud solutions for remote accessibility, collaboration, and seamless updates, particularly in hybrid work environments. On-premises deployment retained 39% share, favored by industries such as defense, government, and banking that prioritize data security and regulatory compliance. The accelerating shift toward SaaS models reinforces cloud’s dominance, making it the preferred choice for enterprises pursuing digital transformation.
- For instance, Google Looker Studio offers scalable cloud-native visualization capabilities that are integrated with the broader Google Cloud ecosystem. It allows users to connect with a wide array of data sources, build interactive dashboards and reports, and collaborate on data insights.
By Organization Size
Large enterprises accounted for 64% of the enterprise visualization platform market share in 2024, reflecting their significant investments in advanced visualization technologies to manage complex datasets and global operations. These organizations adopt visualization platforms for digital twins, performance monitoring, and real-time collaboration. Small and medium enterprises (SMEs) contributed 36% share, driven by increasing accessibility of affordable, cloud-based solutions that enhance agility and operational efficiency. SMEs are rapidly embracing visualization tools for project management, data-driven insights, and improved customer engagement. The growing democratization of visualization technologies continues to expand adoption across businesses of all sizes.
Key Growth Drivers
Increasing Demand for Real-Time Data Analysis
Enterprises are increasingly adopting visualization platforms to analyze and interpret large volumes of real-time data. These platforms enable organizations to transform complex datasets into interactive visuals, improving operational insights and decision-making. Industries such as manufacturing, healthcare, and IT rely on visualization for predictive analytics, process optimization, and performance monitoring. The ability to integrate data from multiple sources enhances transparency and supports faster responses to market dynamics. As businesses prioritize data-driven strategies, demand for visualization tools that enable actionable insights continues to grow globally.
- For instance, IBM Cognos Analytics enables users to perform predictive analytics and monitoring by connecting to and analyzing data from various sources. The platform offers advanced reporting, interactive dashboards, and AI-driven insights to help businesses in manufacturing, finance, and other sectors understand performance and make data-driven decisions.
Rising Adoption of Cloud-Based Solutions
Cloud deployment has become a major driver for the enterprise visualization platform market, holding 61% share in 2024. Enterprises prefer cloud-based models for their scalability, cost efficiency, and flexibility in hybrid work environments. Cloud platforms enable seamless collaboration across distributed teams while reducing infrastructure costs. The integration of SaaS models allows organizations to access updates and advanced features without heavy investments. With digital transformation accelerating across industries, cloud-based visualization platforms are increasingly viewed as essential for achieving agility, accessibility, and sustainable growth in enterprise operations.
- For instance, Amazon QuickSight supports over 100,000 enterprise accounts globally, delivering serverless data visualization at scale without dedicated infrastructure.
Growing Use of Digital Twin and 3D Visualization
The rising adoption of digital twin technology and 3D visualization tools is driving strong demand for enterprise visualization platforms. Organizations use digital twins to replicate physical systems, optimize performance, and predict failures through simulation. Industries such as automotive, energy, and construction are leveraging 3D visualization to design, monitor, and maintain complex assets. The ability to combine real-time IoT data with visualization platforms enhances predictive maintenance and operational efficiency. As enterprises prioritize innovation and cost optimization, digital twin integration represents a critical driver of visualization platform adoption worldwide.
Key Trends and Opportunities
Integration of AI and Machine Learning
Artificial intelligence and machine learning are transforming enterprise visualization platforms by enabling advanced automation and predictive analytics. AI-powered visualization tools classify data, identify trends, and generate insights faster than traditional methods. Machine learning enhances anomaly detection and forecasting, helping enterprises proactively address risks. These technologies also improve personalization, tailoring dashboards and visual content to specific user needs. The convergence of AI with visualization platforms creates significant opportunities for enterprises to extract deeper value from unstructured and structured datasets, reinforcing innovation and competitiveness in global markets.
- For instance, SAP Analytics Cloud leverages machine learning to analyze data from a wide variety of connected enterprise systems, enabling anomaly detection and forecasting across operations.
Expanding Adoption in SMEs through Cloud Accessibility
Small and medium enterprises are emerging as a high-growth opportunity segment, holding 36% market share in 2024. Affordable cloud-based visualization solutions make advanced tools accessible to smaller firms without heavy infrastructure costs. SMEs increasingly use visualization platforms for project management, customer engagement, and operational insights. The ability to scale services based on business needs supports agility and efficiency. As cloud adoption expands in emerging economies, SMEs will play a central role in driving the next wave of enterprise visualization growth, strengthening global market penetration and diversification.
- For instance, Domo manages massive data volumes on its cloud platform, enabling SMEs to run real-time visualization without investing in their own physical infrastructure.
Key Challenges
High Implementation and Licensing Costs
The high cost of deploying enterprise visualization platforms remains a significant barrier, particularly for SMEs. Expenses include licensing, integration, customization, and ongoing training, which raise the total cost of ownership. Advanced features like 3D modeling and digital twin integration require substantial investment, limiting adoption among price-sensitive enterprises. While cloud models help reduce upfront costs, long-term subscription fees can still burden smaller organizations. Vendors need to introduce flexible pricing and modular solutions to address affordability challenges and enable wider market accessibility.
Data Security and Privacy Concerns
Data security is a critical challenge for enterprise visualization platforms, especially in cloud-based deployments. Enterprises often handle sensitive financial, healthcare, or operational data that must be protected against breaches, unauthorized access, and cyber threats. While cloud adoption is growing, it amplifies concerns around data residency and regulatory compliance. Industries such as government, defense, and banking remain cautious due to strict security requirements. To overcome these barriers, vendors must invest in advanced encryption, secure access controls, and compliance certifications, ensuring trust and supporting long-term adoption of visualization technologies.
Regional Analysis
North America
North America led the enterprise visualization platform market in 2024 with 39% share, driven by strong digital transformation initiatives and high adoption of advanced visualization technologies. The U.S. dominates regional demand with investments in cloud-based platforms, AI integration, and digital twin applications across industries such as healthcare, automotive, and manufacturing. The presence of major technology providers and well-established IT infrastructure supports rapid adoption. Enterprises in the region focus on real-time data analytics and hybrid work solutions, ensuring continued demand. Regulatory frameworks on data security also enhance reliance on enterprise-grade visualization platforms across critical sectors.
Europe
Europe accounted for 30% of the enterprise visualization platform market share in 2024, supported by robust adoption across manufacturing, automotive, and energy industries. Countries like Germany, France, and the United Kingdom are leading users, focusing on 3D visualization, simulation, and digital twin technologies. Strict compliance with GDPR regulations fuels the need for secure data visualization tools. Enterprises also prioritize sustainability and operational efficiency, leveraging visualization for predictive analytics and smart manufacturing. With strong R&D investment and government-backed Industry 4.0 initiatives, Europe remains a significant hub for enterprise visualization technology adoption and market growth.
Asia Pacific
Asia Pacific captured 22% of the enterprise visualization platform market share in 2024, emerging as the fastest-growing region. Rapid industrialization, growing digital adoption, and strong investments in smart manufacturing are driving demand in China, India, and Japan. Enterprises in the region leverage visualization platforms for operational efficiency, real-time analytics, and enhanced customer engagement. Cloud adoption and expansion of SMEs further accelerate market growth. The region’s expanding IT ecosystem and government-led initiatives to digitalize industries strengthen adoption. With rising demand for data-driven insights, Asia Pacific is expected to play a pivotal role in global enterprise visualization expansion.
Latin America
Latin America represented 5% of the enterprise visualization platform market share in 2024, with Brazil and Mexico driving regional growth. Enterprises in these countries are adopting visualization solutions to improve operational decision-making, enhance collaboration, and reduce inefficiencies. The growing shift toward cloud-based platforms supports SMEs and cost-sensitive enterprises. While limited IT infrastructure and economic challenges hinder faster adoption, increasing demand for data-driven strategies and rising investments in industrial modernization strengthen the market. Regional service providers and global vendors are also expanding their presence, fostering steady growth and improving accessibility of visualization platforms in Latin America.
Middle East and Africa
The Middle East and Africa together held 4% of the enterprise visualization platform market share in 2024, reflecting early-stage adoption but rising opportunities. The United Arab Emirates and Saudi Arabia lead with large-scale investments in smart city projects, energy, and digital transformation programs. Enterprises leverage visualization platforms for infrastructure planning, simulation, and predictive analytics. In Africa, South Africa is the primary contributor, supported by growing adoption of cloud-based solutions and IT investments. Despite challenges from limited digital infrastructure, increasing government initiatives and enterprise modernization highlight the region’s strong potential for future market growth.
Market Segmentations:
By Component
By Deployment Model
By Organization Size
By Application
- Business intelligence
- Performance monitoring
- Risk and compliance
- Operations management
By End Use
- BFSI
- Healthcare
- Retail
- Others
By Geography
- North America
- Europe
- Germany
- France
- U.K.
- Italy
- Spain
- Rest of Europe
- Asia Pacific
- China
- Japan
- India
- South Korea
- South-east Asia
- Rest of Asia Pacific
- Latin America
- Brazil
- Argentina
- Rest of Latin America
- Middle East & Africa
- GCC Countries
- South Africa
- Rest of the Middle East and Africa
Competitive Landscape
The competitive landscape of the enterprise visualization platform market is shaped by leading players such as Qlik, Amazon Web Services (AWS), Salesforce, Oracle Corporation, IBM Corporation, SAP SE, Microsoft Corporation, MicroStrategy, Google, and Domo. These companies drive market growth by offering advanced visualization platforms that integrate AI, analytics, and cloud capabilities to support real-time data-driven decision-making. Microsoft, SAP, and Oracle dominate with enterprise-grade solutions tailored to large organizations, while AWS and Google strengthen their positions with scalable, cloud-based visualization services. Salesforce leverages its strong CRM ecosystem to integrate data visualization into customer engagement. Qlik and MicroStrategy focus on flexible, user-centric dashboards, while Domo emphasizes accessibility and usability for SMEs. IBM continues to expand with AI-enabled visualization tools, enhancing predictive analytics and cognitive insights. Collectively, these players compete through innovation, strategic partnerships, and industry-specific solutions, ensuring continuous evolution of visualization platforms to meet enterprise needs for agility, scalability, and digital transformation.
Shape Your Report to Specific Countries or Regions & Enjoy 30% Off!
Key Player Analysis
Recent Developments
- In September 2025, Microsoft enabled a standalone Copilot experience as default in Power BI, with improved auto-workspace assignments for users.
- In May 2025, Qlik Sense introduced native support for regular expressions (regex) in load scripts and chart expressions.
- In May 2025, Qlik Sense added ability to embed custom logos in analytic apps and new toolbar shortcut buttons for Sheets and Bookmarks.
- In 2025, Microsoft integrated Fabric and Copilot deeply, making Power BI a core part of the unified analytics platform for over 30 million monthly active users.
Report Coverage
The research report offers an in-depth analysis based on Component, Deployment Model, Organization Size, Application, End Use and Geography. It details leading market players, providing an overview of their business, product offerings, investments, revenue streams, and key applications. Additionally, the report includes insights into the competitive environment, SWOT analysis, current market trends, as well as the primary drivers and constraints. Furthermore, it discusses various factors that have driven market expansion in recent years. The report also explores market dynamics, regulatory scenarios, and technological advancements that are shaping the industry. It assesses the impact of external factors and global economic changes on market growth. Lastly, it provides strategic recommendations for new entrants and established companies to navigate the complexities of the market.
Future Outlook
- The enterprise visualization platform market will grow strongly with rising digital transformation initiatives.
- Cloud-based deployment will remain dominant as enterprises seek flexibility and scalability.
- AI and machine learning integration will enhance predictive analytics and automation.
- Digital twin technology will expand adoption in manufacturing, energy, and construction sectors.
- SMEs will increase adoption through affordable, cloud-based visualization solutions.
- Real-time analytics and interactive dashboards will drive faster decision-making in enterprises.
- Hybrid and remote work models will boost demand for collaborative visualization tools.
- Industry-specific platforms will gain traction in healthcare, finance, and retail.
- Strategic partnerships and acquisitions will shape competition and expand product portfolios.
- Asia Pacific will emerge as a key growth region with rapid digital adoption and smart industry initiatives.


