
Food staples and feed buyers set grain demand
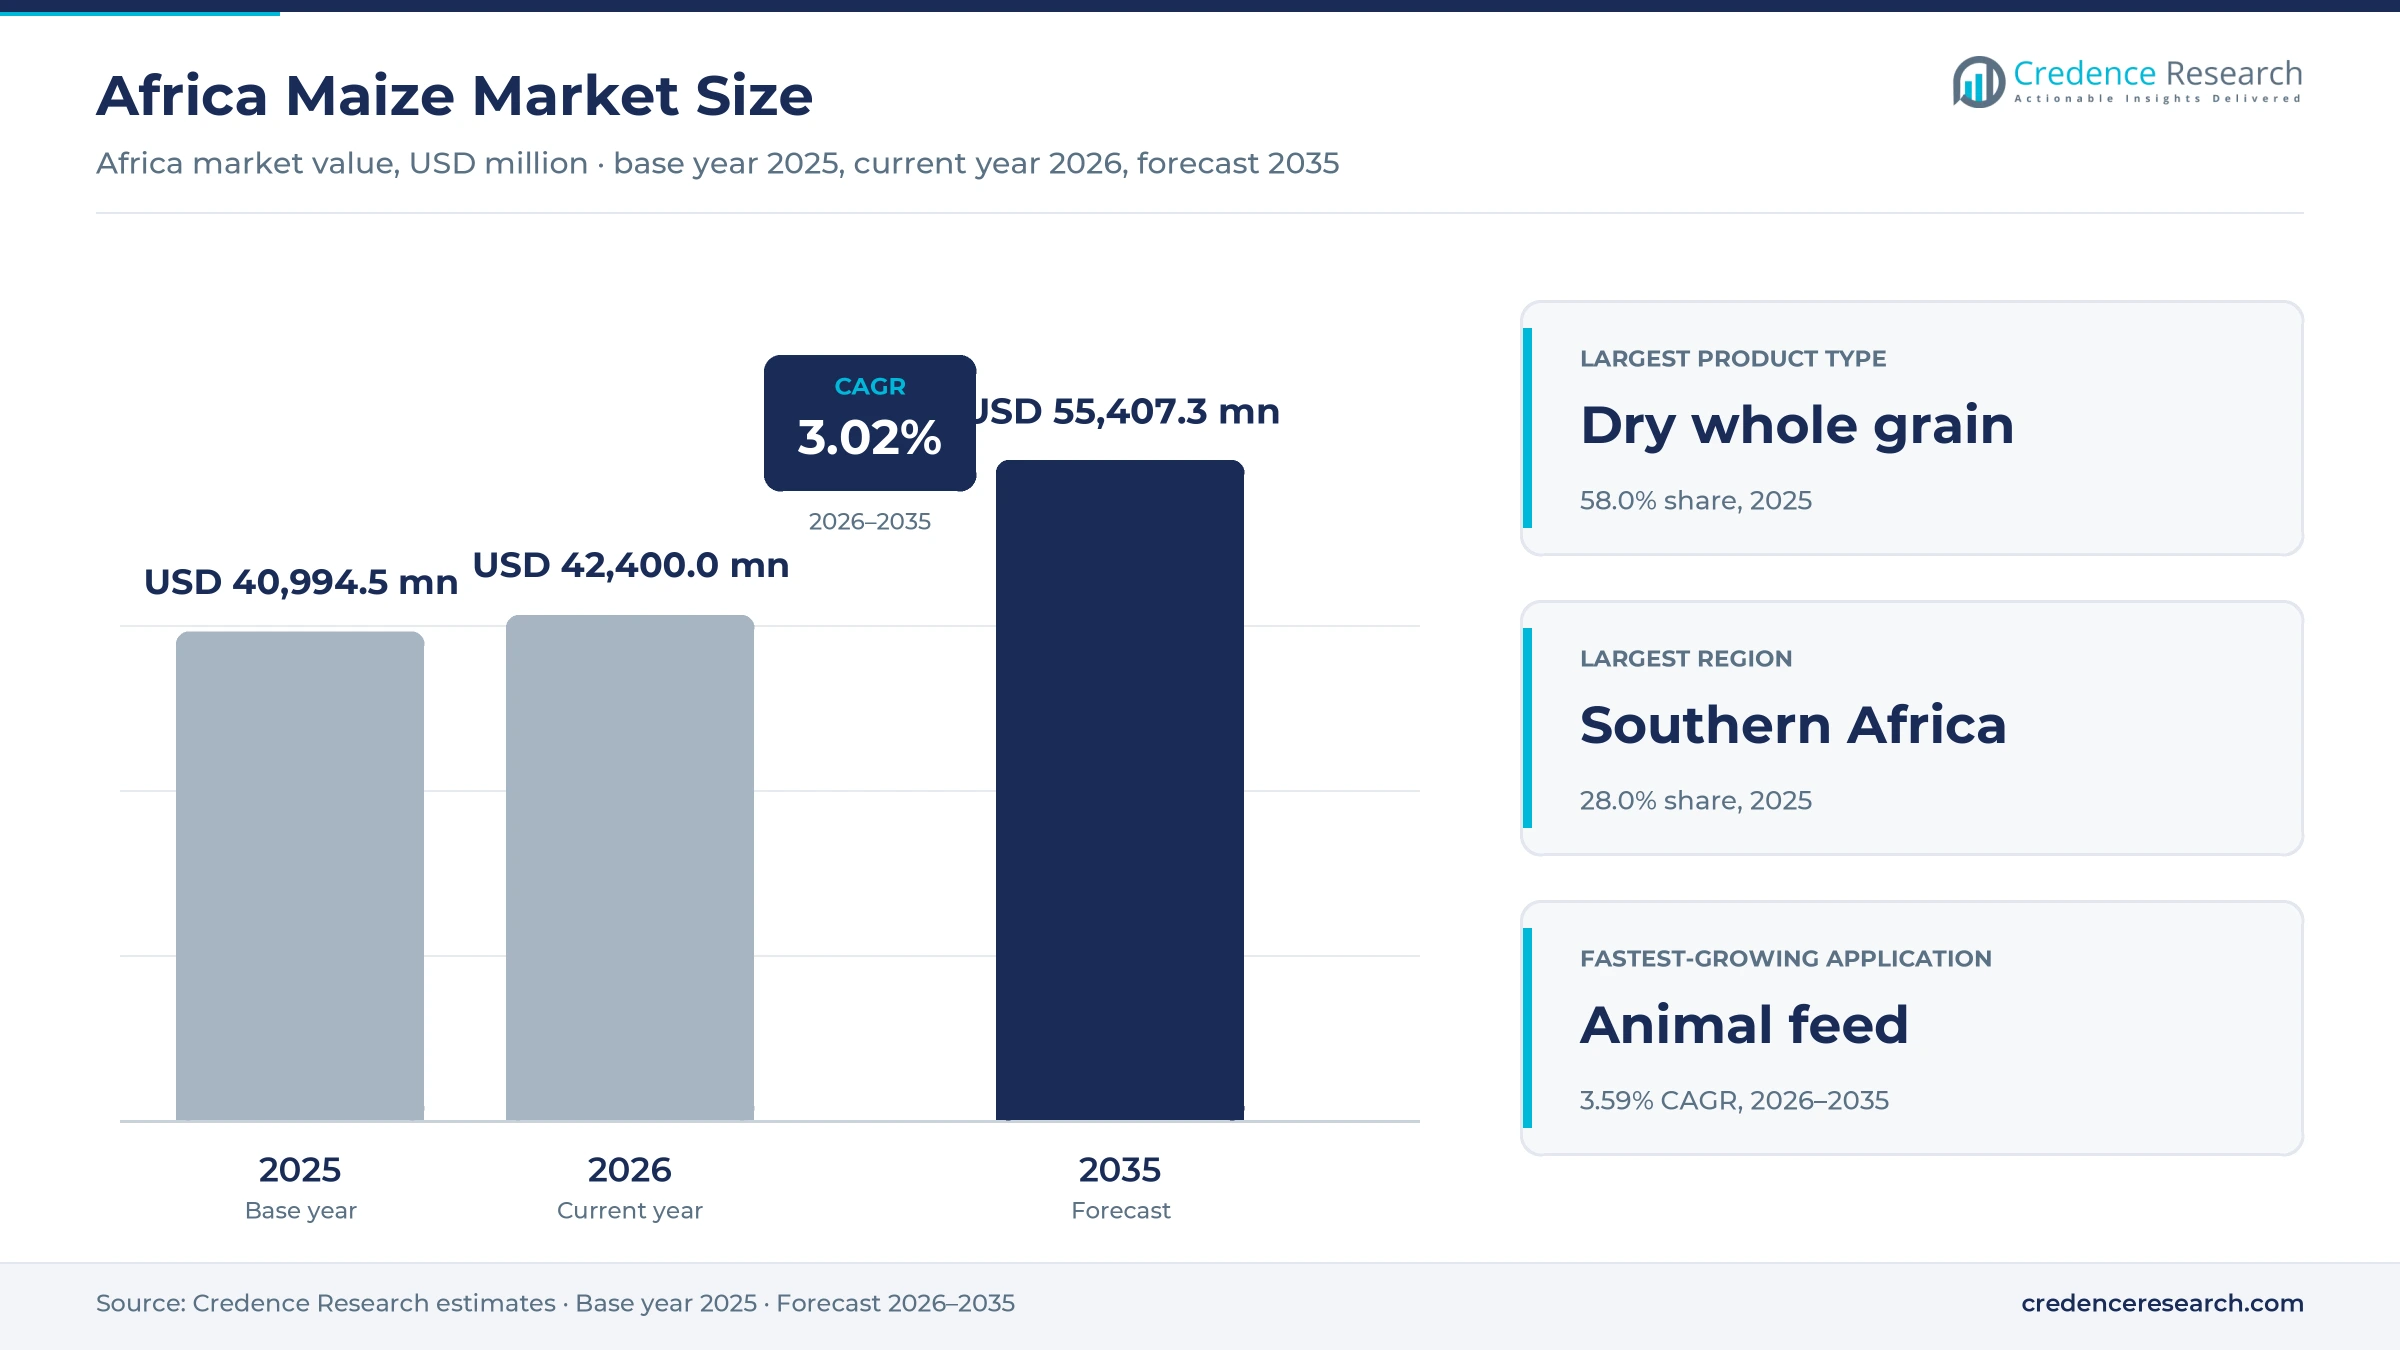
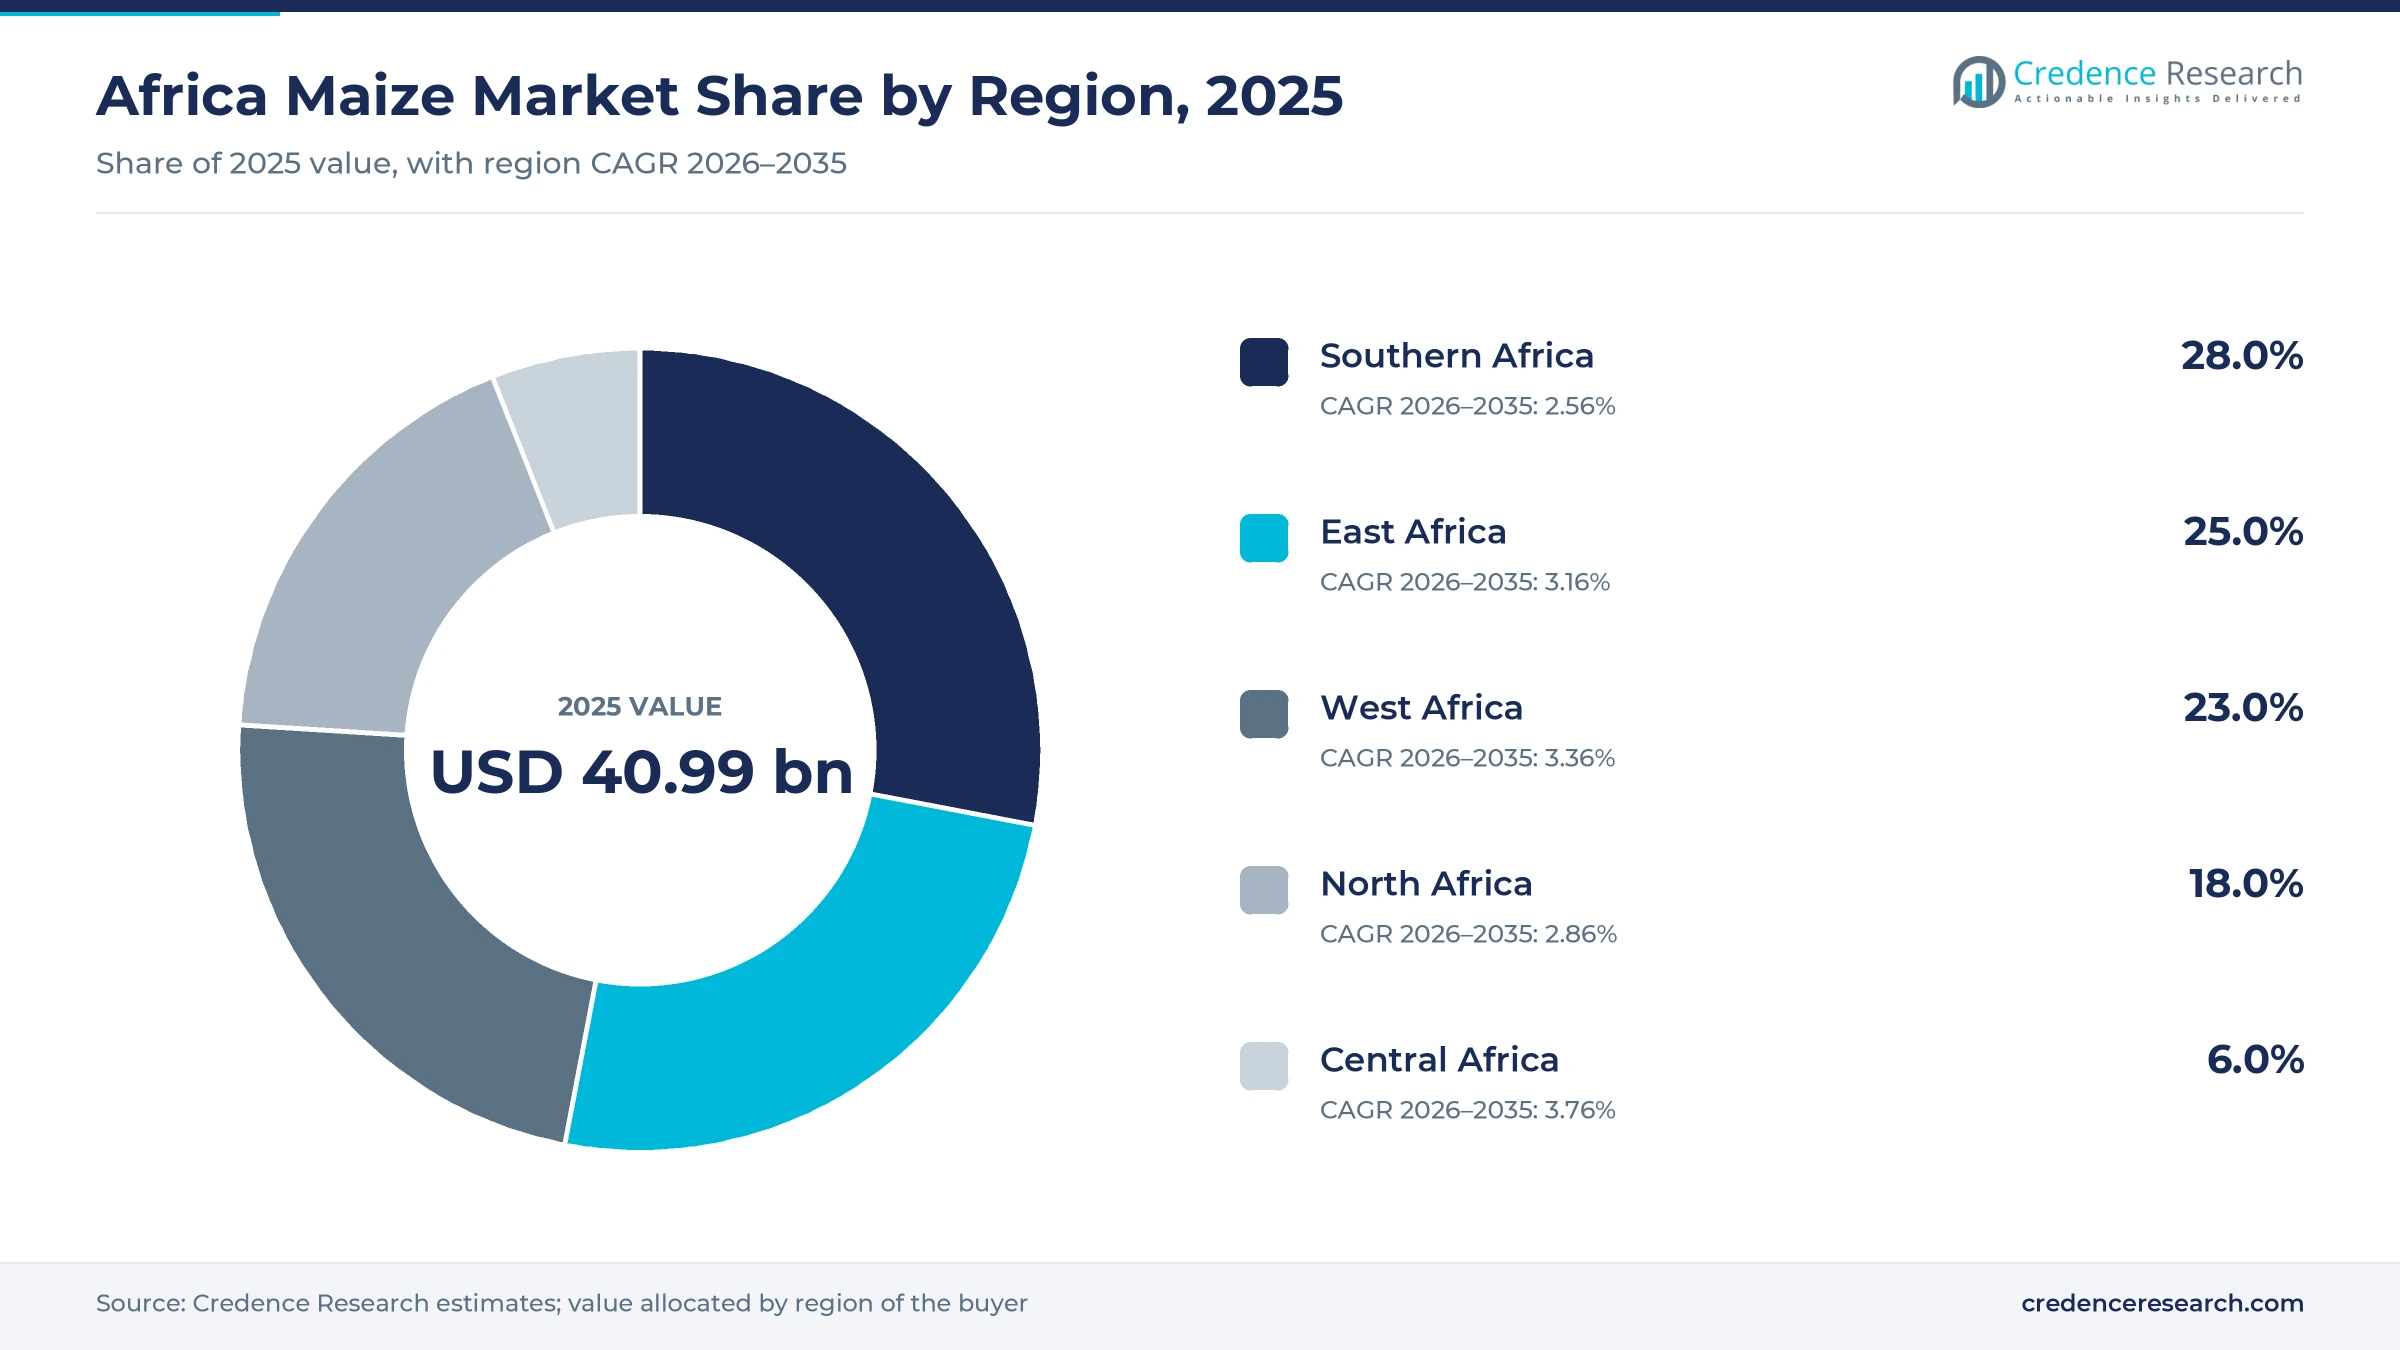
The Africa maize market was valued at USD 40.99 billion in 2025 and is projected to increase from USD 42.40 billion in 2026 to USD 55.41 billion by 2035, registering a CAGR of 3.02% during 2026–2035. Demand comes from households eating white maize as a daily staple, millers packing meal and flour, and poultry and fish producers buying yellow grain for feed. Southern Africa held the largest regional share, 28.0% in 2025, because South Africa and Zambia produce large commercial crops and ship the surplus to neighbors. Central Africa is the fastest-growing region at 3.76% a year, as low local yields keep Cameroon and the Democratic Republic of Congo reliant on purchased grain. One major commercial change came in 2026, when the Competition Tribunal of South Africa cleared Premier to take over RFG Holdings. Egypt adds a separate pull on supply, since feed makers there now rely on record imports while domestic farms cover about one-third of national needs.
What does the Africa maize market count and who buys the grain?
The market counts maize grain and first-stage milled products sold across five African regions, from dry whole grain to meal, flour, grits, samp, bran and germ. Buyers include millers, feed manufacturers, brewers, public reserve agencies, traders and households, and most purchases happen at harvest or under seasonal supply agreements.
The market excludes packaged snacks, breakfast cereals, sweetened corn products and meat or eggs made with feed. The value chain runs from farms through merchants, silos and mills to retailers, feed plants and state reserves, while cross-border traders move surplus grain between neighboring countries.
Africa Maize Market Insights
- The Africa maize market grows from USD 40.99 billion in 2025 to USD 55.41 billion by 2035, a 3.02% CAGR across 2026–2035, as food and feed buyers secure more grain.
- Southern Africa led with 28.0% of 2025 value, supported by commercial farming in South Africa and export surplus in Zambia during the latest season.
- Human food held 62.0% of 2025 value because white maize remains the main staple in eastern and southern households, ahead of animal feed.
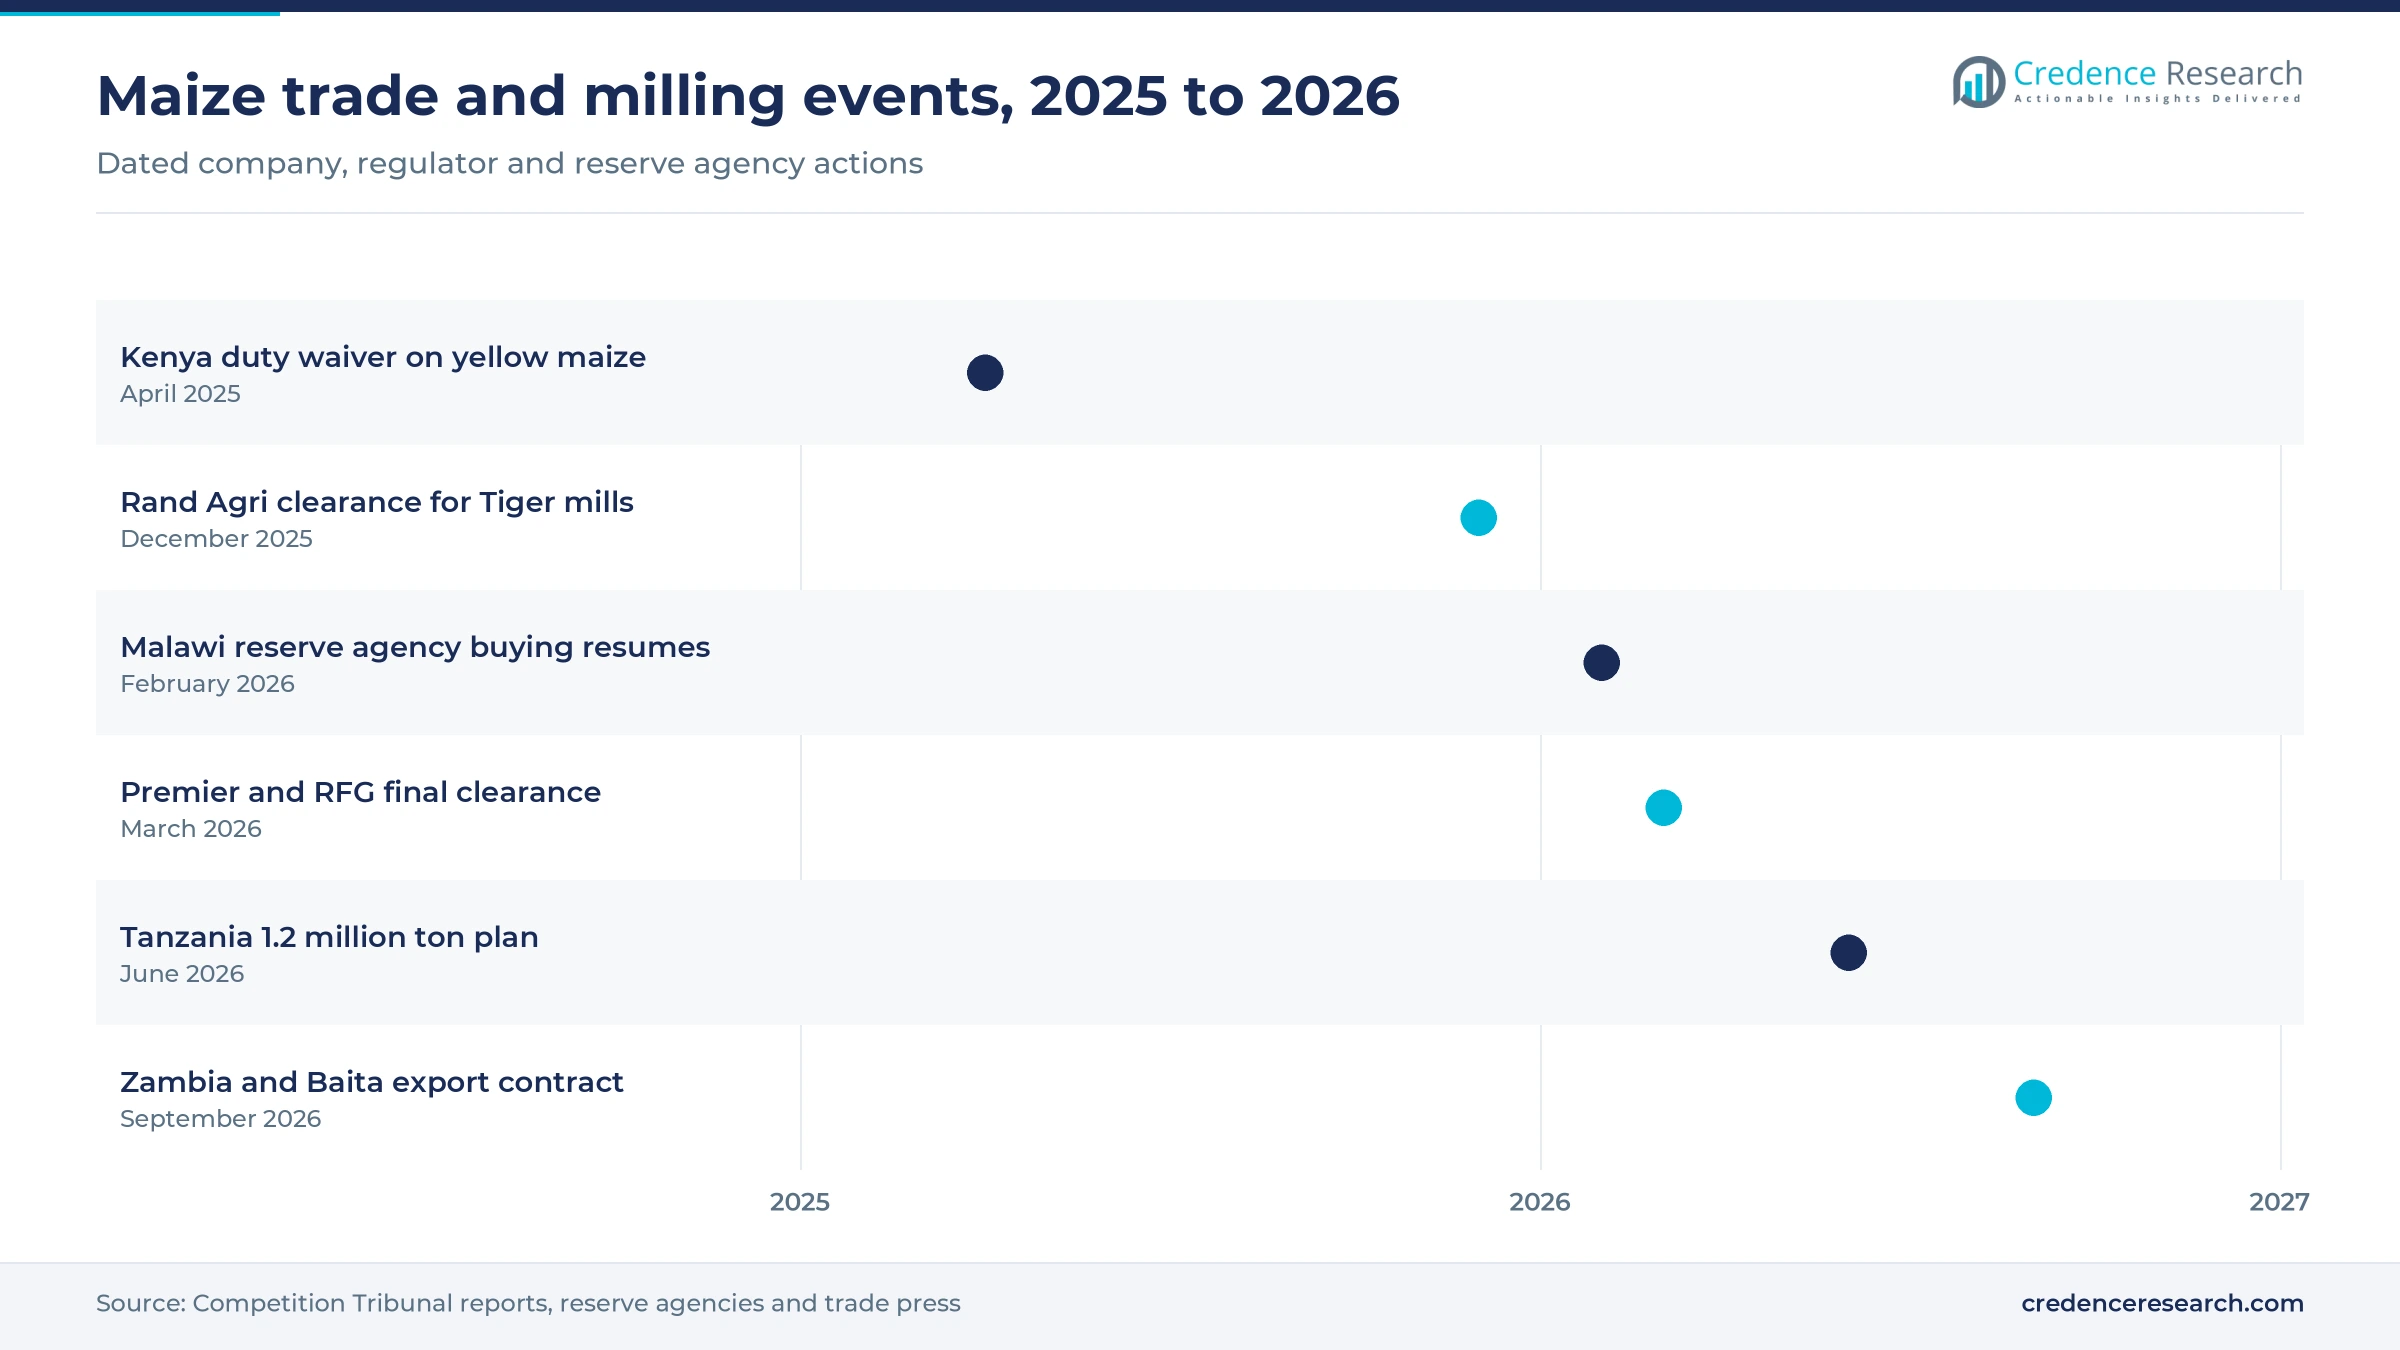
- Zambia signed a 540,000-ton export contract with a Kenyan private buyer on Sept. 9, 2026, which shows a shift toward scheduled commercial shipments.
- Premier received final clearance for its RFG takeover in March 2026, and Rand Agri Holdings gained approval for inland milling assets in December 2025.
Whole grain and white maize anchor the value pool
Why does dry whole grain lead product type revenue?
Based on product type, the market is categorized into dry whole grain, maize meal and flour, grits and samp, and bran and germ. Dry whole grain led with 58.0% of 2025 value because most trade still moves unmilled, and Grain SA counted 3.52 million tons of whole maize in its Aug. 27, 2026, export projection. Grits and samp grows fastest at 3.71% a year as brewers need degermed grain. Creamer Media reported on Dec. 8, 2025, that Rand Agri Holdings, owner of a grits mill in Bethal, won approval to buy inland mills from Tiger Consumer Brands.
Why does white maize keep the larger crop share?
Based on crop type, the market is categorized into white maize, yellow maize and specialty maize. White maize led with 56.0% of 2025 value because eastern and southern households eat it daily, and South Africa's Crop Estimates Committee placed the 2026 white crop at 9.49 million tons against 7.91 million tons of yellow. Specialty maize grows fastest at 4.03% a year as nutrition programs scale, and HarvestPlus lists 63 vitamin A varieties released across 10 African countries, with about 2.4 million households growing them in 2021.
Why does human food still outweigh feed use?
Based on application, the market is categorized into human food, animal feed and industrial grain use. Human food led with 62.0% of 2025 value because maize is an everyday meal rather than a processing input, and World Grain reported on Dec. 30, 2025, that about 85% of Ethiopian output goes to human consumption. Animal feed grows fastest at 3.59% a year as livestock integrators buy more grain. Grain SA expects white maize feed use in South Africa to reach 1.2 million tons in 2026/27, up from just over 500,000 tons a season earlier.
Why do grain merchants and aggregators dominate selling?
Based on distribution channel, the market is categorized into direct supply contracts, grain merchants and aggregators, wholesale and retail outlets, and public procurement tenders. Grain merchants and aggregators led with 44.0% of 2025 value because production is scattered, and one Ugandan study funded by the African Centre for Technology Studies found about 86% of 4.2 million farm households grow maize. Direct supply contracts grow fastest at 3.45% a year as large buyers lock in volume, shown by the Sept. 9, 2026, Zambian contract that schedules shipments in six batches.
| Segment Group | Leading Sub-segment | Share, 2025 | Fastest-growing Sub-segment | CAGR, 2026–2035 |
|---|---|---|---|---|
| By Product Type | Dry whole grain | 58.0% | Grits and samp | 3.71% |
| By Crop Type | White maize | 56.0% | Specialty maize | 4.03% |
| By Application | Human food | 62.0% | Animal feed | 3.59% |
| By Distribution Channel | Grain merchants and aggregators | 44.0% | Direct supply contracts | 3.45% |
Request a Free Sample
Fill in your details and we'll send you a free sample report.
- Sample data tables & charts
- Research methodology
Milling, feed and supply gaps lift purchases
Staple food processing demand keeps mills running
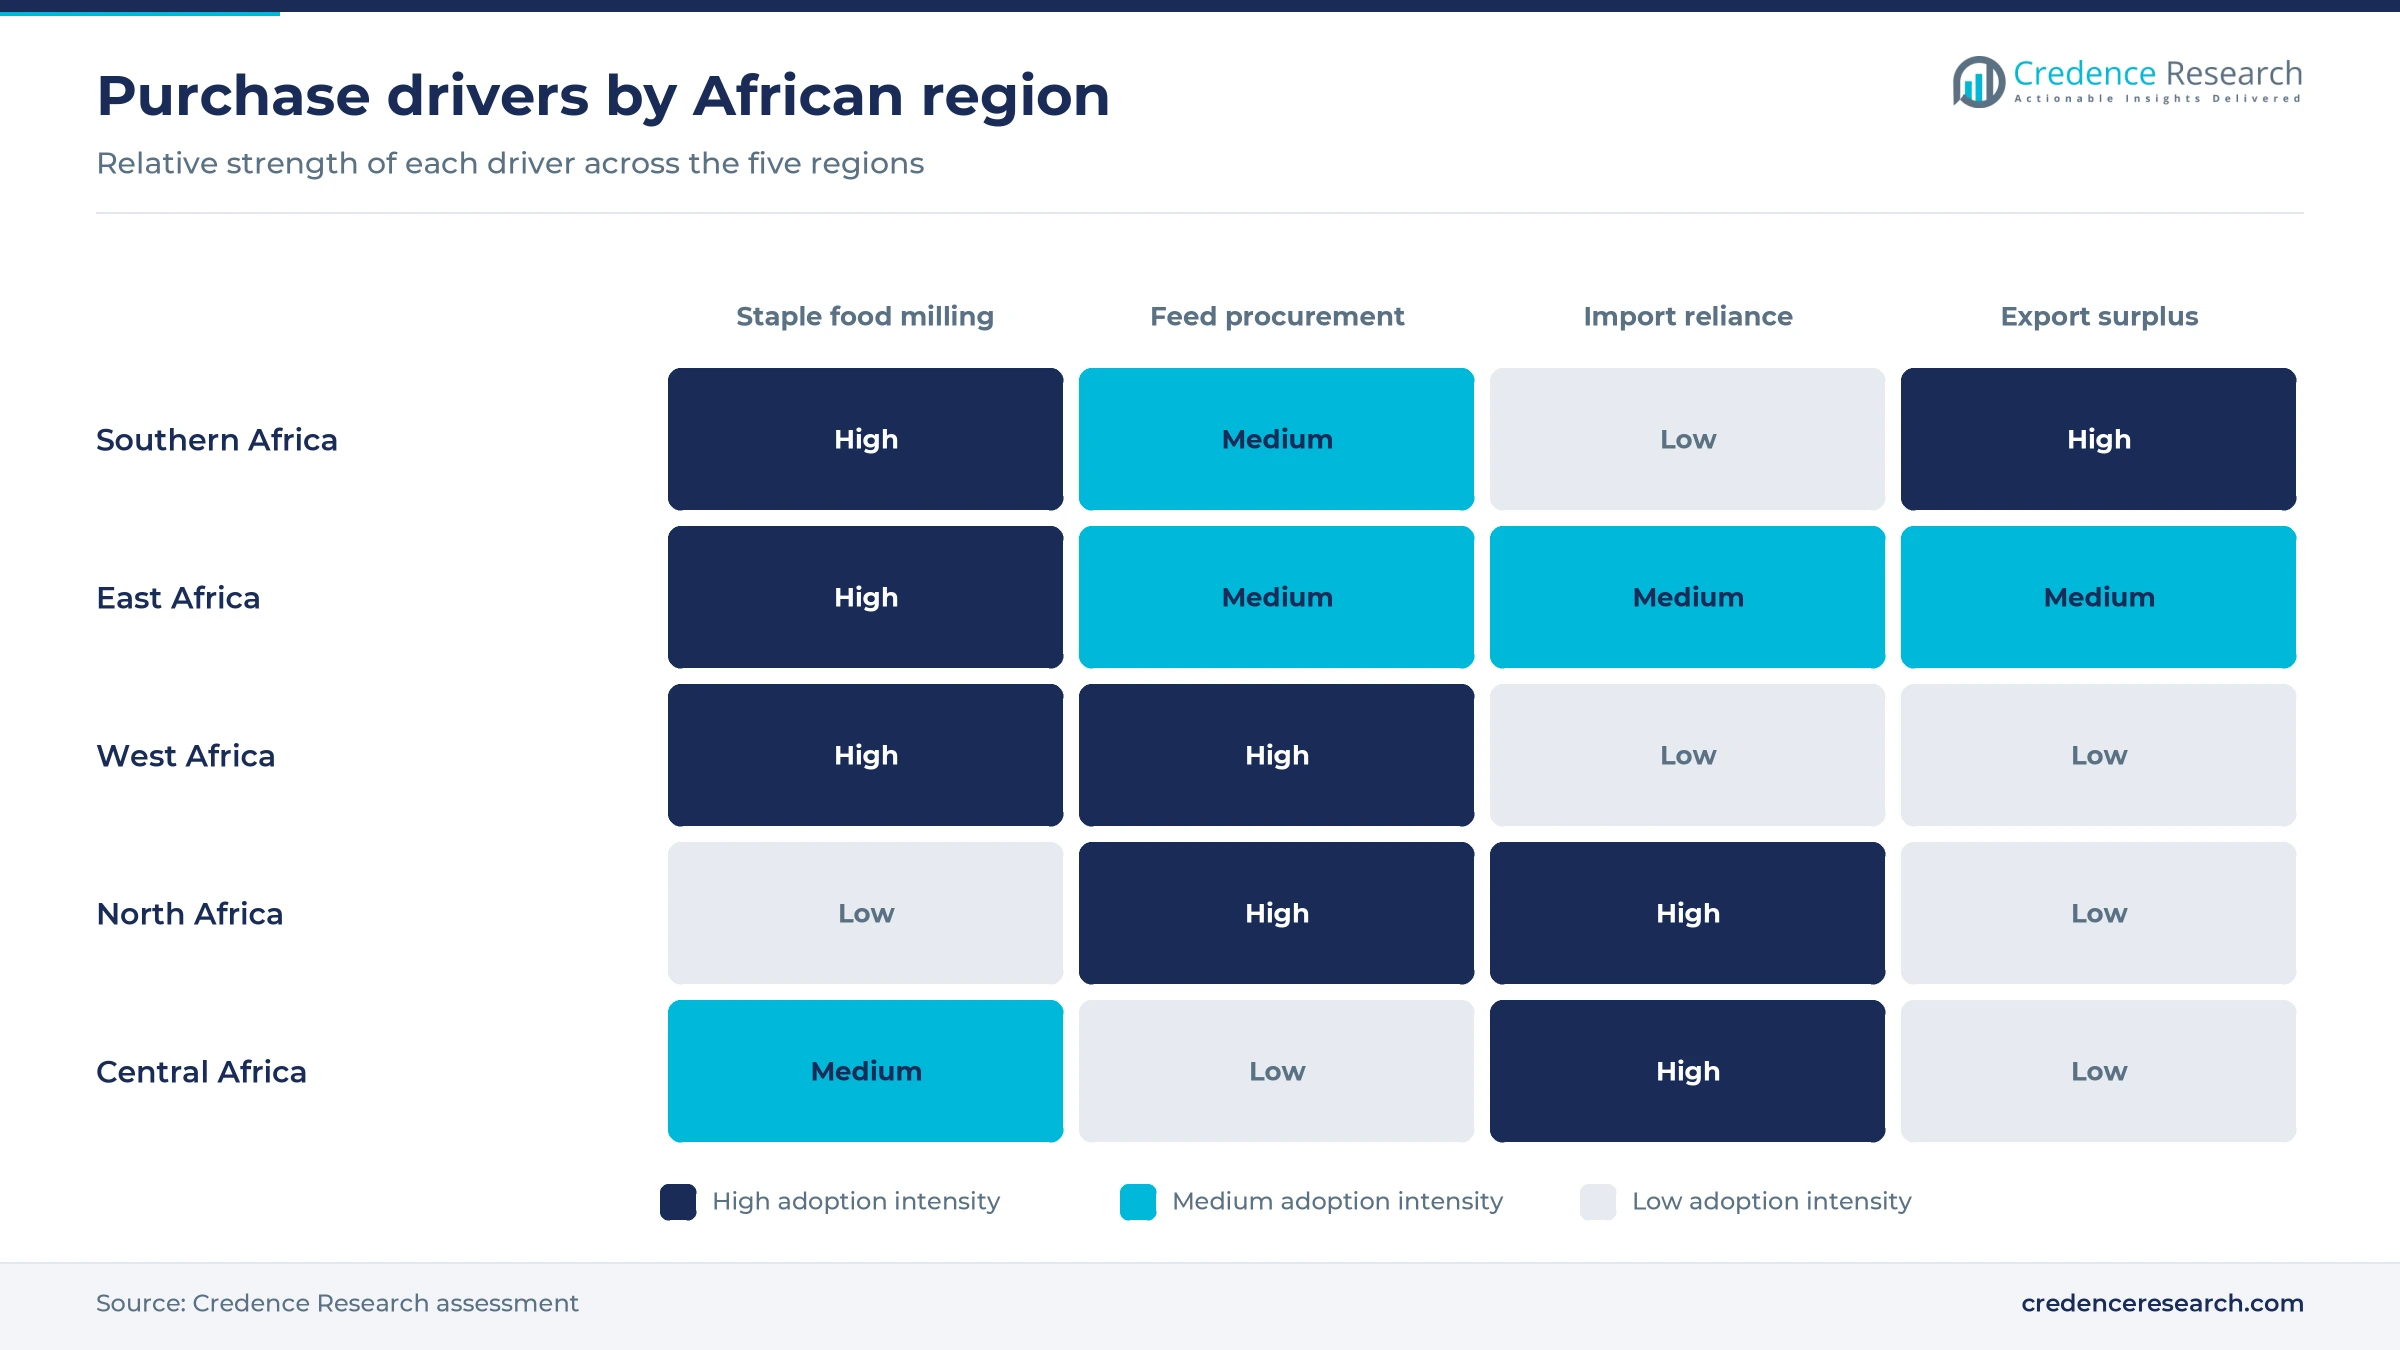
Staple food processing supports the largest block of purchases because packaged meal replaces home milling in many towns. Grain SA projected 4.99 million tons of white maize food use in South Africa for 2026/27, far above that country's white feed use. In East Africa, Kenya Millers Fortification Index results from September 2025 showed that 18 companies with brands scoring above 80% held 55% of maize flour sales. Those buyers need dependable grain quality throughout the whole year. Ethiopia adds a further base, since World Grain put the 2025-26 national maize consumption projection at 7.82 million tons. As a result, Human food kept 62.0% of 2025 value, and millers such as Unga and Capwell continue to source grain well beyond their home districts.
Feed procurement expansion lifts yellow grain buying
Feed procurement is the strongest source of added volume because poultry and fish producers buy grain on large, repeat schedules. Milling Middle East & Africa reported a record 13.2 million ton USDA forecast for Egyptian corn imports in 2026/27, with poultry and aquaculture taking more than 85% of domestic use. Egypt also produced 1.92 billion broilers in 2025, compared with about 1.4 billion before 2023. In Nigeria, USDA values the feed sector above $2 billion, and feed makes up about 70% of operating costs for most livestock operations. Demand for poultry feed therefore explains why Animal feed grows at 3.59% annually.
Regional milling network development widens grain reach
Regional milling groups are expanding their footprint, which pulls grain from more origins and gives branded meal wider distribution. The Billionaires Africa website reported in April 2026 that Bakhresa Group reached about 8,560 tons of daily milling capacity, with operations in markets including Malawi, Mozambique, Zambia and Uganda. In South Africa, Farmer's Weekly reported in March 2025 that Pride Milling can process 750,000 tons of maize and other grain products a year across five plants. Consolidation adds scale as well, since Food Business Middle East & Africa reported in March 2026 that Premier cleared its final hurdle in the RFG deal. These networks also supply cereal flour lines, so Dry whole grain remains essential to mill input at 58.0% of 2025 value.
National supply gaps sustain import and tender activity
National supply gaps keep traders and state buyers active because several large consumers cannot fill their needs from local harvests. Nigeria's minister of state for agriculture said in March 2026 that the country needs at least 25 million tons annually, while USDA data reported by Milling Middle East & Africa put 2025/26 output at 11.9 million tons. Kenya's 2026 Economic Survey, cited by Business Daily, showed 2025 imports up 51.4% to 468,109 tons. Malawi faces a smaller but persistent gap, with 3.3 million tons projected against a 3.5 million ton requirement, according to AgriFocus Africa in June 2026. Each shortfall creates a purchasing round for merchants, and Grain merchants and aggregators therefore held 44.0% of 2025 value.
Surplus corridors and new seed reshape supply
Rise of scheduled cross-border surplus shipments
Surplus countries are moving from occasional relief sales toward scheduled commercial shipments, which gives buyers more planning certainty. Zambia's Food Reserve Agency signed a 540,000-ton contract with Kenya-based Baita Trading on Sept. 9, 2026, covering white non-GMO maize with 100,000 tons shipped every three months. Milling Middle East & Africa also reported in July 2025 that Zambia planned to send 1 million tons to the Democratic Republic of Congo through the Kasumbalesa crossing. Tanzania follows the same logic, since The Citizen reported in June 2026 that its National Food Reserve Agency plans to procure 1.2 million tons of cereals partly for regional export. South African white exports to sub-Saharan buyers, projected at 1.1 million tons by Grain SA, complete the picture.
Shift toward drought-tolerant and insect-protected seed
Planting rules are shifting in several producing countries, although the pace differs and buyers must track each national rule. World Grain reported on Dec. 30, 2025, that Ethiopia expects a bumper 2025-26 crop after approving genetically engineered varieties, building on output of about 10.2 million tons in 2024. Nigeria's biosafety agency issued a TELA maize permit dated Oct. 8, 2021, and News Agency of Nigeria reported in December 2023 that commercial release was planned for 2024. Kenya moved differently, because The Star recorded that the Court of Appeal blocked government imports of genetically modified food in March 2025. Kenya's April 2025 feed waiver also specified non-GMO yellow grain for vetted millers, so importers must source with each country's regulatory status in mind.
Opportunity in fortified meal and nutrition-led brands
Fortified meal offers millers an opening to earn better margins, since institutional buyers and retailers increasingly compare brands on verified nutrition scores. The Kenya Millers Fortification Index covered 26 millers and 113 brands in its 2025 cycle, and Unga Limited ranked as top performer for the second straight year. HarvestPlus reports vitamin A varieties in Ghana, Malawi, Nigeria, Rwanda, Tanzania, Zambia and Zimbabwe, which gives processors a seed base for naturally enriched products. Brand owners also have regional scale to work with, as Premier sells Snowflake and Iwisa in South Africa. Products such as cornmeal can follow this route, and Specialty maize could therefore sustain 4.03% annual growth through 2035.
Opportunity in storage, grits and by-product recovery
Storage and value recovery offer an opening because grain losses and low-value by-products still absorb profits that better handling could keep. Milling Middle East & Africa reported that Cameroon loses about 11% of its maize after harvest, while breweries and feed mills rank among its major users. AFGRI's silo platform showed the scale possible when it held about 4.7 million tons of storage across six South African provinces in 2019. Brewers have invested upstream too, as SABC built a 30,000-ton grits plant at Mbankomo, Cameroon, for XAF 18 billion, with inauguration planned for August 2021. In Lusaka, Mushe Milling already sells maize bran beside breakfast and roller meal from a 168-ton daily plant, and suppliers of compound feed are natural buyers.
Weather, toxins and price swings squeeze margins
El Niño risk and fertilizer costs threaten planting returns
Weather and input costs threaten the next South African crop, which matters to every regional importer. Wandile Sihlobo of Agbiz named expected El Niño drought as the biggest risk to the summer crop planted from October 2026. Milling Middle East & Africa also reported maize fertilizer costs above R10,000 per hectare on the eastern Highveld. Growers on thin margins may therefore shift hectares into soybeans or sunflower, and buyers in neighboring countries could face tighter white maize supply unless they contract earlier.
Aflatoxin rejection exposes weak grain quality controls
Aflatoxin contamination exposes traders to costly rejections, particularly on the East African corridors where small lots are mixed. Daily Monitor reported in October 2023 that Uganda prepared to destroy 1,700 tons of maize worth about $2 million after South Sudan refused consignments and retests failed. The East African Community limit for aflatoxin B1 in food is only five parts per billion. Exporters and millers consequently bear testing costs and lost cargo, and the practical response is faster drying, sealed storage and origin-level sampling.
Shrinking Nigerian area and high prices pressure feed mills
Nigeria shows how falling area and high prices hurt downstream buyers quickly. Nairametrics reported in March 2026 that harvested area fell to about 5.1 million hectares in 2024/25, the lowest since 2010/11, amid insecurity and rising costs. Earlier, the National Bureau of Statistics recorded a 79.5% annual rise in white maize prices in December 2023, and Premier Feed Mills suspended purchases in February 2024. Poultry producers then absorb higher costs, which limits flock expansion unless imports or better yields close the gap.
Sudden price swings and policy moves unsettle buyers
Sudden price and policy changes make forward purchasing difficult for farmers, millers and state agencies alike. The Star reported on June 17, 2026, that Kenyan wholesale prices fell from Sh4,600 to Sh4,000 per 90-kilogram bag on cheap regional imports. Malawi saw a different pressure, since prices fell about 15% from March to April 2026 to K892 per kilogram yet stayed far above the 2022 to 2024 average, according to AgriFocus Africa. Sellers and buyers therefore hold back, and reserve agencies must keep adjusting buying prices to steady supply.
Southern output leads while Central imports climb
| Region | Value, 2025 (USD billion) | Share, 2025 | CAGR, 2026–2035 |
|---|---|---|---|
| Southern Africa | 11.48 | 28.0% | 2.56% |
| East Africa | 10.25 | 25.0% | 3.16% |
| West Africa | 9.43 | 23.0% | 3.36% |
| North Africa | 7.38 | 18.0% | 2.86% |
| Central Africa | 2.46 | 6.0% | 3.76% |
Southern Africa leads on commercial crop scale
Southern Africa held 28.0% of 2025 value and grows at 2.56% a year because its commercial farms set regional supply. The Crop Estimates Committee placed South Africa's 2026 crop at 17.4 million tons on Aug. 26, 2026, with Free State, Mpumalanga and North West supplying 82%. Zambia's statistics agency forecast 4.937 million tons in May 2026, which adds exportable surplus. Slower growth reflects a mature base rather than weaker use.
East Africa pairs staple demand with feed imports
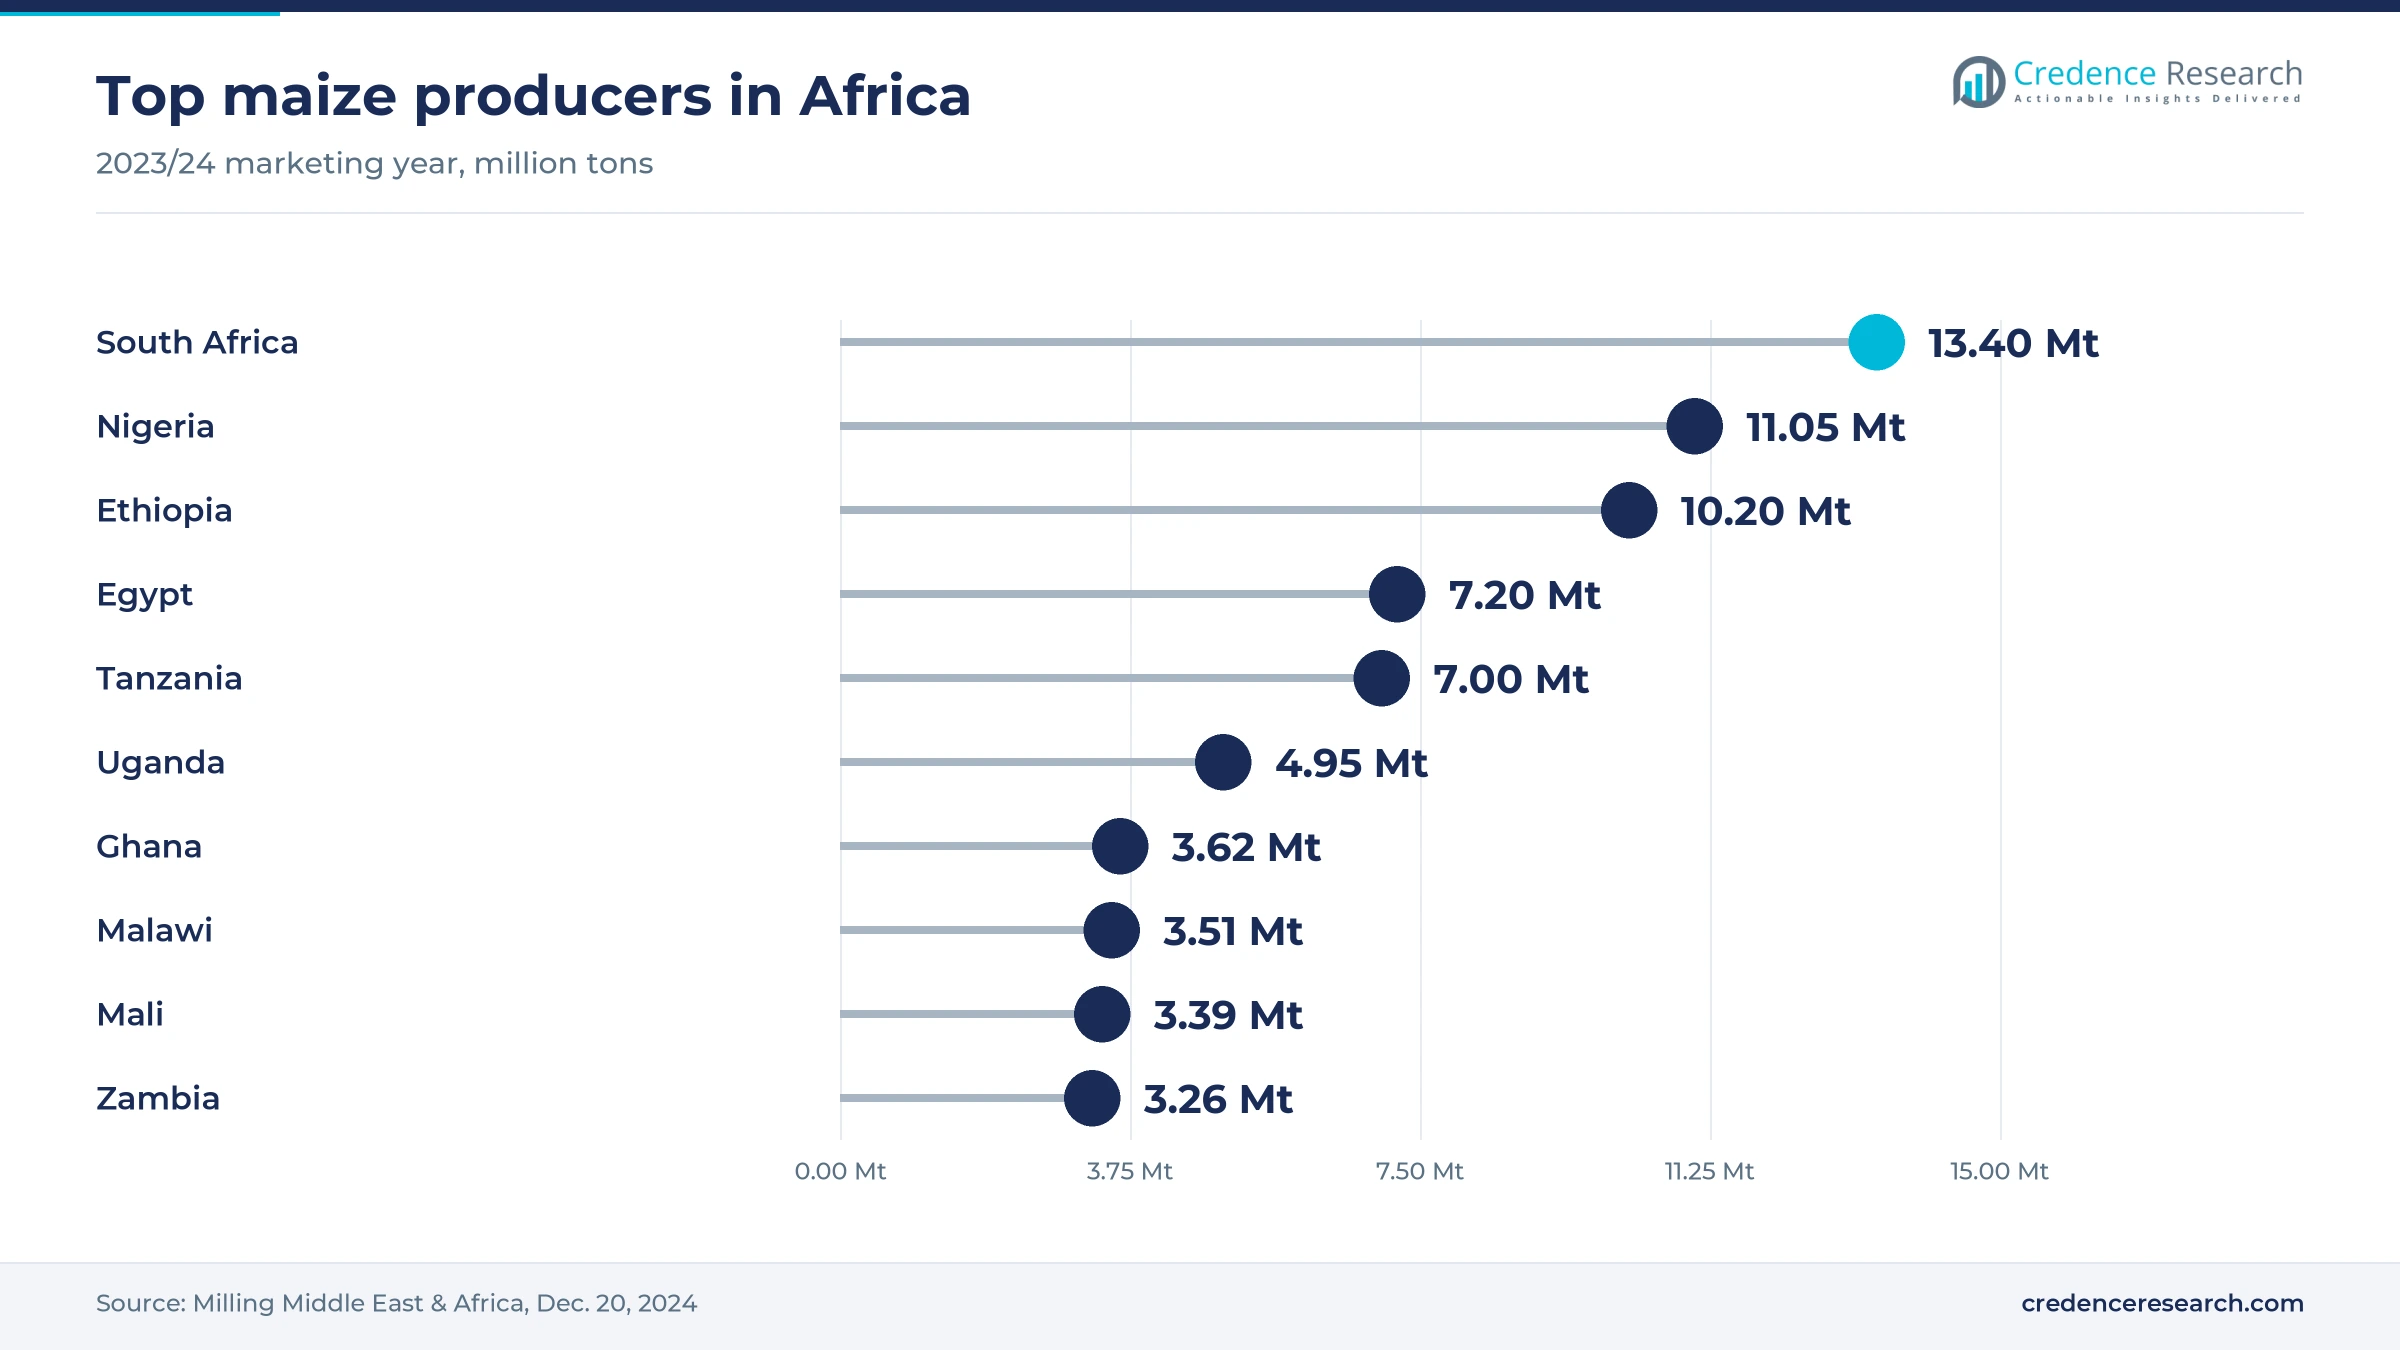
East Africa held 25.0% of 2025 value and grows at 3.16% a year because food demand and feed needs overlap. Milling Middle East & Africa ranked Ethiopia, Tanzania and Uganda among the top six producers in 2023/24, at 10.2, 7 and 4.95 million tons. Kenya remains the swing buyer, since its 2025 output of 45.8 million bags fell below a requirement of about 50 million bags reported by The Star. Consequently, Kenyan buyers draw grain from Comesa suppliers, including the Zambian contract signed in 2026.
West Africa grows on Nigerian feed and food needs
West Africa held 23.0% of 2025 value and grows at 3.36% a year, with Nigeria shaping the regional balance. USDA figures reported by Milling Middle East & Africa put Nigerian 2025/26 consumption at 12.2 million tons and imports at 260,000 tons, up from 125,000 tons. Ghana and Mali add depth at 3.62 and 3.39 million tons of 2023/24 output. Feed makers sit in a Nigerian sector that USDA values above $2 billion, although insecurity and input costs limit farm expansion.
North Africa buys imported grain for poultry and fish
North Africa held 18.0% of 2025 value and grows at 2.86% a year because Egyptian feed demand dominates purchasing. Egypt's domestic crop covers only about one-third of need, and USDA's Cairo office expects Brazil to capture much of the added demand, according to Milling Middle East & Africa. However, traders cited by Milling Middle East & Africa in June 2026 described ample local stocks and softer poultry demand. Import timing therefore depends on flock economics and foreign exchange as much as on the size of the harvest.
Central Africa climbs from a low-yield base
Central Africa held 6.0% of 2025 value and grows fastest at 3.76% a year because purchased grain fills a widening local gap. Milling Middle East & Africa reported that Cameroon averaged 1.8 tons per hectare in 2023 against 6.4 tons in South Africa, and that its 2024 imports rose 103.1% to 81,833 tons. Breweries and feed mills are major industrial users of grain there. The Democratic Republic of Congo adds southern demand, supplied through the Kasumbalesa border crossing from Zambia.
Mergers, tenders and export deals since 2025
| Development | Status and market relevance |
|---|---|
| In March 2026, Premier received final Competition Tribunal clearance for its RFG Holdings takeover, subject to a three-year restriction on job cuts. | Approved; adds scale beside the Snowflake and Iwisa brands |
| In December 2025, the Competition Tribunal approved Rand Agri Holdings' purchase of Tiger Consumer Brands' inland mills, including a white maize plant. | Approved with employment conditions; includes the Ace plant at Potchefstroom |
| In February 2026, Malawi's National Food Reserve Agency resumed maize purchases at MWK 840 per kilogram at depots nationwide. | Active; supports reserves and rural cash flow |
| In June 2026, Tanzania's National Food Reserve Agency announced a plan to procure 1.2 million tons of cereals in the 2026/27 fiscal year. | Planned; supports prices and regional exports |
| In September 2026, Zambia's Food Reserve Agency signed a white maize export contract with Kenya-based Baita Trading. | Signed; six batches scheduled |
Milling, storage and seed tools raise grain value
- Roller milling separates bran and germ from meal, and Mushe Milling in Lusaka uses a 168-ton daily plant to sell roller meal, breakfast meal and bran.
- Silo and bunker storage protects grain between harvest and sale, and AFGRI reported about 4.7 million tons of capacity in South Africa in 2019.
- Micronutrient fortification adds verified nutrition to meal, and the Kenya Millers Fortification Index scored 113 brands in its 2025 cycle.
- Drought-tolerant and insect-protected seed targets yield loss from dry spells and pests, and TELA varieties hold a 2021 Nigerian permit while Ethiopia approved similar seed in 2025.
Need a Custom Version of This Report?
Tailor the scope, geography, or segments to your exact requirements.
- Custom geography or segment scope
- Direct access to our analyst team
Regional millers compete on brands and origination
Competition is regional rather than continental, because grain sourcing, staple tastes and brand loyalty differ by country. In South Africa, Premier competes through Snowflake and Iwisa, while Pride Milling focuses on large-volume processing near growing areas and Pioneer Foods, which PepsiCo agreed to buy in 2019, makes maize meal alongside other staples. AFGRI brings grain storage and milling links through its group structure. In East Africa, Unga, Capwell and Pembe compete for Kenyan shoppers with Jogoo, Soko and Pembe brands, and Bakhresa sells Azam maize products from its Tanzanian base. Mushe Milling, owned by ZCCM Investments Holdings, is one of 78 registered millers in Zambia. Companies mainly compete on grain procurement timing, consistent quality, fortification scores and distribution reach.
Companies profiled and their roles in this market
| Company | Type | Role in the market |
|---|---|---|
| Premier FMCG | Branded food group | Sells Snowflake and Iwisa, and took over RFG Holdings following 2026 clearance |
| AFGRI | Grain services and storage | Runs grain storage in South Africa, with mills through Philafrica Foods |
| Bakhresa Group | Regional miller | Sells Azam maize products from Tanzania and operates in several neighboring countries |
| Unga Group | Kenyan miller | Makes Jogoo maize meal and topped the 2025 Kenya fortification index |
| Pride Milling | South African miller | Operates five plants in Gauteng and Mpumalanga for food and industrial maize |
| Pembe Flour Mills | Kenyan miller | Sells Pembe maize flour in the Kenyan staple market |
| Capwell Industries | Kenyan miller | Sells Soko and Amaize maize meal brands |
| Mushe Milling | Zambian miller | Makes breakfast meal, roller meal and bran in Lusaka |
| Pioneer Foods | Food manufacturer | Makes maize meal among staples, with a PepsiCo purchase agreed in July 2019 |
Supply security decides who wins the next decade
Credence Research's view is that supply security, not consumer demand, will separate stronger buyers from weaker ones through 2035. Millers and feed makers that hold storage, contract early and buy from two or more origins should carry less risk when weather or policy interrupts trade. South Africa and Zambia currently offer the largest tradable surplus, yet a possible El Niño season shows why that cannot be assumed each year. The most assumption-heavy estimate is the split between regions, since informal cross-border trade goes partly unrecorded in official statistics.
How Credence Research built the estimates
The report uses 2025 as the base year and 2026 to 2035 as the forecast period. Market values come from the Credence Research model and were checked against crop volumes and grain prices. Regional and segment shares are Credence Research estimates informed by public production, import and consumption data. Sources include crop estimate committees, USDA reports, government statements, the Grain SA balance sheet, trade publications and company pages. No interviews or surveys were conducted for this report edition.
Feed and contract buying set the path to 2035
Through 2035, the market is expected to reach USD 55.41 billion as feed buying, branded meal and scheduled trade grow steadily at 3.02% a year. Egyptian poultry and Nigerian feed makers will keep yellow grain tight during weak seasons, while white maize remains the core household staple in southern and eastern countries. Direct contracts should gain ground from spot trading, particularly where reserve agencies and private exporters publish shipping schedules. Investors should therefore watch silo capacity, seed approval decisions and export policy, since these three factors will shape how reliably surplus reaches buyers.
Frequently Asked Questions
How big is the Africa maize market?
Which region leads the Africa maize market?
Which region is growing fastest?
Which product type holds the largest share?
Why is animal feed the fastest-growing application?
What are the main risks for maize buyers in Africa?
How are Africa maize buyers changing their purchasing?
Which companies are active in the Africa maize market?
Table of Content
Chapter 1 Market Segmentation
- 1.1 Segmentation Framework
- 1.1.1 Product and Service Classification
- 1.1.2 Application and End-Use Classification
- 1.1.3 Technology and Solution Classification
- 1.1.4 Customer and Distribution Channel Classification
- 1.1.5 Geographic Segmentation
- 1.1.6 Market Segment Definitions and Boundaries
- 1.2 By Product Type
- 1.2.1 Dry whole grain
- 1.2.2 Maize meal and flour
- 1.2.3 Grits and samp
- 1.2.4 Bran and germ
- 1.3 By Crop Type
- 1.3.1 White maize
- 1.3.2 Yellow maize
- 1.3.3 Specialty maize
- 1.4 By Application
- 1.4.1 Human food
- 1.4.2 Animal feed
- 1.4.3 Industrial grain use
Chapter 2 Introduction
- 2.1 Report Objectives and Scope
- 2.2 Product Definition and Industry Terminology
- 2.3 Market Inclusions and Exclusions
- 2.4 Research Process
- 2.4.1 Primary Research and Expert Interviews
- 2.4.2 Secondary Research and Source Review
- 2.4.3 Top-Down and Bottom-Up Estimation
- 2.4.4 Data Triangulation and Verification
- 2.5 Market Size Measurement Basis
- 2.5.1 2025: USD 40.99 billion → 2035: USD 55.41 billion
- 2.6 Historical and Forecast Reference Periods
- 2.6.1 Historical Period: 2018-2025
- 2.6.2 Base Year: 2025
- 2.6.3 Forecast Period: 2025-2035
- 2.7 Research Assumptions and Limitations
Chapter 3 Executive Summary
- 3.1 Market Snapshot and Key Findings
- 3.2 Base-Year Market Size, 2025
- 3.3 Forecast Market Size, 2035
- 3.4 Revenue and Volume Growth Outlook
- 3.5 Key Demand and Supply Indicators
- 3.6 Leading Market Segments
- 3.7 Fastest-Growing Market Opportunities
- 3.8 Regional Performance Highlights
- 3.9 Technology and Industry Transformation
- 3.10 Competitive Landscape Summary
- 3.11 Analyst View and Strategic Implications
Chapter 4 Africa Maize Market Trends and Developments
- 4.1 Historical Industry Development, 2018-2025
- 4.2 Recent Market Trends and Developments
- 4.3 Demand and Customer Behavior Trends
- 4.4 Technology and Product Innovation
- 4.5 Artificial Intelligence, Automation and Digitalization
- 4.6 Local Manufacturing and Supply Chain Realignment
- 4.7 Industry Partnerships, Mergers and Acquisitions
- 4.8 Sustainability and Circular Economy Developments
- 4.9 Government and Private Sector Investment Trends
- 4.10 Emerging Business Models and Commercialization
- 4.11 Industry Developments and Announcements
Chapter 5 Africa Maize Market Production, Supply and Demand Analysis
- 5.1 Demand Trend and Consumption Analysis, 2018-2025
- 5.2 Demand Forecast, 2025-2035
- 5.3 Production and Output Trend, 2018-2025
- 5.4 Production and Output Forecast, 2025-2035
- 5.5 Installed Capacity and Capacity Utilization
- 5.6 Company-Wise Production Plants and Statistics
- 5.6.1 Installed Production Capacity
- 5.6.2 Actual Production
- 5.6.3 Planned Capacity and Expansion Targets
- 5.7 Supply Chain Structure and Procurement Trends
- 5.8 Supply-Demand Gap and Bottlenecks
- 5.9 Import Dependence and Sourcing Structure
- 5.10 Contract Manufacturing and Outsourcing
- 5.11 Regional Supply and Demand Concentration
Chapter 6 Africa Maize Market Pricing Analysis
- 6.1 Pricing Structure and Measurement
- 6.2 Historical Pricing Trends, 2018-2025
- 6.3 Pricing Outlook, 2025-2035
- 6.4 Average Selling Price and Unit Economics
- 6.5 Pricing by Product and Market Segment
- 6.6 Geographic Pricing Differences
- 6.7 Key Input, Energy, Labor and Logistics Costs
- 6.8 Contract Pricing and Purchasing Models
- 6.9 Pricing Sensitivity and Competitive Positioning
- 6.10 Price, Margin and Profitability Implications
Chapter 7 Africa Maize Market Dynamics
- 7.1 Market Growth Drivers
- 7.1.1 Demand-Side Drivers
- 7.1.2 Technology and Innovation Drivers
- 7.1.3 Infrastructure and Investment Drivers
- 7.1.4 Regulatory and Policy Drivers
- 7.2 Market Restraints
- 7.2.1 Cost and Affordability Constraints
- 7.2.2 Technology and Adoption Barriers
- 7.2.3 Supply Chain and Operational Constraints
- 7.3 Market Challenges
- 7.3.1 Competitive Pressure and Margin Erosion
- 7.3.2 Skills, Infrastructure and Implementation Gaps
- 7.4 Emerging Market Opportunities
- 7.5 Market Dynamics Impact and Time-Horizon Assessment
Chapter 8 Africa Maize Value Chain Analysis
- 8.1 Industry Value Chain Overview
- 8.2 Upstream Suppliers and Critical Inputs
- 8.3 Technology and Component Providers
- 8.4 Manufacturing or Service Delivery
- 8.5 Distribution, Channel Partners and Integrators
- 8.6 Downstream Applications and End Users
- 8.7 Value Addition and Profit Pools
- 8.8 Vertical Integration and Outsourcing
- 8.9 Supplier Concentration and Risk
- 8.10 Supply Chain Localization and Resilience
Chapter 9 Africa Maize Market Regulations and Policies
- 9.1 Relevant Laws, Standards and Compliance Frameworks
- 9.2 Product, Service, Safety and Quality Requirements
- 9.3 Government Policies, Incentives and Subsidies
- 9.4 Imports, Exports and Trade Barriers
- 9.5 Public Procurement and Local Content Requirements
- 9.6 Environmental and Sustainability Compliance
- 9.7 Upcoming Policy Changes and Market Implications
Chapter 10 Africa Maize Market Hotspots and Opportunities
- 10.1 Market Opportunity Mapping and Growth Hotspots
- 10.2 High-Growth Applications and Customer Groups
- 10.3 Underserved Markets and White-Space Opportunities
- 10.4 Emerging Technology and Product Opportunities
- 10.5 New Capacity and Investment Hotspots
- 10.6 Market Entry and Expansion Opportunities
- 10.7 Distribution and Partnership Opportunities
- 10.8 Near-Term and Long-Term Commercial Potential
- 10.9 Opportunity Attractiveness and Execution Risks
Chapter 11 Africa Maize Market Outlook, 2025-2035
- 11.1 Market Size and Analysis
- 11.1.1 Revenue (Market Measurement: 2025: USD 40.99 billion → 2035: USD 55.41 billion)
- 11.1.2 Market Volume and Quantity Sold
- 11.1.3 Historical Market Size, 2018-2025
- 11.1.4 Base-Year Market Size, 2025
- 11.2 Market Forecast, 2025-2035
- 11.2.1 Revenue Forecast to 2035
- 11.2.2 Volume Forecast to 2035
- 11.2.3 CAGR and Year-on-Year Growth
- 11.2.4 Incremental Revenue Opportunity
- 11.3 Forecast Assumptions and Scenario Analysis
- 11.3.1 Base-Case Forecast
- 11.3.2 Optimistic and Conservative Scenarios
- 11.3.3 Technology, Pricing and Policy Sensitivities
- 11.4 Market Attractiveness and Growth Outlook
Chapter 12 Africa Maize Market Segmentation and Outlook
- 12.1 Segmentation Summary and Market Shares, 2025
- 12.2 Largest and Fastest-Growing Segments
- 12.3 By Product Type - Market Size and Forecast, 2025-2035
- 12.3.1 Segment Definition and Scope
- 12.3.2 Historical Market Size, 2018-2025
- 12.3.3 Revenue Forecast, 2025-2035
- 12.3.4 Volume Forecast, 2025-2035
- 12.3.5 Base-Year Market Share, 2025
- 12.3.6 Segment CAGR and Growth Drivers
- 12.3.7 Subsegment Market Size and Forecast
- 12.3.7.1 Dry whole grain
- 12.3.7.2 Maize meal and flour
- 12.3.7.3 Grits and samp
- 12.3.7.4 Bran and germ
- 12.3.8 Subsegment Pricing and Adoption Trends
- 12.3.9 Leading Suppliers and Competition
- 12.3.10 Regional Demand and Opportunities
- 12.4 By Crop Type - Market Size and Forecast, 2025-2035
- 12.4.1 Segment Definition and Scope
- 12.4.2 Historical Market Size, 2018-2025
- 12.4.3 Revenue Forecast, 2025-2035
- 12.4.4 Volume Forecast, 2025-2035
- 12.4.5 Base-Year Market Share, 2025
- 12.4.6 Segment CAGR and Growth Drivers
- 12.4.7 Subsegment Market Size and Forecast
- 12.4.7.1 White maize
- 12.4.7.2 Yellow maize
- 12.4.7.3 Specialty maize
- 12.4.8 Subsegment Pricing and Adoption Trends
- 12.4.9 Leading Suppliers and Competition
- 12.4.10 Regional Demand and Opportunities
- 12.5 By Application - Market Size and Forecast, 2025-2035
- 12.5.1 Segment Definition and Scope
- 12.5.2 Historical Market Size, 2018-2025
- 12.5.3 Revenue Forecast, 2025-2035
- 12.5.4 Volume Forecast, 2025-2035
- 12.5.5 Base-Year Market Share, 2025
- 12.5.6 Segment CAGR and Growth Drivers
- 12.5.7 Subsegment Market Size and Forecast
- 12.5.7.1 Human food
- 12.5.7.2 Animal feed
- 12.5.7.3 Industrial grain use
- 12.5.8 Subsegment Pricing and Adoption Trends
- 12.5.9 Leading Suppliers and Competition
- 12.5.10 Regional Demand and Opportunities
- 12.6 Segment Growth Comparison
- 12.7 Segment Attractiveness and Priority Matrix
Chapter 13 Africa Maize End-Use and Application Market Outlook
- 13.1 End-Use Industry and Customer Demand Structure
- 13.2 Leading Applications and Customer Groups
- 13.3 End-Use Market Size, Share and Forecast
- 13.4 Major End-Use Industry Deep Dives
- 13.4.1 Customer Requirements and Use Cases
- 13.4.2 Demand and Replacement Cycles
- 13.4.3 Technical and Regulatory Considerations
- 13.4.4 Purchasing and Procurement Models
- 13.4.5 Leading Vendors and Distribution Channels
- 13.4.6 Forecast and Commercial Opportunities
- 13.5 Emerging Applications and Cross-Segment Demand
- 13.6 End-Use Industry Investment Priorities
Chapter 14 Africa Maize Geographic Market Outlook, 2025-2035
- 14.1 Regional Market Size and Country-Level Shares, 2025
- 14.2 Country Market Size Comparison, 2025
- 14.3 Country Market Forecasts, 2025-2035
- 14.4 Subregional Industrial and Demand Clusters
- 14.5 Intra-Regional Pricing and Cost Differences
- 14.6 Cross-Border Trade and Supply Networks
- 14.7 Regional Supply and Demand Balances
- 14.8 Country Opportunity Comparison and Prioritization
Note: Every listed country is covered on the structure shown under the first country.
Chapter 15 Africa Maize Technology, Innovation and Sustainability Outlook
- 15.1 Technology Landscape and Maturity
- 15.2 Product, Process and Service Innovation
- 15.3 AI, Automation and Digital Tools in the Industry
- 15.4 Technology Adoption and Performance Benchmarking
- 15.5 Innovation Pipeline and R&D Investment
- 15.6 Patent and Intellectual Property Trends
- 15.7 Energy Efficiency and Resource Management
- 15.8 Sustainability, Recycling and Circularity
- 15.9 Technology Roadmap, 2025-2035
- 15.10 Risks of Obsolescence and Technology Substitution
Chapter 16 Africa Maize Market Key Strategic Imperatives
- 16.1 Growth and Market Entry Priorities
- 16.2 High-Return Products and Segments
- 16.3 Pricing, Profitability and Cost Optimization
- 16.4 Technology Investment and Product Differentiation
- 16.5 Supply Chain Localization and Resilience
- 16.6 Distribution and Customer Acquisition
- 16.7 Partnership, Acquisition and Capacity Strategy
- 16.8 Regional Expansion Priorities
- 16.9 Short-, Medium- and Long-Term Actions
Chapter 17 Competition Outlook
- 17.1 Industry Competition Characteristics
- 17.2 Market Structure and Concentration
- 17.3 Market Share and Competitive Positioning, 2025
- 17.4 Company-Wise Revenue and Product Benchmarking
- 17.5 Production and Service Capacity Benchmarking
- 17.6 Technology, Pricing and Differentiation
- 17.7 Regional Footprint and Distribution Strength
- 17.8 Mergers, Acquisitions and Strategic Alliances
- 17.9 New Entrants and Competitive Threats
- 17.10 Porter's Five Forces and Industry Attractiveness
- 17.11 Competitive Outlook, 2025-2035
Chapter 18 Company Profiles
- 18.1 Company Coverage and Selection Criteria
- 18.2 Premier FMCG
- 18.2.1 Business Description
- 18.2.2 Company Ownership and Geographic Presence
- 18.2.3 Product and Service Portfolio
- 18.2.4 Manufacturing and Operating Footprint
- 18.2.5 Production Capacity and Expansion Plans
- 18.2.6 Financial Performance and Investment
- 18.2.7 Market Share and Competitive Position
- 18.2.8 Technology and Innovation Capabilities
- 18.2.9 Strategic Alliances or Partnerships
- 18.2.10 Recent Developments
- 18.2.11 Growth Strategy and Outlook
- 18.3 AFGRI
- 18.4 Bakhresa Group
- 18.5 Unga Group
- 18.6 Pride Milling
- 18.7 Pembe Flour Mills
- 18.8 National Milling Corporation
- 18.9 Capwell Industries
- 18.10 Mushe Milling
- 18.11 Pioneer Foods
- 18.12 Other Relevant Market Participants
Note: Every listed company is profiled on the structure shown under the first company. The company list is preliminary and may change based on research findings, market developments, data availability and client requirements.
Chapter 19 Disclaimer
- 19.1 Research and Forecast Disclaimer
- 19.2 Data Source and Estimation Limitations
Note: The depth of individual sections depends on data availability for this market. Volume, capacity, trade and other unit-based metrics are included where applicable.

