
Argentina fruits and vegetables pair staples with exports
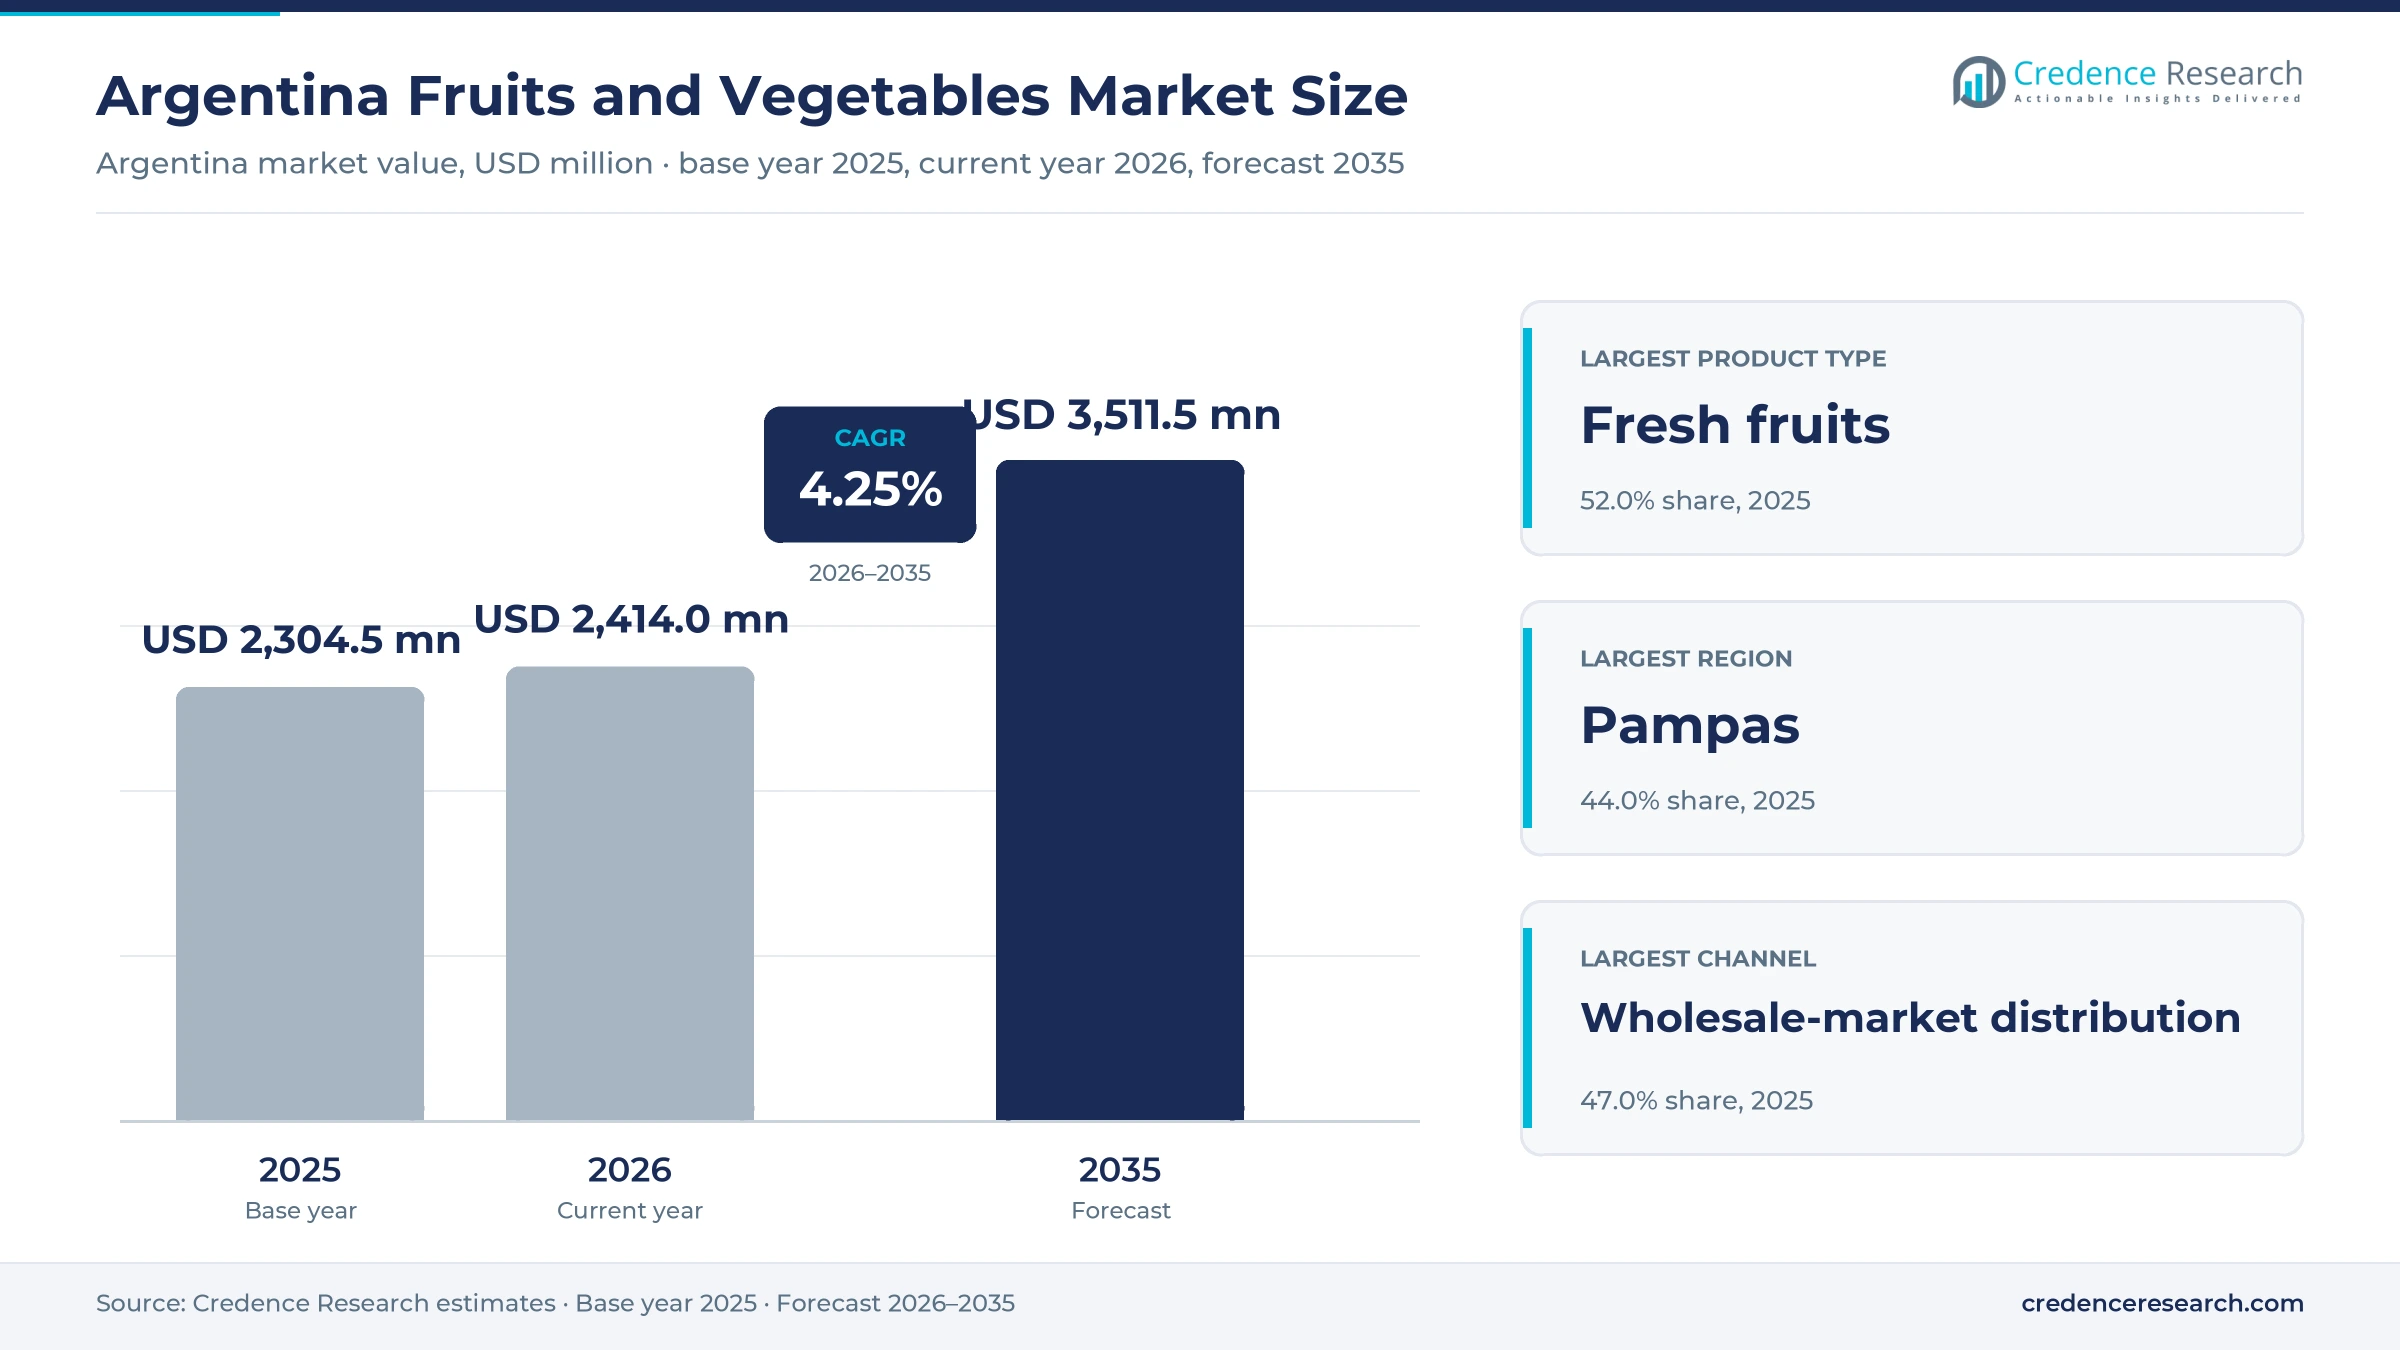
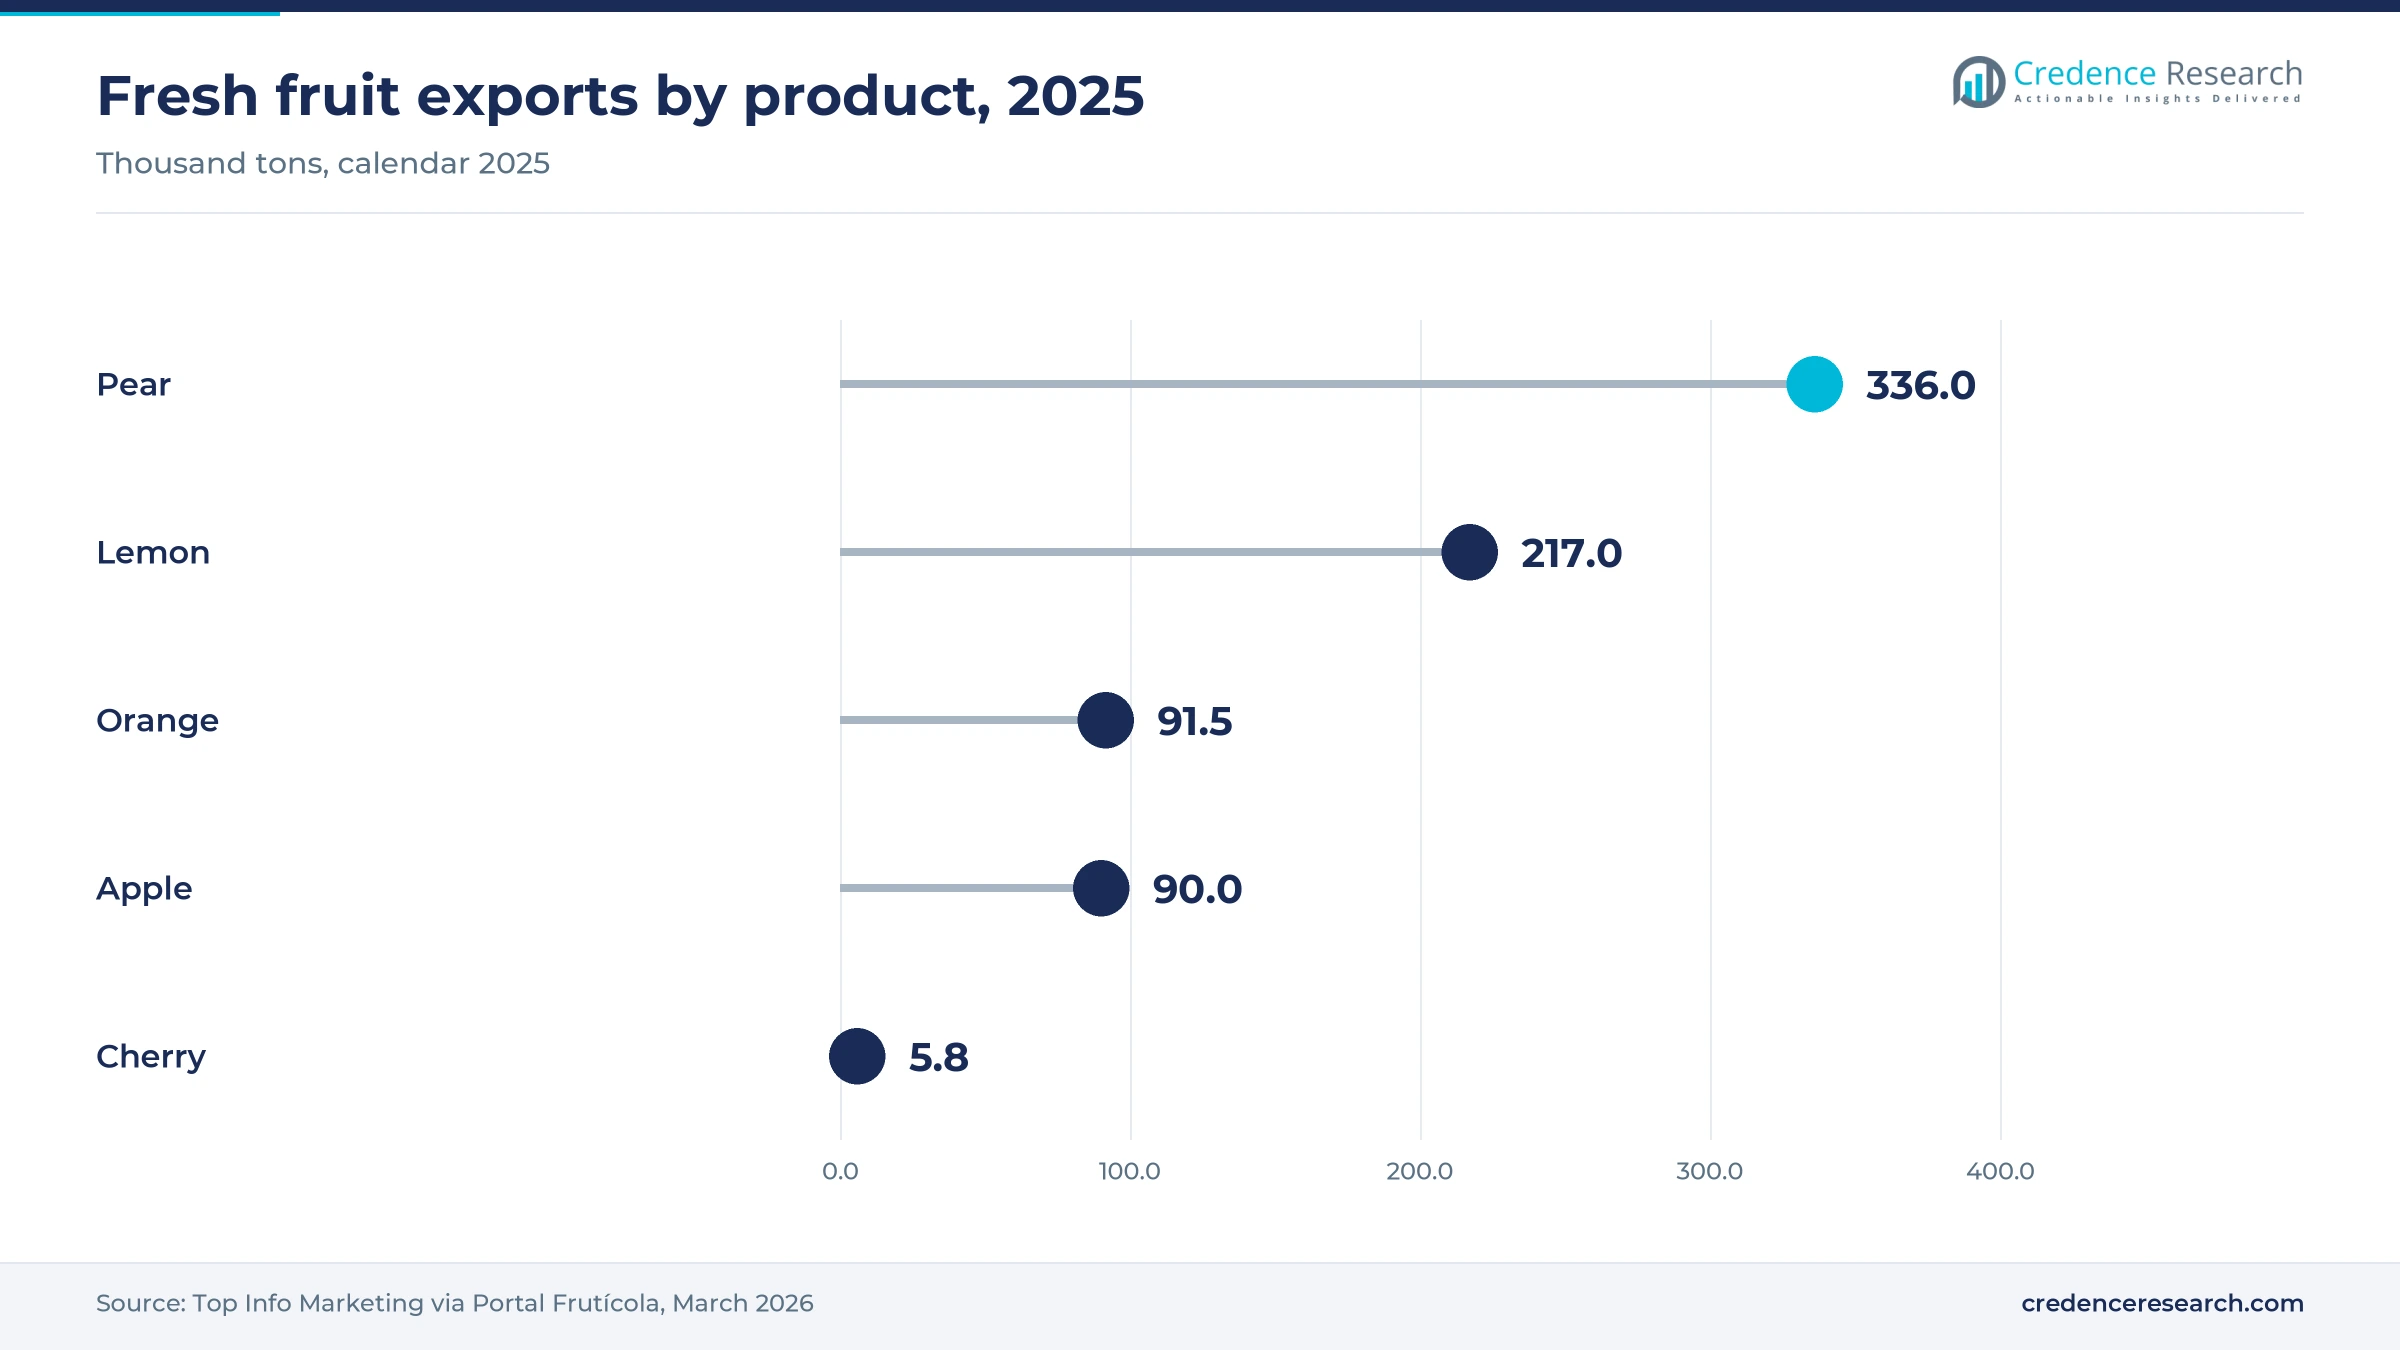
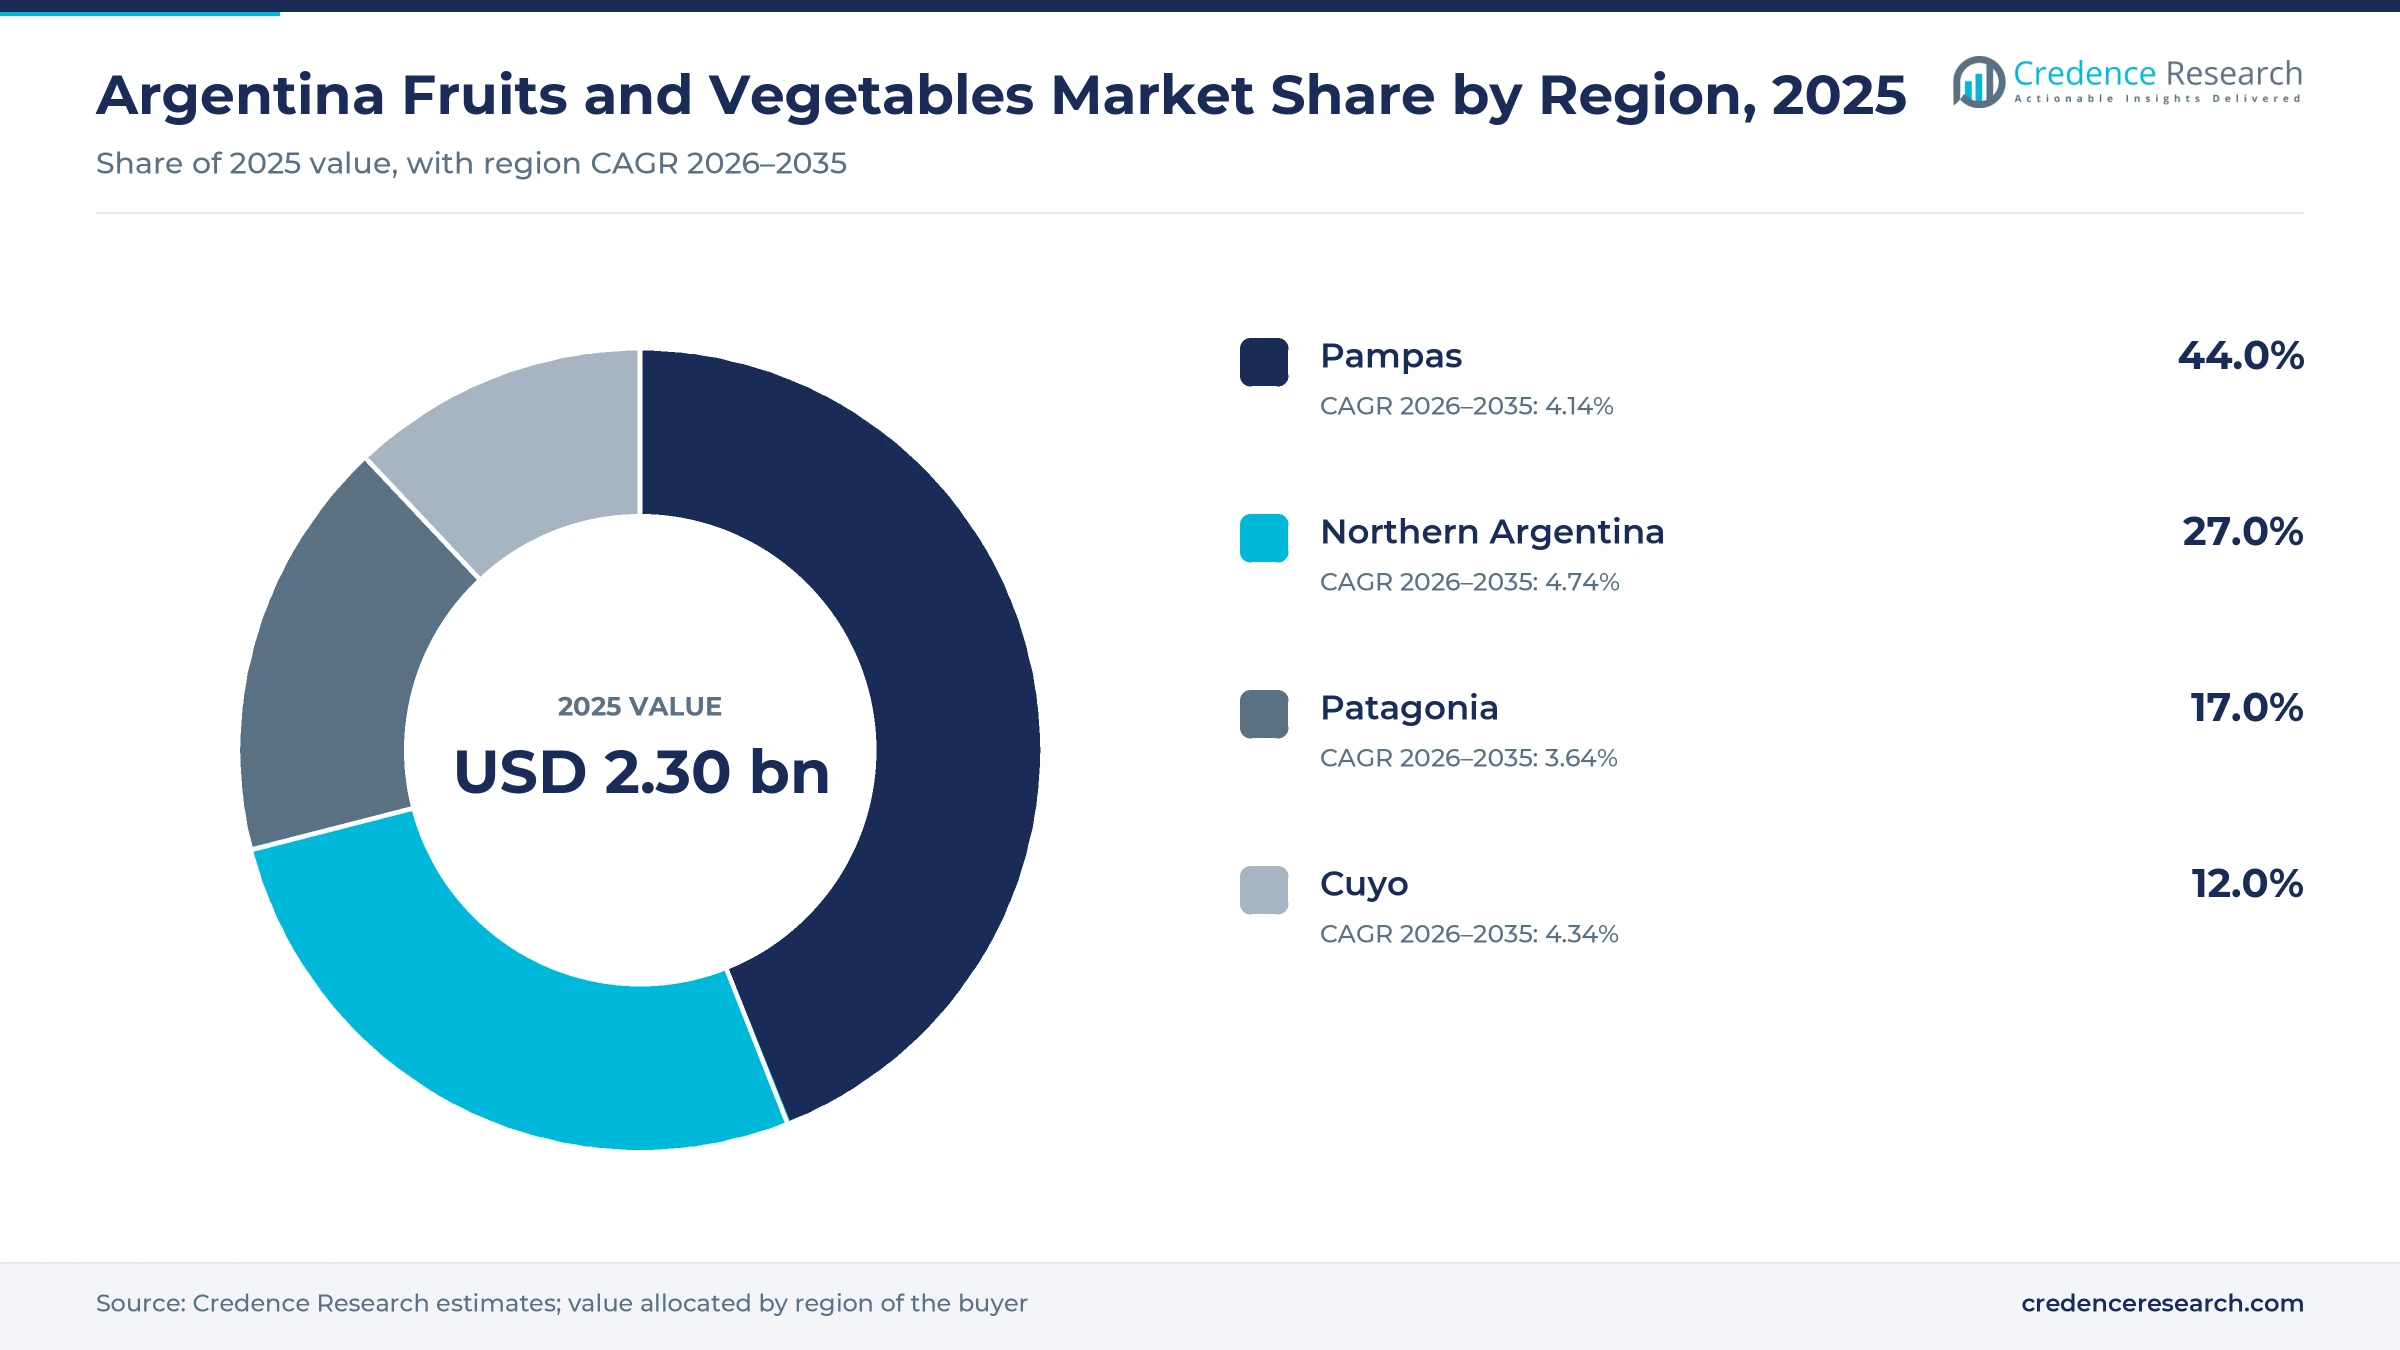
The Argentina fruits and vegetables market was valued at USD 2.30 billion in 2025 and is projected to increase from USD 2.41 billion in 2026 to USD 3.51 billion by 2035, registering a CAGR of 4.25% during 2026–2035. Household staples such as potato, tomato and onion anchor domestic demand, while pears and lemons give the market its export earnings. Pampas held the largest regional share, 44.0% in 2025, because the Buenos Aires green belts and Mercado Central supply the country's largest consumer base. Northern Argentina is the fastest-growing region at 4.74% a year, supported by Tucumán lemon volumes and new sanitary access to Panama. Fresh fruit exports reached 770,000 tons in 2025, according to Portal Frutícola. Resolution 21/2025 also removed harvest authorization and regulated packing rules, which gives packers more room to shape their export programs. The EU and Mercosur interim trade agreement, applied from May 1, 2026, adds a further commercial change for lemons, pears and garlic.
What does Argentina's fresh produce market include, and how is it bought?
The market counts the first-sale value of fresh fruits, fresh vegetables and fresh-cut produce sold by growers, packers and importers to domestic and export buyers. Most domestic volume moves through wholesale markets to greengrocers and supermarkets, while export fruit moves through integrated packers with phytosanitary certificates and buyer specifications.
The estimate excludes juices, canned goods, frozen and dried products, pulses and industrial lemon derivatives such as essential oils and dehydrated peel. Those exclusions matter because USDA FAS reports that 70% to 75% of national lemon output goes to the export processing industry rather than the fresh trade.
Argentina Fruits and Vegetables Market Insights
- The market rises from USD 2.30 billion in 2025 to USD 3.51 billion by 2035, a 4.25% CAGR, as staple buying holds steady and certified export programs add value.
- Pampas held 44.0% of 2025 value because Buenos Aires green belts and Mercado Central supply the largest urban population in the country.
- Fresh fruits led with 52.0% in 2025, helped by 770,000 tons of fresh fruit exports worth USD 604 million that year.
- Resolution 21/2025 removed harvest authorization and annual licensing, while the EU and Mercosur interim agreement began applying on May 1, 2026, changing how exporters plan programs.
- Alto Valle pome fruit area fell from 43,356 hectares in 2010 to 29,482 hectares, which favors integrated packers with netting and their own orchards.
Fruit value and wholesale resale set the market mix
Why do fresh fruits outweigh vegetables in value?
Based on product type, the market is categorized into fresh fruits, fresh vegetables and fresh-cut produce. Fresh fruits led with 52.0% of 2025 value because fruit carries the export premium, with 770,000 tons shipped for USD 604 million in 2025, according to Portal Frutícola. Vegetables remain the larger household staple by weight, and potato alone weighs 38.0% in the CEPA Mercado Central vegetable basket. Fresh-cut produce grows fastest at 7.19% a year as Sueño Verde delivers washed, ready-to-eat vegetables within 24 to 48 hours of harvest to much of the country.
How large is certified organic supply within fresh produce?
Based on farming approach, the market is categorized into conventional production, certified organic production and organic conversion production. Conventional production led with 95.5% of 2025 value because SENASA counted only 9,131 hectares of harvested organic fruit in 2025, a small base beside national orchards. Certified organic production grows fastest at 6.02% a year as organic apple exports rose 40% to about 6,648 tons and organic blueberry exports rose 36%, according to SENASA's 2025 organic statistics. Conversion volume is a Credence Research estimate, because that report does not publish transition area separately.
Which buyers purchase most of the country's fresh produce?
Based on customer type, the market is categorized into resale buyers, food-service buyers and direct household buyers. Resale buyers led with 78.0% of 2025 value because greengrocers take 51.5% of vegetable volume, supermarkets 23.1% and self-service stores 20.3%, according to channel weights in CEPA's January 2026 observatory. Direct household buyers grows fastest at 5.71% a year as community bag schemes widen, with the UTT growers' union selling about 8,000 vegetable bags a week through about 300 delivery nodes, according to BAE Negocios in June 2024. Food-service buying is smaller, and Sueño Verde reports that hotel and restaurant growth slowed in 2024.
Why does wholesale still move the largest share of value?
Based on distribution channel, the market is categorized into wholesale-market distribution, direct domestic distribution and export distribution. Wholesale-market distribution led with 47.0% of 2025 value because Mercado Central de Buenos Aires alone handles about 1.4 million tons a year, which it put at about one-fifth of national consumption in figures reported by La Capital in July 2020. Export distribution grows fastest at 4.78% a year as the EU and Mercosur interim agreement began applying on May 1, 2026, and Panama cleared Argentine lemons, oranges and grapefruits in August 2026, according to FreshPlaza.
| Segment Group | Leading Sub-segment | Share, 2025 | Fastest-growing Sub-segment | CAGR, 2026–2035 |
|---|---|---|---|---|
| By Product Type | Fresh fruits | 52.0% | Fresh-cut produce | 7.19% |
| By Farming Approach | Conventional production | 95.5% | Certified organic production | 6.02% |
| By Customer Type | Resale buyers | 78.0% | Direct household buyers | 5.71% |
| By Distribution Channel | Wholesale-market distribution | 47.0% | Export distribution | 4.78% |
Request a Free Sample
Fill in your details and we'll send you a free sample report.
- Sample data tables & charts
- Research methodology
Staple buying and certified exports carry demand
Why does staple replenishment keep demand steady?
Reliable staple replenishment gives the market its floor, because households buy potato, tomato and onion every week regardless of the economic cycle. CEPA's Mercado Central basket shows the concentration clearly, with potato at 38.0% of vegetable volume and tomato and onion at 13.0% each. Fruit demand follows the same pattern, as orange takes 18.0%, banana 16.0% and apple 13.0% of the fruit basket. As a result, wholesale prices are watched closely, and Mercado Central's December 2025 federal monitor showed tomato at about ARS 570 per kilogram, up 10.61% from a year earlier. Potato reached about ARS 571 per kilogram in the same report, up 23.48%, so staple value held firm into the end of 2025.
How do certified premium export programs lift value?
Overseas buyers pay more for documented quality, residue control and organic status, so certified programs raise value per ton. SENASA reports that certified organic exports across all products reached 167,600 tons in 2025, up 31% from 2024. Organic pears contributed about 18,182 tons, even after a decline from 2024, while organic lemons added about 2,890 tons. Fruit growers in Tucumán, Río Negro and Neuquén supply most of this certified fruit, and those provinces also host the largest conventional export packers. In turn, the wider fresh trade benefits, as overall fresh fruit export value rose 13% in 2025 against a 7% rise in volume, according to Portal Frutícola. Better returns then support Certified organic production, the fastest route within farming approach.
What do more flexible trade payments change for exporters?
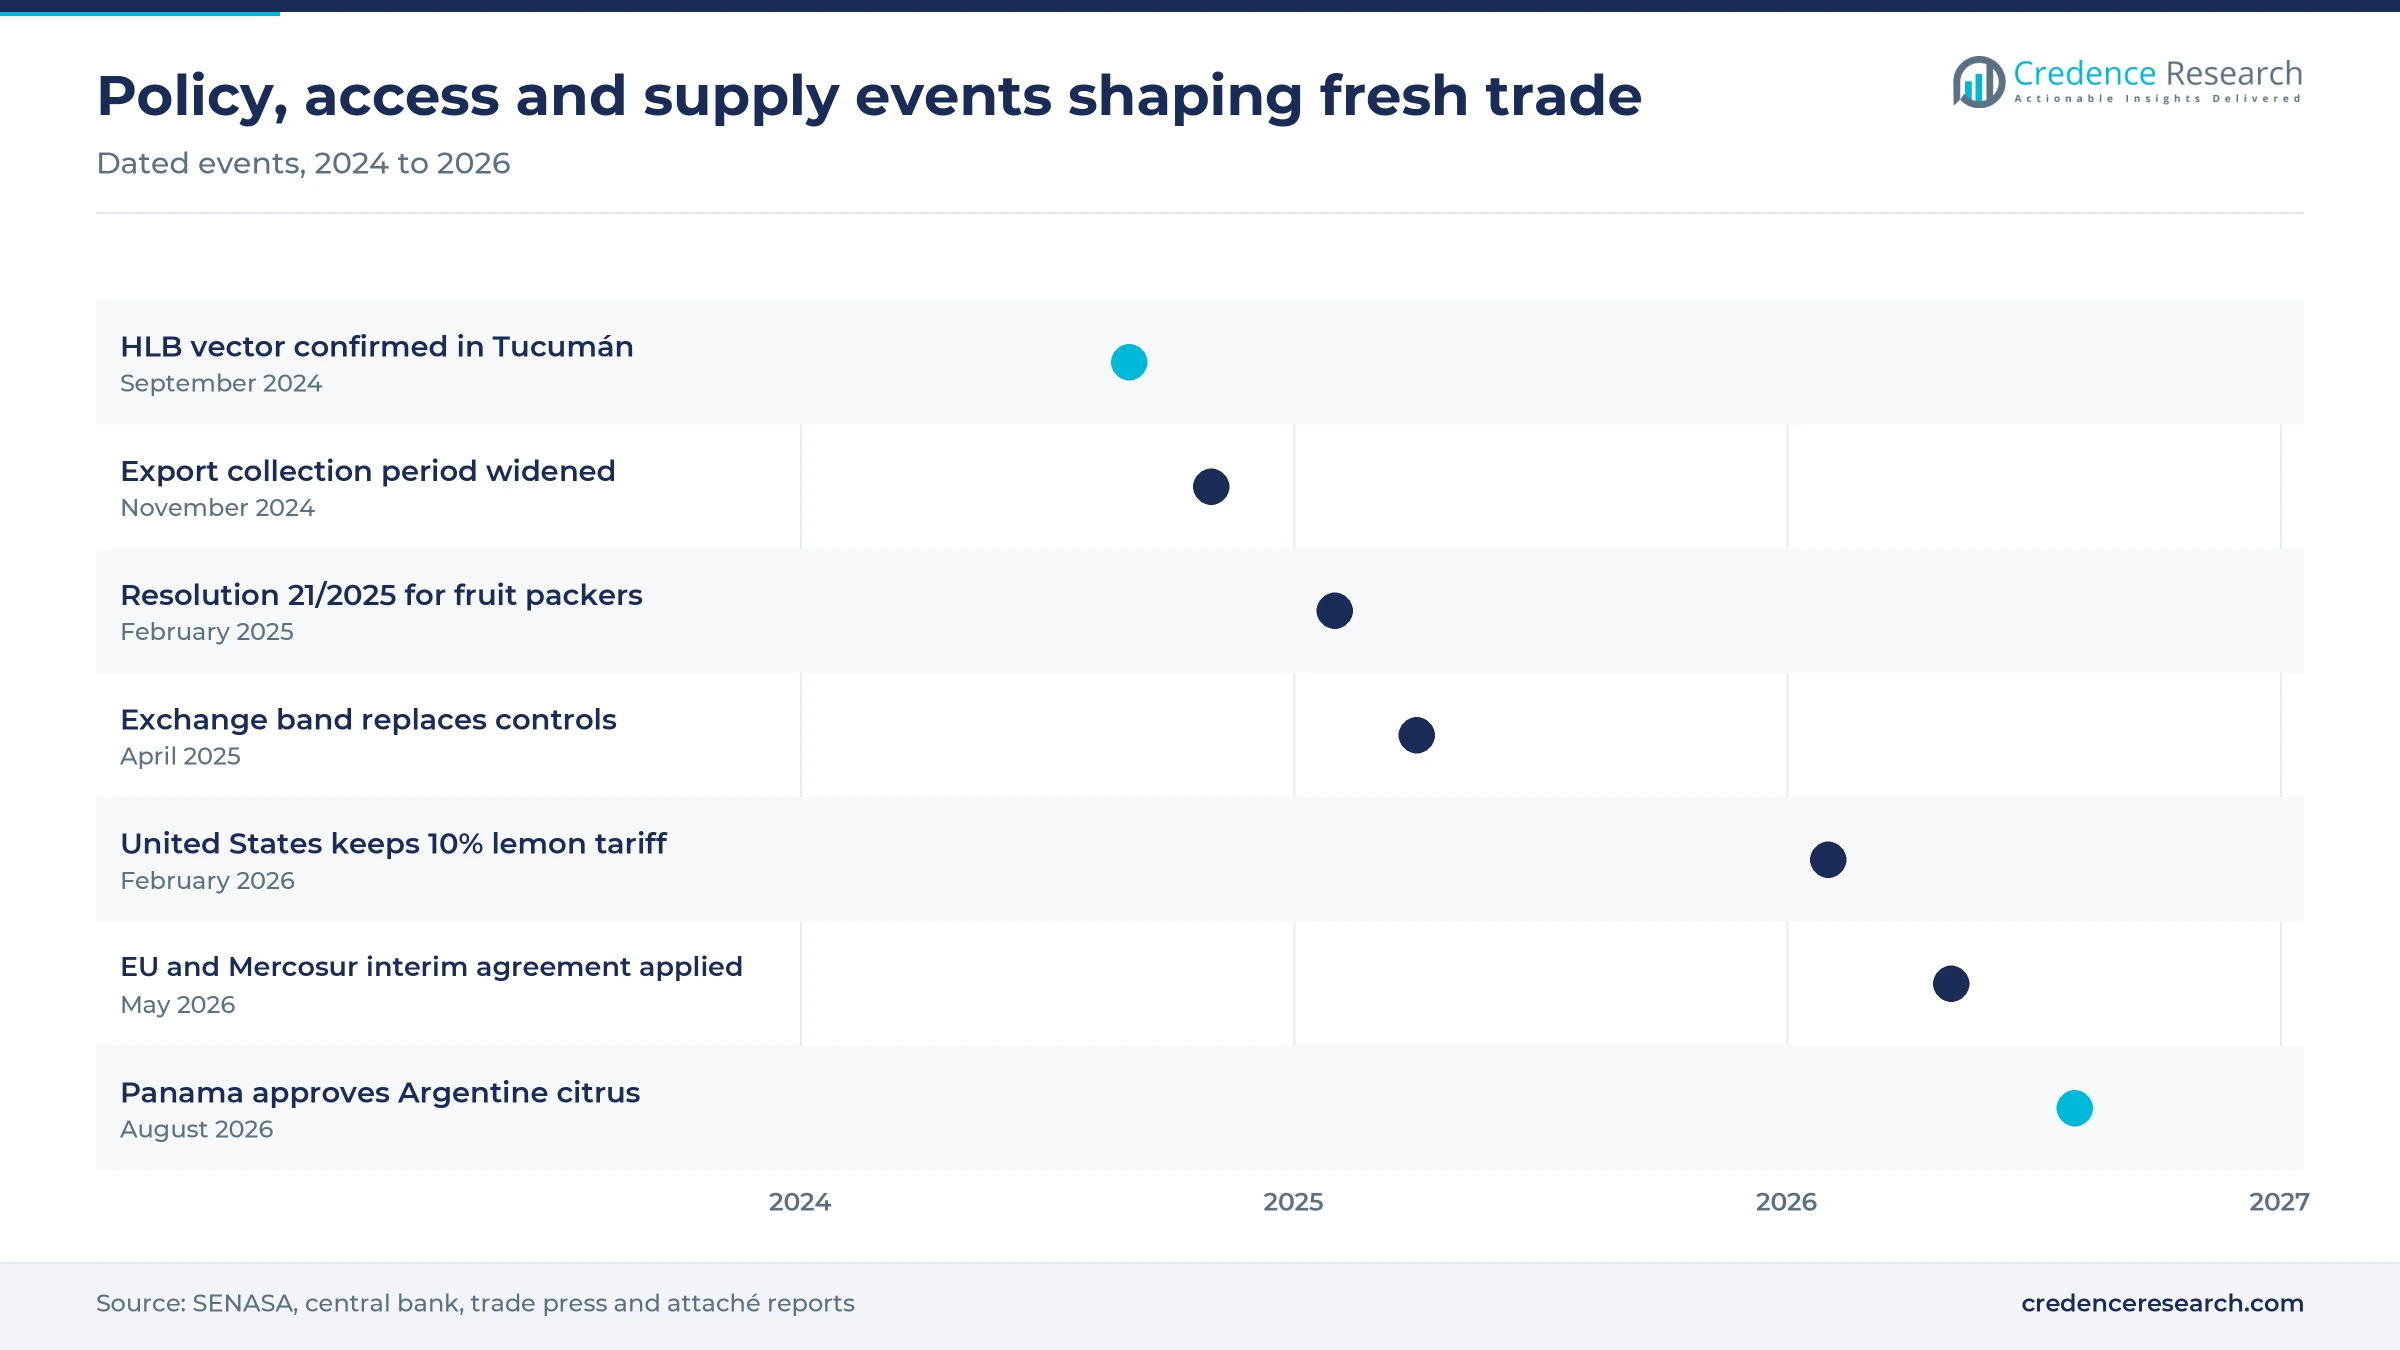
Exporters now have longer windows and more freedom over foreign currency, which makes fruit programs easier to finance. The central bank's Communication A 8137 of Nov. 29, 2024, raised the period for bringing in export collections from 5 to 20 business days, according to El Heraldo. Exchange controls for individuals then ended under the April 11, 2025, band regime, which set a range of 1,000 to 1,400 pesos per dollar, according to MercoPress. Communication A 8296, in force from Aug. 8, 2025, also allows exporters with new prefinancing to hold proceeds up to 125% of near-term debt service, according to the law firm Marval O'Farrell Mairal. Importers of basic-basket goods were already paying at 30 days by July 2024, according to Bloomberg Línea.
How has deregulation changed fruit packing decisions?
Deregulation lowers the compliance burden on packers, and it allows commercial decisions on timing and presentation to return to growers. Brazil's agriculture attaché in Buenos Aires reported in a March 17, 2025, note on Resolution 21/2025 that harvest authorization was removed, so producers can now choose when to pick. The same note says packaging rules are set by producers, annual licensing of establishments ended, and the former limit on exporting only premium fruit was lifted. Exporters must still hold a phytosanitary certificate and meet destination rules, according to Portal Frutícola in February 2025. In turn, packers can direct more grades to price-sensitive markets, including Brazil, which took about 40% of pears from January to October 2025, according to SENASA data cited by FreshPlaza.
Imports and ready-to-eat lines are reshaping supply
Why is the shift toward imported fruit gaining ground?
Imported fruit is moving from an occasional gap filler to a regular part of the wholesale offer, which changes pricing power for local growers. SENASA data cited by Fresh Fruit Portal show apple imports above 1,710 tons in the first four months of 2026, up 210% from a year earlier and more than 350% above the 2021 to 2025 average. Chile is the main origin, while operator and analyst Mariano Winograd told Colonia Agropecuaria in January 2025 that most of these imports are structural rather than seasonal. A report cited by Bichos de Campo in February 2026 also said the value of imported fruit matched exported fruit in 2025. Battaglio Argentina has ripened imported bananas from a Buenos Aires warehouse since 2017, according to Fruitnet.
What is behind the rise of ready-to-eat vegetables?
Ready-to-eat vegetables are emerging as the clearest value-added line, because they cut preparation time for retailers and kitchens. Sueño Verde told FreshPlaza in September 2025 that demand for washed and cooked ranges is increasing rapidly, and it aims to double in size within three to five years. The company delivers within 24 to 48 hours of harvest, and it has cut plastic use by 60% over two years with compostable salad trays. INTA also offers small firms and growers a ready-to-eat preservation protocol at technology readiness level 6, with hotels, restaurants and catering as named targets. These fresh lines also compete with quick-frozen packs in food-service kitchens, which supports Fresh-cut produce at 7.19% a year.
Where does EU market access open a new opportunity?
The EU and Mercosur interim agreement opens a tariff opportunity for exporters already selling to European buyers, and it began applying on May 1, 2026, according to WiseTech Academy. The EU will remove duties on about 92% of Mercosur imports over periods of up to 10 years, so citrus and pear programs can plan for gradual savings. Preliminary Eurostat data cited by HortiDaily show the EU imported EUR 406.8 million of fruit and vegetables from Argentina in 2025, including EUR 99.2 million of lemons and limes and EUR 45.6 million of pears. Garlic added nearly all of a EUR 28.0 million EU import line. As a result, Export distribution is the fastest channel at 4.78% a year.
How can direct household sales capture retail margins?
Direct household sales offer growers an opening to capture part of a wide retail margin, particularly in vegetables. CEPA's May 2026 observatory put the gap between Mercado Central and supermarket vegetable prices at 87.3%, with lettuce at 238.3% and tomato at 142.5%. The UTT growers' union already reaches consumers at scale, with 22 stores in eight provinces, about 300 delivery nodes and about 8,000 weekly bags, according to BAE Negocios in June 2024. Each node serves at least 10 families and pays no shipping cost, which keeps the logistics simple for organizers. Sumak and other Buenos Aires cooperatives also sold fixed-price bags at that time. This route supports Direct household buyers, the fastest customer group at 5.71% a year.
Hail, orchard loss and HLB pressure growers
How much does hail cost the Alto Valle?
Hail is cutting the volume and grade of export fruit in the Alto Valle. Nicolás Sánchez of the CAFI growers' chamber told Fresh Fruit Portal in May 2026 that apple output could fall 20% to 30%, with more than 6,500 hectares affected and export quality losses of up to 50% in some areas. Patagonian Fruits expected a 15% to 20% decline in pears in February 2026. Growers without netting carry the largest losses, while integrated packers can spread risk across several orchards and varieties.
Why is orchard area in Patagonia shrinking?
Orchard exit is reducing the Patagonian fruit base even as yields improve. SENASA yearbooks cited by Diario Río Negro in January 2025 show pome fruit area falling from 43,356 hectares in 2010 to 29,482 hectares, while Alto Valle producers fell from 2,773 to 1,327. Former orchards now grow maize and other grain, with nearly 7,000 hectares planted in one recent season. As a result, smaller packers lose fruit supply, and renewal depends on productivity near the 45,000 kilograms per hectare cited by the provincial minister.
What does HLB mean for northern citrus?
HLB is the most serious biological threat to northern citrus because the disease has no known cure. SENASA confirmed the vector insect on a farm in Caspinchango, Tucumán, as reported by FreshPlaza on Sept. 3, 2024, although the province remained free of the disease itself. An INTA Famaillá study also found Tucumán citrus area fell 7.52% in the 2024 season. Growers therefore face higher monitoring costs, and exporters face tighter inspections, so regional coordination through ACNOA remains essential for protecting lemon supply over the decade.
How do United States tariffs limit lemon returns?
United States tariffs limit returns from a market that has become vital for fresh lemons. According to FreshPlaza, citing Federcitrus, Argentina shipped 49,242 tons of citrus to the United States in 2025, nearly all of it lemons. However, FreshPlaza reported in February 2026 that the Framework for a Reciprocal Trade and Investment Agreement kept a 10% tariff and gave no new citrus access. California Citrus Mutual is also lobbying over imports, so exporters are spreading risk toward Europe and new destinations such as Panama.
Pampas feeds the cities while the north exports lemons
| Region | Value, 2025 (USD billion) | Share, 2025 | CAGR, 2026–2035 |
|---|---|---|---|
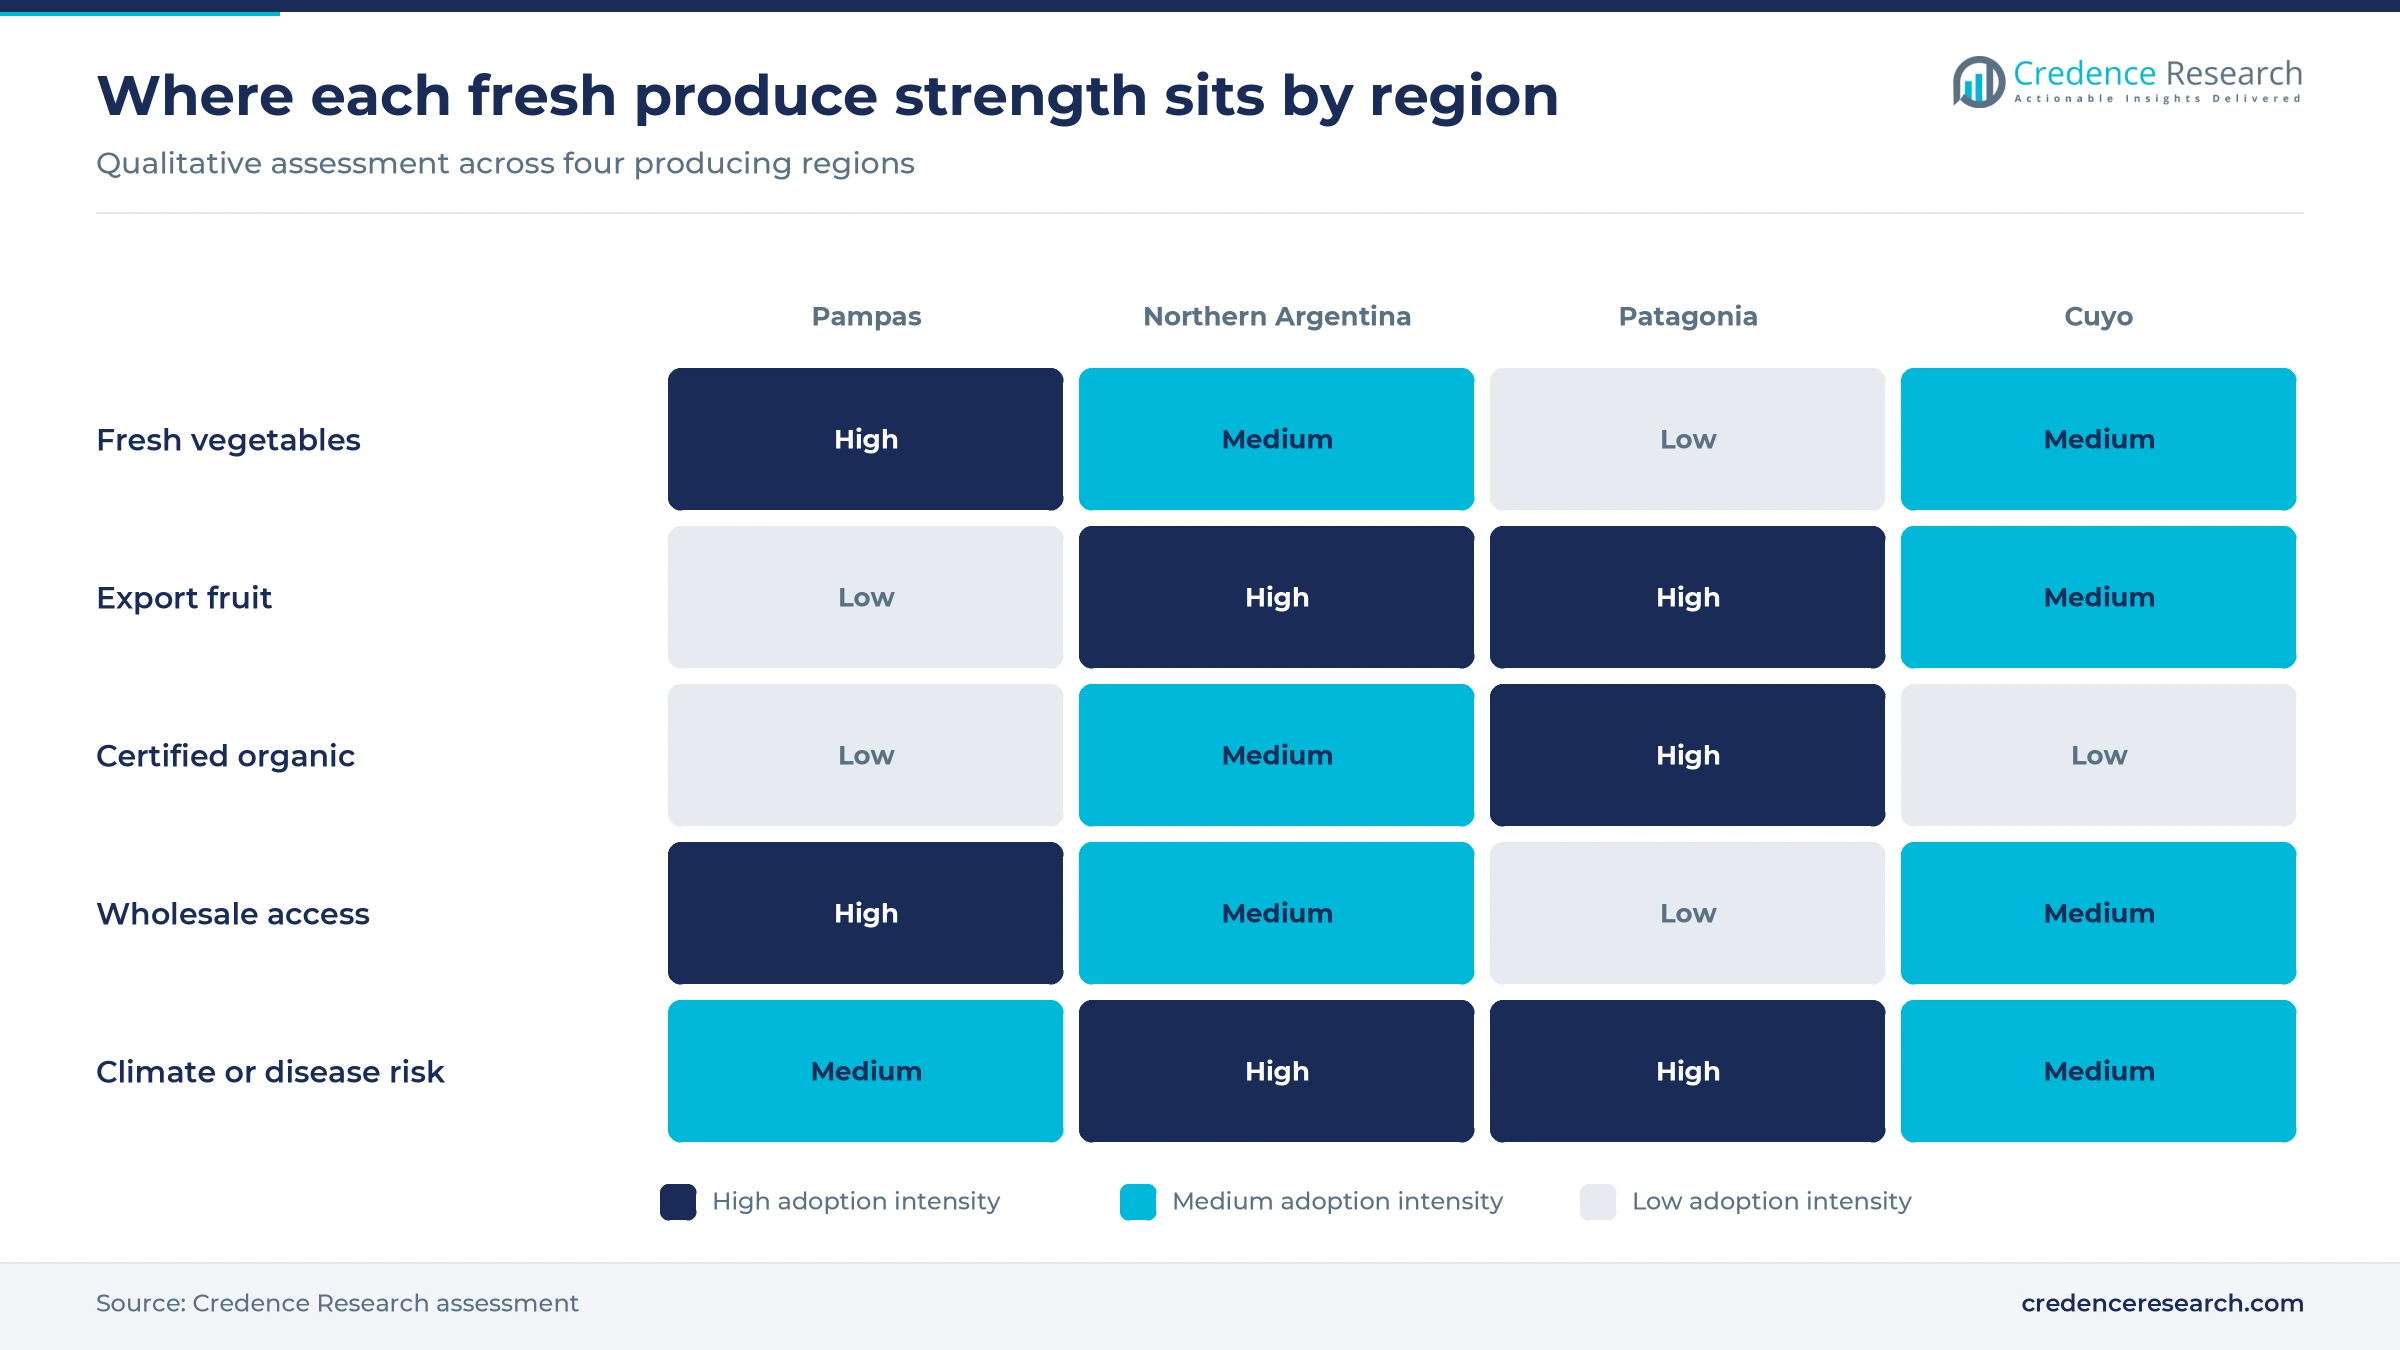
| Pampas | 1.01 | 44.0% | 4.14% |
| Northern Argentina | 0.62 | 27.0% | 4.74% |
| Patagonia | 0.39 | 17.0% | 3.64% |
| Cuyo | 0.28 | 12.0% | 4.34% |
Pampas feeds the largest urban buyers
Pampas held 44.0% of 2025 value and grows at 4.14% a year, because vegetable belts sit close to the largest cities. A survey by the National University of La Plata, reported by Bichos de Campo in January 2026, counted 2,285 establishments on about 4,008 cultivated hectares producing about 95,000 tons, with tomato at 35% of output. Greenhouses cover more than 1,700 hectares in that belt alone. The Agriculture Secretariat also reported in September 2023 that Buenos Aires supplies 88% of the lettuce entering Mercado Central.
Northern Argentina builds growth on lemons
Northern Argentina held 27.0% of 2025 value and is the fastest region at 4.74% a year, because lemon volumes recovered strongly. Federcitrus reports a lemon harvest of 2.21 million tons in 2025, up 29%, and fresh lemon exports of 216,919 tons. Lemons and derivatives made up 54% of Tucumán exports in 2025, according to the provincial IDEP. Panama cleared Argentine citrus in August 2026, which adds another destination. However, the fresh figure is a small part of output, because most lemons go to processing.
Patagonia relies on pears and netted orchards
Patagonia held 17.0% of 2025 value and grows at 3.64% a year, the slowest pace, because orchard area continues to contract. Pear exports still reached 325,500 tons from January to October 2025, the highest in a decade, according to SENASA data cited by FreshPlaza. Apple exports rose 21% to 81,600 tons in that period. Export programs in Río Negro and Neuquén also depend on cold storage and refrigerated transport to hold fruit between harvest and overseas sailing dates.
Cuyo adds garlic, onions and stone fruit
Cuyo held 12.0% of 2025 value and grows at 4.34% a year, with Mendoza garlic as its main fresh export line. Mendoza's Rural Development Institute counted 13,841 hectares of garlic in January 2024, up 4%, with 56% in the Uco Valley. ProMendoza data show garlic exports worth USD 97.8 million from January to November 2024, up 64%, although Los Andes reported a 4% fall in 2025. Much of the region's peach and tomato output goes instead to canning and juice plants, which sit outside this estimate.
Rule, currency and market access changes since 2024
| Development | Status and market relevance |
|---|---|
| In January 2025, the Agriculture Secretariat issued Resolution 21/2025, removing harvest authorization and annual licensing, according to Brazil's attaché in Buenos Aires. | In force; shifts harvest and packing decisions to growers |
| In April 2025, the government and central bank replaced exchange controls for individuals with a peso band of 1,000 to 1,400 per dollar. | In force; changes export settlement and pricing |
| In February 2026, the United States and Argentina reached a reciprocal trade framework that kept a 10% tariff on Argentine lemons. | Agreed; no new citrus access |
| In May 2026, the EU and Mercosur interim trade agreement began provisional application, with up to 10 years of EU duty phase-outs. | Applied; ratification debate continues |
| In August 2026, Panama approved imports of Argentine lemons, oranges and grapefruits, as confirmed by Tucumán's IDEP. | New destination for northern citrus |
Nets, greenhouses and traceability protect fruit value
- Anti-hail netting protects export grades in the Alto Valle, and Kleppe set aside about USD 3 million for nets within a USD 6 million plan announced in October 2021, according to El Cronista.
- Protected cropping stabilizes vegetable supply near Buenos Aires, with La Plata greenhouses covering 43% of its cultivated fruit and vegetable area, according to the university survey cited by Bichos de Campo.
- Ready-to-eat preservation extends the sales window for cut vegetables, and INTA offers shelf-life studies and pilot-scale evaluation to small firms and growers seeking added value.
- Traceability systems support overseas certification, because Resolution 21/2025 keeps traceability and hygiene duties at packing sheds even after harvest and packaging rules were relaxed.
Need a Custom Version of This Report?
Tailor the scope, geography, or segments to your exact requirements.
- Custom geography or segment scope
- Direct access to our analyst team
Integrated packers lead citrus and Alto Valle pears
Competition turns on orchard control, packing quality and access to overseas programs. A Foreign Ministry list of Argentine exhibitors at Fruit Logistica in February 2026 shows Citromax, FGF Trapani and Frutucumán in Tucumán citrus, while Tres Ases, Emelka and Grupo Prima, listed with Patagonian Fruits, represent Río Negro pears and apples. Ledesma brings a different profile, with oranges, grapefruits and lemons, and it led fresh citrus exports in 2021 with 35,634 tons, according to Todo Jujuy. Kleppe competes through integration, with five packing plants and 45 farms, according to El Cronista in October 2021. Battaglio Argentina combines Río Negro topfruit exports with imported bananas for domestic buyers, according to Fruitnet. Domestic vegetables remain fragmented, because La Plata alone counts 2,285 establishments. Regional contract logistics providers therefore matter for mid-sized packers without their own trucks.
Companies profiled and their roles in this market
| Company | Type | Role in the market |
|---|---|---|
| Citromax | Citrus exporter | Tucumán lemons, oranges, grapefruits and blueberries, per the Fruit Logistica 2026 list |
| FGF Trapani | Citrus exporter | Tucumán lemons, oranges, tangerines and grapefruits |
| Ledesma | Integrated agribusiness | Oranges, grapefruits, lemons, avocados and grapes; 2021 fresh citrus export leader |
| Patagonian Fruits | Pome fruit exporter | Río Negro pears for Brazil, the United States and Europe |
| Kleppe | Integrated grower and packer | Río Negro pears, apples and cherries, with anti-hail investment |
| Battaglio Argentina | Exporter and importer | Villa Regina topfruit exports and Buenos Aires banana ripening |
| Frutucumán | Citrus exporter | Tucumán lemons, blueberries and oranges |
| Tres Ases | Pome and stone fruit exporter | Río Negro apples, pears and plums |
| Emelka | Fruit exporter | Río Negro cherries, pears and apples |
Quality fruit should outperform bulk supply
Credence Research's view is that quality fruit will outperform bulk supply through 2035. Export demand for fresh fruit showed this in 2025, with value up 13% against a 7% rise in volume. Coninagro data reported in November 2025 showed the price paid to growers rising only 2% from a year earlier, so volume alone does not secure margin. Packers with netting, certification and several destinations are better placed than growers selling ungraded fruit into one wholesale market. Domestic staples should grow near population and income, while the larger upside sits in lemons, certified pears and fresh-cut lines. The main risk is an HLB outbreak in Tucumán, which would change the northern outlook quickly.
How Credence Research built these estimates
The report uses 2025 as the base year and 2035 as the forecast year. Market values come from the Credence Research model and represent first-sale value in current U.S. dollars. Segment and regional splits are Credence Research estimates informed by public production, wholesale price and export data. Sources used include SENASA, the Agriculture Secretariat, INTA, Mercado Central, provincial agencies, Eurostat data as cited by trade press, law firm notes, company statements and trade or general press reports opened during research. No interviews or surveys were conducted for this edition of the report.
Export access and orchard renewal shape the path to 2035
Growth in the Argentina fruits and vegetables trade to USD 3.51 billion by 2035 depends more on fruit quality and market access than on national volume. EU duty phase-outs should reward lemon and pear programs gradually, while Panama and other new destinations reduce dependence on the United States and Brazil. Domestic staples should remain steady, although imports will keep testing local growers whenever the peso strengthens. Patagonia needs netted orchard renewal to stop further area losses, and the north needs firm HLB control. Fresh-cut and direct household sales will stay small, yet they offer the clearest routes to better margins for vegetable growers near large cities.
Frequently Asked Questions
How big is the Argentina fruits and vegetables market?
Which product type leads the market?
Which region holds the largest share?
What is driving demand for fresh produce in Argentina?
How large is certified organic fruit production?
What are the main challenges for growers?
Which companies are active in this market?
How does the EU and Mercosur agreement affect exporters?
Table of Content
Chapter 1 Market Segmentation
- 1.1 Segmentation Framework
- 1.1.1 Product and Service Classification
- 1.1.2 Application and End-Use Classification
- 1.1.3 Technology and Solution Classification
- 1.1.4 Customer and Distribution Channel Classification
- 1.1.5 Geographic Segmentation
- 1.1.6 Market Segment Definitions and Boundaries
- 1.2 By Product Type
- 1.2.1 Fresh fruits
- 1.2.2 Fresh vegetables
- 1.2.3 Fresh-cut produce
- 1.3 By Farming Approach
- 1.3.1 Conventional production
- 1.3.2 Certified organic production
- 1.3.3 Organic conversion production
- 1.4 By Customer Type
- 1.4.1 Resale buyers
- 1.4.2 Food-service buyers
- 1.4.3 Direct household buyers
Chapter 2 Introduction
- 2.1 Report Objectives and Scope
- 2.2 Product Definition and Industry Terminology
- 2.3 Market Inclusions and Exclusions
- 2.4 Research Process
- 2.4.1 Primary Research and Expert Interviews
- 2.4.2 Secondary Research and Source Review
- 2.4.3 Top-Down and Bottom-Up Estimation
- 2.4.4 Data Triangulation and Verification
- 2.5 Market Size Measurement Basis
- 2.5.1 2025: USD 2.30 billion → 2035: USD 3.51 billion
- 2.6 Historical and Forecast Reference Periods
- 2.6.1 Historical Period: 2018-2025
- 2.6.2 Base Year: 2025
- 2.6.3 Forecast Period: 2025-2035
- 2.7 Research Assumptions and Limitations
Chapter 3 Executive Summary
- 3.1 Market Snapshot and Key Findings
- 3.2 Base-Year Market Size, 2025
- 3.3 Forecast Market Size, 2035
- 3.4 Revenue and Volume Growth Outlook
- 3.5 Key Demand and Supply Indicators
- 3.6 Leading Market Segments
- 3.7 Fastest-Growing Market Opportunities
- 3.8 Regional Performance Highlights
- 3.9 Technology and Industry Transformation
- 3.10 Competitive Landscape Summary
- 3.11 Analyst View and Strategic Implications
Chapter 4 Argentina Fruits and Vegetables Market Trends and Developments
- 4.1 Historical Industry Development, 2018-2025
- 4.2 Recent Market Trends and Developments
- 4.3 Demand and Customer Behavior Trends
- 4.4 Technology and Product Innovation
- 4.5 Artificial Intelligence, Automation and Digitalization
- 4.6 Local Manufacturing and Supply Chain Realignment
- 4.7 Industry Partnerships, Mergers and Acquisitions
- 4.8 Sustainability and Circular Economy Developments
- 4.9 Government and Private Sector Investment Trends
- 4.10 Emerging Business Models and Commercialization
- 4.11 Industry Developments and Announcements
Chapter 5 Argentina Fruits and Vegetables Market Production, Supply and Demand Analysis
- 5.1 Demand Trend and Consumption Analysis, 2018-2025
- 5.2 Demand Forecast, 2025-2035
- 5.3 Production and Output Trend, 2018-2025
- 5.4 Production and Output Forecast, 2025-2035
- 5.5 Installed Capacity and Capacity Utilization
- 5.6 Company-Wise Production Plants and Statistics
- 5.6.1 Installed Production Capacity
- 5.6.2 Actual Production
- 5.6.3 Planned Capacity and Expansion Targets
- 5.7 Supply Chain Structure and Procurement Trends
- 5.8 Supply-Demand Gap and Bottlenecks
- 5.9 Import Dependence and Sourcing Structure
- 5.10 Contract Manufacturing and Outsourcing
- 5.11 Regional Supply and Demand Concentration
Chapter 6 Argentina Fruits and Vegetables Market Pricing Analysis
- 6.1 Pricing Structure and Measurement
- 6.2 Historical Pricing Trends, 2018-2025
- 6.3 Pricing Outlook, 2025-2035
- 6.4 Average Selling Price and Unit Economics
- 6.5 Pricing by Product and Market Segment
- 6.6 Geographic Pricing Differences
- 6.7 Key Input, Energy, Labor and Logistics Costs
- 6.8 Contract Pricing and Purchasing Models
- 6.9 Pricing Sensitivity and Competitive Positioning
- 6.10 Price, Margin and Profitability Implications
Chapter 7 Argentina Fruits and Vegetables Market Dynamics
- 7.1 Market Growth Drivers
- 7.1.1 Demand-Side Drivers
- 7.1.2 Technology and Innovation Drivers
- 7.1.3 Infrastructure and Investment Drivers
- 7.1.4 Regulatory and Policy Drivers
- 7.2 Market Restraints
- 7.2.1 Cost and Affordability Constraints
- 7.2.2 Technology and Adoption Barriers
- 7.2.3 Supply Chain and Operational Constraints
- 7.3 Market Challenges
- 7.3.1 Competitive Pressure and Margin Erosion
- 7.3.2 Skills, Infrastructure and Implementation Gaps
- 7.4 Emerging Market Opportunities
- 7.5 Market Dynamics Impact and Time-Horizon Assessment
Chapter 8 Argentina Fruits and Vegetables Value Chain Analysis
- 8.1 Industry Value Chain Overview
- 8.2 Upstream Suppliers and Critical Inputs
- 8.3 Technology and Component Providers
- 8.4 Manufacturing or Service Delivery
- 8.5 Distribution, Channel Partners and Integrators
- 8.6 Downstream Applications and End Users
- 8.7 Value Addition and Profit Pools
- 8.8 Vertical Integration and Outsourcing
- 8.9 Supplier Concentration and Risk
- 8.10 Supply Chain Localization and Resilience
Chapter 9 Argentina Fruits and Vegetables Market Regulations and Policies
- 9.1 Relevant Laws, Standards and Compliance Frameworks
- 9.2 Product, Service, Safety and Quality Requirements
- 9.3 Government Policies, Incentives and Subsidies
- 9.4 Imports, Exports and Trade Barriers
- 9.5 Public Procurement and Local Content Requirements
- 9.6 Environmental and Sustainability Compliance
- 9.7 Upcoming Policy Changes and Market Implications
Chapter 10 Argentina Fruits and Vegetables Market Hotspots and Opportunities
- 10.1 Market Opportunity Mapping and Growth Hotspots
- 10.2 High-Growth Applications and Customer Groups
- 10.3 Underserved Markets and White-Space Opportunities
- 10.4 Emerging Technology and Product Opportunities
- 10.5 New Capacity and Investment Hotspots
- 10.6 Market Entry and Expansion Opportunities
- 10.7 Distribution and Partnership Opportunities
- 10.8 Near-Term and Long-Term Commercial Potential
- 10.9 Opportunity Attractiveness and Execution Risks
Chapter 11 Argentina Fruits and Vegetables Market Outlook, 2025-2035
- 11.1 Market Size and Analysis
- 11.1.1 Revenue (Market Measurement: 2025: USD 2.30 billion → 2035: USD 3.51 billion)
- 11.1.2 Market Volume and Quantity Sold
- 11.1.3 Historical Market Size, 2018-2025
- 11.1.4 Base-Year Market Size, 2025
- 11.2 Market Forecast, 2025-2035
- 11.2.1 Revenue Forecast to 2035
- 11.2.2 Volume Forecast to 2035
- 11.2.3 CAGR and Year-on-Year Growth
- 11.2.4 Incremental Revenue Opportunity
- 11.3 Forecast Assumptions and Scenario Analysis
- 11.3.1 Base-Case Forecast
- 11.3.2 Optimistic and Conservative Scenarios
- 11.3.3 Technology, Pricing and Policy Sensitivities
- 11.4 Market Attractiveness and Growth Outlook
Chapter 12 Argentina Fruits and Vegetables Market Segmentation and Outlook
- 12.1 Segmentation Summary and Market Shares, 2025
- 12.2 Largest and Fastest-Growing Segments
- 12.3 By Product Type - Market Size and Forecast, 2025-2035
- 12.3.1 Segment Definition and Scope
- 12.3.2 Historical Market Size, 2018-2025
- 12.3.3 Revenue Forecast, 2025-2035
- 12.3.4 Volume Forecast, 2025-2035
- 12.3.5 Base-Year Market Share, 2025
- 12.3.6 Segment CAGR and Growth Drivers
- 12.3.7 Subsegment Market Size and Forecast
- 12.3.7.1 Fresh fruits
- 12.3.7.2 Fresh vegetables
- 12.3.7.3 Fresh-cut produce
- 12.3.8 Subsegment Pricing and Adoption Trends
- 12.3.9 Leading Suppliers and Competition
- 12.3.10 Regional Demand and Opportunities
- 12.4 By Farming Approach - Market Size and Forecast, 2025-2035
- 12.4.1 Segment Definition and Scope
- 12.4.2 Historical Market Size, 2018-2025
- 12.4.3 Revenue Forecast, 2025-2035
- 12.4.4 Volume Forecast, 2025-2035
- 12.4.5 Base-Year Market Share, 2025
- 12.4.6 Segment CAGR and Growth Drivers
- 12.4.7 Subsegment Market Size and Forecast
- 12.4.7.1 Conventional production
- 12.4.7.2 Certified organic production
- 12.4.7.3 Organic conversion production
- 12.4.8 Subsegment Pricing and Adoption Trends
- 12.4.9 Leading Suppliers and Competition
- 12.4.10 Regional Demand and Opportunities
- 12.5 By Customer Type - Market Size and Forecast, 2025-2035
- 12.5.1 Segment Definition and Scope
- 12.5.2 Historical Market Size, 2018-2025
- 12.5.3 Revenue Forecast, 2025-2035
- 12.5.4 Volume Forecast, 2025-2035
- 12.5.5 Base-Year Market Share, 2025
- 12.5.6 Segment CAGR and Growth Drivers
- 12.5.7 Subsegment Market Size and Forecast
- 12.5.7.1 Resale buyers
- 12.5.7.2 Food-service buyers
- 12.5.7.3 Direct household buyers
- 12.5.8 Subsegment Pricing and Adoption Trends
- 12.5.9 Leading Suppliers and Competition
- 12.5.10 Regional Demand and Opportunities
- 12.6 Segment Growth Comparison
- 12.7 Segment Attractiveness and Priority Matrix
Chapter 13 Argentina Fruits and Vegetables End-Use and Application Market Outlook
- 13.1 End-Use Industry and Customer Demand Structure
- 13.2 Leading Applications and Customer Groups
- 13.3 End-Use Market Size, Share and Forecast
- 13.4 Major End-Use Industry Deep Dives
- 13.4.1 Customer Requirements and Use Cases
- 13.4.2 Demand and Replacement Cycles
- 13.4.3 Technical and Regulatory Considerations
- 13.4.4 Purchasing and Procurement Models
- 13.4.5 Leading Vendors and Distribution Channels
- 13.4.6 Forecast and Commercial Opportunities
- 13.5 Emerging Applications and Cross-Segment Demand
- 13.6 End-Use Industry Investment Priorities
Chapter 14 Argentina Fruits and Vegetables Geographic Market Outlook, 2025-2035
- 14.1 Domestic Market Distribution and Demand Clusters
- 14.2 State- or Province-Wise Market Size and Forecast, 2025-2035
- 14.3 City and Metropolitan Market Outlook
- 14.4 Industrial, Manufacturing and Commercial Clusters
- 14.5 Geographic Concentration of Key End Users
- 14.6 Local Pricing and Purchasing Differences
- 14.7 Domestic Production Facilities and Capacity Map
- 14.8 Local Infrastructure and Project Pipeline
- 14.9 State-Level Policy and Incentive Differences
- 14.10 Subnational Investment Hotspots and Opportunities
- 14.11 Distribution and Logistics Networks
- 14.12 Domestic Competitive Footprint
Chapter 15 Argentina Fruits and Vegetables Technology, Innovation and Sustainability Outlook
- 15.1 Technology Landscape and Maturity
- 15.2 Product, Process and Service Innovation
- 15.3 AI, Automation and Digital Tools in the Industry
- 15.4 Technology Adoption and Performance Benchmarking
- 15.5 Innovation Pipeline and R&D Investment
- 15.6 Patent and Intellectual Property Trends
- 15.7 Energy Efficiency and Resource Management
- 15.8 Sustainability, Recycling and Circularity
- 15.9 Technology Roadmap, 2025-2035
- 15.10 Risks of Obsolescence and Technology Substitution
Chapter 16 Argentina Fruits and Vegetables Market Key Strategic Imperatives
- 16.1 Growth and Market Entry Priorities
- 16.2 High-Return Products and Segments
- 16.3 Pricing, Profitability and Cost Optimization
- 16.4 Technology Investment and Product Differentiation
- 16.5 Supply Chain Localization and Resilience
- 16.6 Distribution and Customer Acquisition
- 16.7 Partnership, Acquisition and Capacity Strategy
- 16.8 Regional Expansion Priorities
- 16.9 Short-, Medium- and Long-Term Actions
Chapter 17 Competition Outlook
- 17.1 Industry Competition Characteristics
- 17.2 Market Structure and Concentration
- 17.3 Market Share and Competitive Positioning, 2025
- 17.4 Company-Wise Revenue and Product Benchmarking
- 17.5 Production and Service Capacity Benchmarking
- 17.6 Technology, Pricing and Differentiation
- 17.7 Regional Footprint and Distribution Strength
- 17.8 Mergers, Acquisitions and Strategic Alliances
- 17.9 New Entrants and Competitive Threats
- 17.10 Porter's Five Forces and Industry Attractiveness
- 17.11 Competitive Outlook, 2025-2035
Chapter 18 Company Profiles
- 18.1 Company Coverage and Selection Criteria
- 18.2 Citromax
- 18.2.1 Business Description
- 18.2.2 Company Ownership and Geographic Presence
- 18.2.3 Product and Service Portfolio
- 18.2.4 Manufacturing and Operating Footprint
- 18.2.5 Production Capacity and Expansion Plans
- 18.2.6 Financial Performance and Investment
- 18.2.7 Market Share and Competitive Position
- 18.2.8 Technology and Innovation Capabilities
- 18.2.9 Strategic Alliances or Partnerships
- 18.2.10 Recent Developments
- 18.2.11 Growth Strategy and Outlook
- 18.3 FGF Trapani
- 18.4 Ledesma
- 18.5 Patagonian Fruits
- 18.6 Kleppe
- 18.7 Battaglio Argentina
- 18.8 Frutucumán
- 18.9 Tres Ases
- 18.10 Emelka
- 18.11 Argenti Lemon
- 18.12 Other Relevant Market Participants
Note: Every listed company is profiled on the structure shown under the first company. The company list is preliminary and may change based on research findings, market developments, data availability and client requirements.
Chapter 19 Disclaimer
- 19.1 Research and Forecast Disclaimer
- 19.2 Data Source and Estimation Limitations
Note: The depth of individual sections depends on data availability for this market. Volume, capacity, trade and other unit-based metrics are included where applicable.

