Home » Chemicals » Industrial Gases Market

Industrial Gases Market By Product (Oxygen, Nitrogen, Hydrogen, Carbon Dioxide (CO2), Others); By Application (Healthcare, Manufacturing, Metallurgy & Glass, Food & Beverages, Others); By Distribution Channel (On-site, Bulk, Cylinder); By Region – Growth, Share, Opportunities & Competitive Analysis, 2024 – 2032

Price: $4699

Published: | Report ID: 7536 | Report Format : PDF
REPORT ATTRIBUTE DETAILS
Historical Period  2019-2022
Base Year  2023
Forecast Period  2024-2032
Industrial Gases Market Size 2023  USD 102,578.43 Million
Industrial Gases Market, CAGR  5.25%
Industrial Gases Market Size 2032  USD 162,575.46 Million

Market Overview

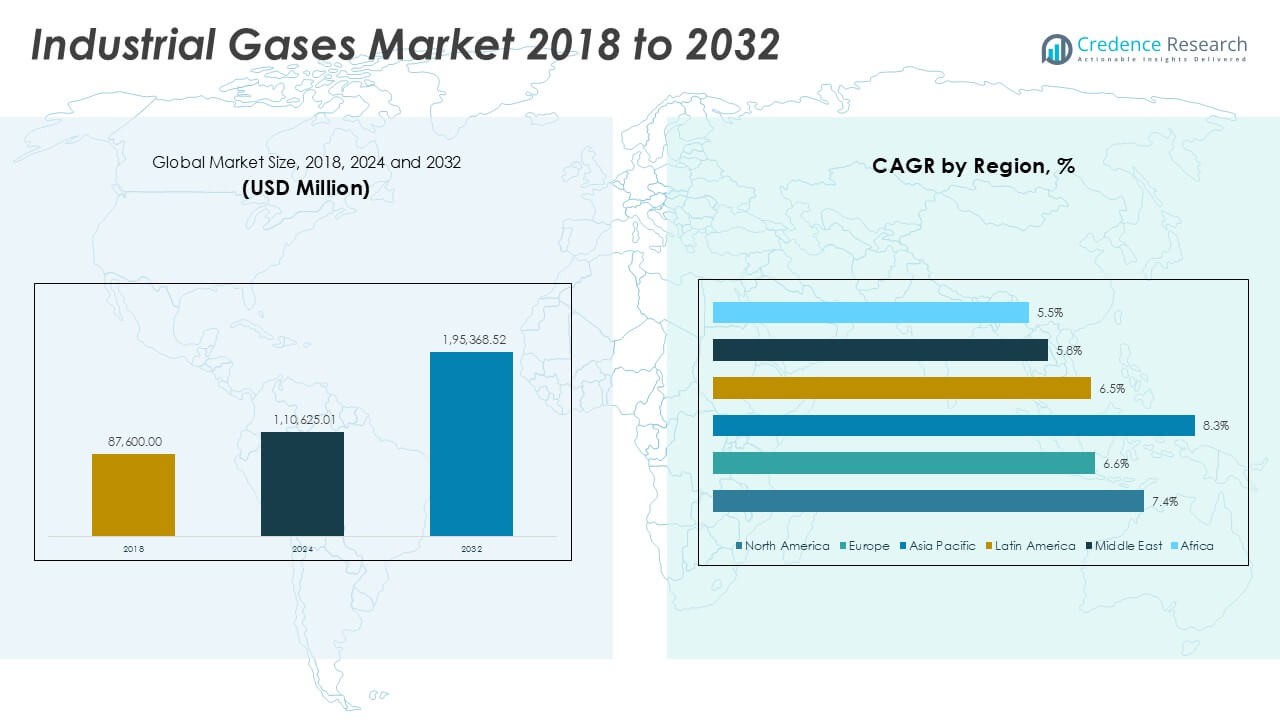
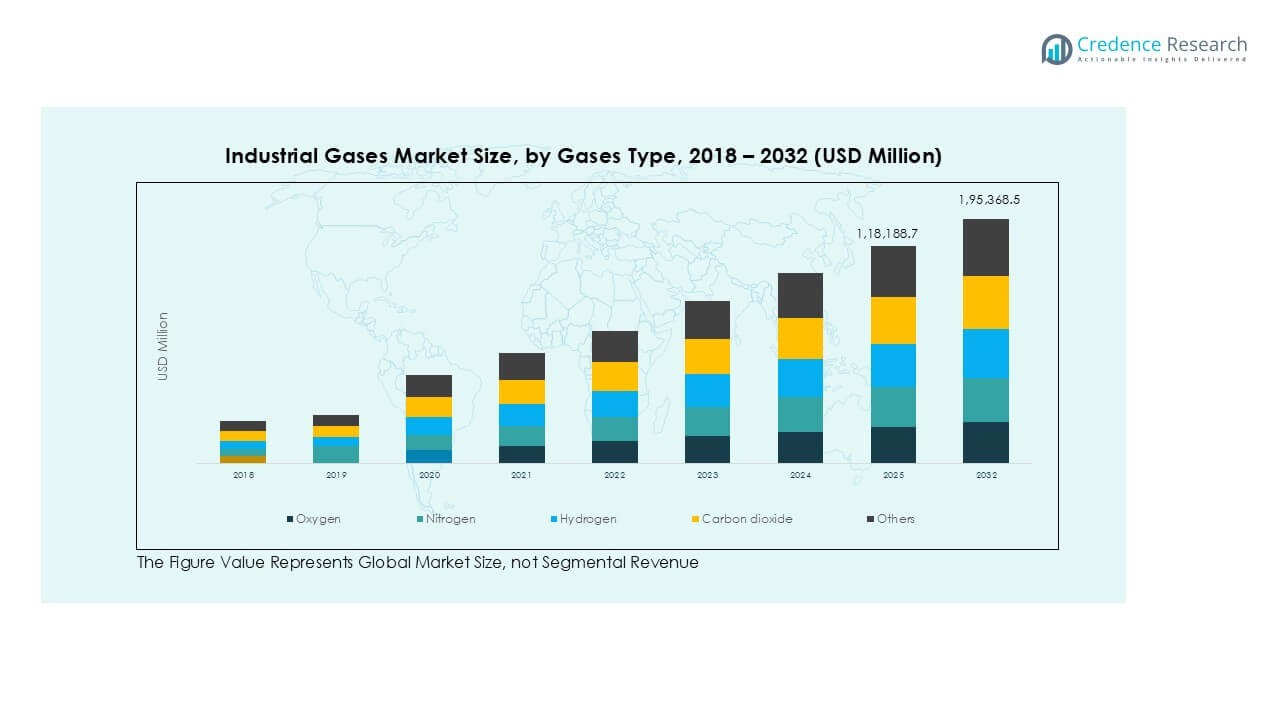
The Industrial Gases Market is projected to grow from USD 102,578.43 million in 2023 to an estimated USD 162,575.46 million by 2032, reflecting a compound annual growth rate (CAGR) of 5.25% from 2024 to 2032. This growth underscores the expanding applications of industrial gases across multiple sectors such as healthcare, electronics, metallurgy, and food and beverages.

Market growth is driven by heightened industrialization, rising healthcare needs, and the growing adoption of cleaner technologies that rely on gases such as hydrogen. Trends such as the shift towards renewable energy and green hydrogen production are reshaping the industry’s dynamics. In addition, the growing emphasis on safety and energy-efficient solutions is driving advancements in production, distribution, and storage technologies of industrial gases. Innovations and strategic investments in industrial gas processing facilities further contribute to market acceleration.

Geographically, the Asia-Pacific region dominates the industrial gases market, driven by rapid industrialization, urbanization, and robust demand from key sectors like manufacturing and healthcare. North America and Europe follow, driven by technological advancements and a focus on green energy solutions. Key players in the market include Linde plc, Air Liquide, Praxair Technology, Inc., Air Products and Chemicals, Inc., and Messer Group GmbH, who consistently focus on strategic mergers, acquisitions, and innovations to maintain a competitive edge.

Design Element 2

Access crucial information at unmatched prices!

Request your free sample report today & start making informed decisions powered by Credence Research!

Download Free Sample

CTA Design Element 3

Market Drivers

Expanding Applications Across Diverse Industries

Industrial gases have become integral to a wide range of industries such as healthcare, metallurgy, chemical manufacturing, food and beverages, and electronics. Their versatility, from enhancing productivity in metal fabrication processes to improving efficiency in chemical reactions, makes them indispensable to industrial operations. For instance, in the healthcare sector, the demand for oxygen has surged significantly due to its critical role in respiratory therapies and medical procedures. In 2020 alone, approximately 9.2 million metric tons of oxygen were produced in the United States to meet the needs of hospitals and other medical facilities. In the food and beverage industry, industrial gases like nitrogen and carbon dioxide are essential for processes such as packaging and carbonation, with cryogenic gases playing a crucial role in quick-freezing food products to preserve quality.In healthcare, oxygen is crucial for respiratory therapies, medical procedures, and hospital care, while in the food and beverage sector, carbon dioxide is vital for carbonation and preservation processes. The growing demand for such gases across various industries not only boosts their consumption but also spurs innovations in supply chains, storage, and distribution systems. As industries continue to scale operations and improve efficiencies, the demand for industrial gases is expected to rise, further driving market growth.

Increased Adoption of Clean Energy and Hydrogen Economy

With the global push towards reducing carbon emissions and adopting clean and renewable energy sources, the demand for green hydrogen and other eco-friendly gases is witnessing rapid growth. Hydrogen, in particular, has gained significant attention for its potential to replace conventional fossil fuels and serve as a clean energy source for sectors such as transportation, power generation, and industrial processes.Governments and organizations are investing heavily in green hydrogen projects, establishing hydrogen refueling infrastructure, and advancing production technologies to reduce costs and emissions. As hydrogen becomes a cornerstone of the future energy economy, the industrial gases market is positioned to experience substantial growth. In addition, the increased emphasis on reducing greenhouse gases and transitioning to sustainable operations has led to advancements in technologies like carbon capture and storage, which rely heavily on industrial gases.

Technological Advancements in Production and Storage

The industrial gases market benefits significantly from continuous innovations and technological advancements in the production, storage, and distribution of gases. Modern technologies, including cryogenic distillation, membrane separation, and pressure swing adsorption (PSA), have enhanced the efficiency and purity of gas production. As industries demand high-purity gases for sensitive applications, such as semiconductors in electronics manufacturing, these advancements become crucial for meeting market requirements. Furthermore, innovations in storage solutions, such as high-pressure storage tanks and advanced cylinder technologies, have addressed the challenges of safe transport and long-term storage of industrial gases. The development of efficient gas separation technologies, reduced energy consumption in manufacturing processes, and the digitization of supply chains further contribute to the market’s growth and appeal.

Increasing Investments and Strategic Collaborations

The industrial gases market is driven by increased investments from leading companies, governments, and institutional players in infrastructure, research and development, and technology adoption. Major market participants, such as Linde plc, Air Liquide, and Air Products and Chemicals, Inc., consistently invest in expanding their production capacities, enhancing distribution networks, and upgrading gas processing plants. Strategic collaborations and joint ventures among industry leaders have further boosted technological advancements, reduced production costs, and accelerated market growth. The investments also extend to initiatives promoting the circular economy and sustainability, such as waste gas recovery and green hydrogen production. Additionally, regulatory incentives encouraging industrial efficiency and sustainable practices provide the necessary impetus for players to innovate and strengthen their market position. As these collaborations deepen and investments flow into emerging markets, the industrial gases sector is expected to grow at an accelerated pace, providing a strong foundation for global market expansion.

Market Trends

Rising Focus on Green and Sustainable Solutions 

A significant trend in the industrial gases market is the increasing focus on green and sustainable solutions to align with global efforts to reduce carbon emissions and combat climate change. For instance, in 2024, Oil India initiated a carbon capture and storage (CCS) project in Rajasthan to capture CO2 emissions from its gas fields and store them in dry wells, aligning with its goal of achieving net-zero emissions by 2040. Governments, organizations, and industry players are turning to green hydrogen, which is produced using renewable energy sources such as wind and solar, as a cleaner alternative to conventional fuels. This transition supports decarbonization initiatives across sectors like transportation, power generation, and heavy industry. The growing emphasis on carbon capture, utilization, and storage (CCUS) technologies is also reshaping the market landscape. These technologies rely on industrial gases to capture and convert carbon emissions into value-added products, reducing their environmental impact. Additionally, industrial gas companies are developing eco-friendly offerings, such as low-carbon and zero-emission gases, to cater to customer demand for more sustainable solutions. This trend aligns with broader corporate sustainability goals, regulatory mandates, and consumer preferences for cleaner production processes.

Technological Innovations and Digitalization 

The industrial gases market is undergoing significant transformation due to the adoption of advanced technologies and digitalization. Technological innovations in production processes, such as cryogenic separation, membrane technologies, and advancements in gas processing, have led to higher purity levels, greater efficiency, and cost reductions in gas manufacturing. Moreover, digitalization is reshaping supply chains and operational processes. The use of data analytics, artificial intelligence (AI), and the Internet of Things (IoT) enables real-time monitoring, predictive maintenance, and optimized distribution, improving overall operational efficiency and reducing downtime. Companies are also leveraging automation to streamline production and distribution networks, minimizing manual intervention and boosting productivity. Furthermore, digital platforms and smart logistics systems are helping industrial gas providers track shipments, optimize inventory, and enhance customer experience. This trend not only increases transparency and operational agility but also ensures the timely delivery of gases, ultimately improving customer satisfaction and reducing costs. The ongoing wave of digital transformation presents a competitive edge for companies in the market, fostering growth and driving innovation.

Market Restraints and Challenges

High Production and Distribution Costs 

One of the major restraints for the industrial gases market is the high cost associated with production, storage, and distribution of these gases. The production process, particularly for specialty gases and high-purity industrial gases, often requires sophisticated equipment, energy-intensive processes, and stringent quality control measures. This leads to increased operating costs, especially in regions with high energy prices. Moreover, the safe and efficient storage and transportation of industrial gases, which often involve pressurized containers, cryogenic storage facilities, and complex distribution networks, further contribute to elevated logistics expenses. Small and medium-sized enterprises (SMEs) may find it challenging to bear such costs, limiting their ability to compete with larger, established players. Additionally, fluctuating raw material prices and the cost of regulatory compliance can add to the financial burden, thereby affecting the market’s overall profitability and growth.

Stringent Safety and Environmental Regulations 

The industrial gases market faces challenges due to stringent safety and environmental regulations imposed by governments and regulatory bodies worldwide. The storage, handling, and transportation of industrial gases involve significant risks, as many gases are flammable, toxic, or require precise temperature and pressure conditions. Companies must adhere to strict safety protocols and regulatory standards to ensure the safe handling of these gases, which can lead to increased compliance costs and operational complexities. Moreover, environmental regulations aimed at reducing greenhouse gas emissions and minimizing the environmental impact of industrial activities pose additional challenges for market players. While these regulations drive innovation and encourage sustainable practices, they also impose financial and operational constraints, especially for smaller companies with limited resources. Navigating these complex regulatory frameworks while maintaining competitiveness and ensuring compliance remains a persistent challenge for market participants.

Market Segmentation Analysis

By Product

Oxygen plays a critical role in healthcare for respiratory therapies, surgeries, and treatments, and is essential in industrial processes like metal cutting and steel production, driving strong demand across sectors. Nitrogen’s extensive use in food preservation, electronics manufacturing, chemical processing, and inerting due to its non-reactive properties sustains its growth in the market. Hydrogen is gaining momentum for its role in clean energy, serving as a key fuel source for transportation and energy storage, with applications in refining and hydrogen fuel cells. Carbon dioxide (CO2) remains vital for food and beverage applications, chemical production, and enhanced oil recovery, with demand further bolstered by carbon capture technologies. The “Others” category encompasses specialty gases like helium, argon, and acetylene, used in electronics, welding, and aerospace, driving growth in niche markets.

By Application

Industrial gases play a crucial role across various applications, including healthcare, where medical oxygen and nitrous oxide support patient care, respiratory therapies, and surgeries, driving demand alongside expanding healthcare infrastructure. In manufacturing, gases like nitrogen, oxygen, and hydrogen are essential for processes such as cutting, welding, and chemical synthesis, with global industrial growth fueling further demand. The metallurgy and glass sector relies on these gases for metal fabrication, steel production, and glassmaking, enhancing efficiency, product quality, and reducing emissions. The food and beverage industry depends on nitrogen and CO2 for preservation, packaging, and beverage carbonation, with market growth driven by increased demand for processed foods. Other sectors, such as electronics, automotive, and aerospace, require specialty and high-purity gases for precision processes and technological advancements, contributing to overall market expansion.

Segments

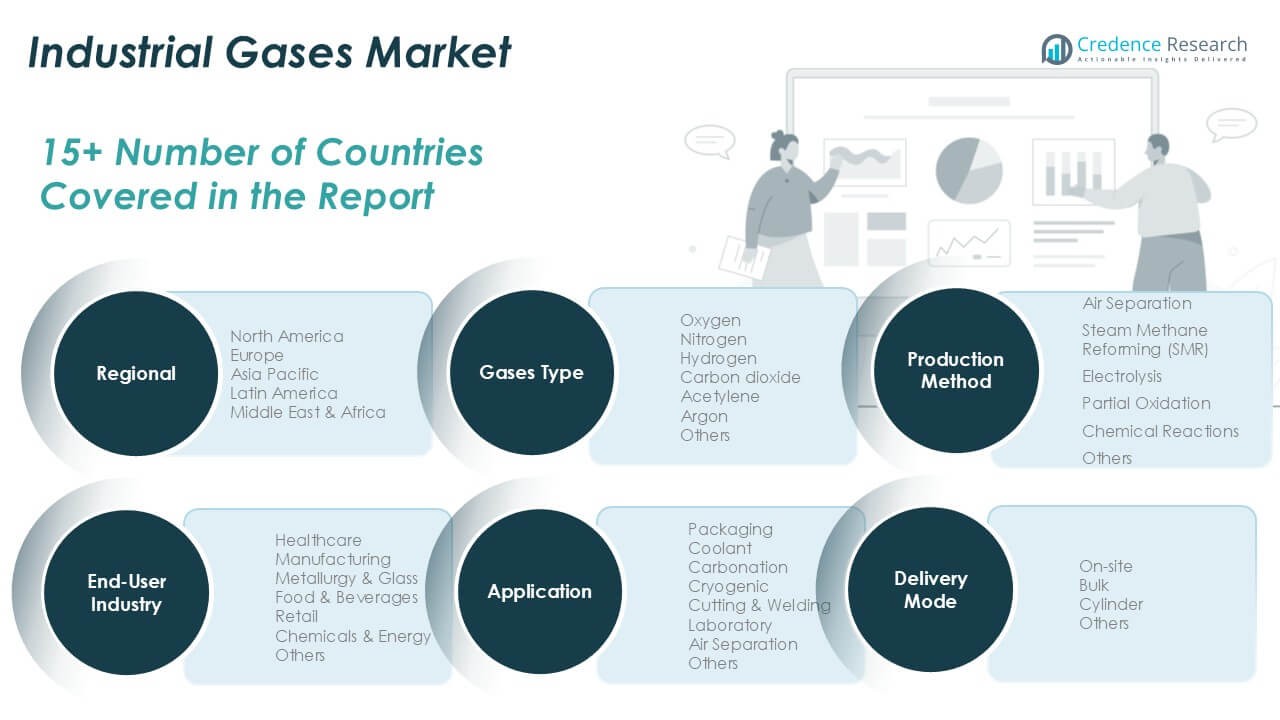
Based on Product

  • Oxygen
  • Nitrogen
  • Hydrogen
  • Carbon Dioxide (CO2)
  • Others

Based on Application

  • Healthcare
  • Manufacturing
  • Metallurgy & Glass
  • Food & Beverages
  • Others

Based on Distribution Channel

  • On-site
  • Bulk
  • Cylinder

Based on Region

  • North America
    • U.S.
    • Canada
    • Mexico
  • Europe
    • Germany
    • France
    • U.K.
    • Italy
    • Spain
    • Rest of Europe
  • Asia Pacific
    • China
    • Japan
    • India
    • South Korea
    • South-east Asia
    • Rest of Asia Pacific
  • Latin America
    • Brazil
    • Argentina
    • Rest of Latin America
  • Middle East & Africa
    • GCC Countries
    • South Africa
    • Rest of the Middle East and Africa

Regional Analysis

Asia-Pacific (35%) 

The Asia-Pacific region holds the largest market share in the industrial gases market, accounting for approximately 35% of the total market. This dominance is attributed to rapid industrialization, urbanization, and a robust demand for industrial gases from key sectors such as manufacturing, metallurgy, healthcare, and electronics. Countries like China, India, and Japan drive demand through substantial investments in infrastructure, expanding healthcare services, and growth in automotive and electronics industries. The region’s focus on green energy and hydrogen initiatives further strengthens the market’s outlook. As industrial activities continue to scale, the demand for industrial gases in APAC is expected to witness strong growth, driven by both government support and private investments in industrial expansion.

North America (25%) 

North America accounts for approximately 25% of the industrial gases market share. The region benefits from advanced technologies, a mature industrial base, and strong demand from industries such as healthcare, food and beverages, and energy. The emphasis on reducing carbon emissions and adopting cleaner technologies, particularly through the use of hydrogen as a clean energy source, drives market growth in the region. The United States and Canada are key contributors, with consistent investments in gas production facilities, carbon capture technologies, and renewable energy projects. North America’s strong regulatory focus on safety and environmental standards also shapes the market, pushing companies to innovate and adopt more sustainable practices.

Key players

  • Air Liquide
  • Linde plc
  • Company 3
  • Taiyo Nippon Sanso Corp.
  • Messer
  • SOL Group
  • Iwatani Corp.
  • Matheson Tri-Gas, Inc.
  • INOX-Air Products Inc.
  • Strandmøllen A/S

Competitive Analysis

The industrial gases market is characterized by intense competition among key players such as Air Liquide, Linde plc, Taiyo Nippon Sanso Corp., and Messer. These companies hold a significant share due to their expansive product portfolios, technological innovations, and strategic investments. Air Liquide and Linde plc, as market leaders, focus on global expansion, R&D, and clean energy solutions, particularly hydrogen initiatives. Taiyo Nippon Sanso Corp. and Messer emphasize regional dominance through targeted market penetration and specialized offerings. Smaller yet notable players like SOL Group, Iwatani Corp., and INOX-Air Products Inc. compete by providing tailored solutions, innovative applications, and operational excellence. The competitive landscape is further shaped by strategic partnerships, mergers, and acquisitions, enhancing production capabilities and geographic reach. Companies continue to focus on sustainability, regulatory compliance, and efficient distribution channels to maintain their competitive edge in this evolving market.

Recent Developments

  • In July 2024, Air Liquide finalized the divestiture of its businesses in 12 African countries, aligning with its strategy to regularly review its business portfolio.
  • In October 2024, Linde signed agreements to acquire two air separation units (ASUs) from Tata Steel Limited in Odisha, India, more than doubling its on-site capacity.
  • In April 2023, Taiyo Nippon Sanso expanded its electronics gas manufacturing capacity by breaking ground on a new plant in Yangzhou, China.
  • In June 2024, Messer opened a new production center in Estella, Spain, for filling industrial, food, medical, and specialty gases.
  • In September 2024, SOL Group acquired Content Solar, a renewable energy provider in Jamaica, expanding its presence in sustainable energy solutions.
  • In November 2024, Iwatani Corporation agreed to acquire ISG Inc., further solidifying its presence in the industrial gases market.
  • In May 2024, INOX-Air Products announced plans to establish its first green hydrogen plant with a capacity of 190 tonnes annually in Chittorgarh, Rajasthan, India. The plant is expected to be commissioned by July 2024.

Market Concentration and Characteristics 

The industrial gases market exhibits a moderately concentrated structure, dominated by a few major global players such as Air Liquide, Linde plc, and Taiyo Nippon Sanso Corp., who hold significant market shares through expansive product portfolios, extensive distribution networks, and technological leadership. These key players drive innovation and set industry standards, while smaller regional and niche companies compete through localized services, specialized offerings, and strategic partnerships. Market characteristics include high entry barriers due to substantial capital investment requirements, complex safety and regulatory compliance, and the need for advanced infrastructure for production, storage, and distribution. The market is characterized by its reliance on long-term contracts, steady demand across diverse industries, and an increasing focus on sustainability and clean energy solutions.

Shape Your Report to Specific Countries or Regions & Enjoy 30% Off!

Report Coverage

The research report offers an in-depth analysis based on Product, Application, Distribution Channel and Region. It details leading market players, providing an overview of their business, product offerings, investments, revenue streams, and key applications. Additionally, the report includes insights into the competitive environment, SWOT analysis, current market trends, as well as the primary drivers and constraints. Furthermore, it discusses various factors that have driven market expansion in recent years. The report also explores market dynamics, regulatory scenarios, and technological advancements that are shaping the industry. It assesses the impact of external factors and global economic changes on market growth. Lastly, it provides strategic recommendations for new entrants and established companies to navigate the complexities of the market.

Future Outlook

  1. The industrial gases market will see sustained demand growth across diverse sectors, including healthcare, manufacturing, electronics, and food and beverages, driven by industrial expansion and innovation.
  2. The adoption of clean energy solutions, particularly hydrogen as a renewable energy source, will drive investments and reshape market dynamics, contributing to the global energy transition.
  3. Governments and companies will continue to invest heavily in green hydrogen production, infrastructure, and distribution to meet emission reduction goals and support the shift to sustainable energy.
  4. Ongoing innovations in gas production, storage, and transportation technologies will improve process efficiency, reduce costs, and enable higher purity levels of industrial gases for specialized applications.
  5. Emerging economies in Asia, Africa, and Latin America will witness accelerated market growth due to industrialization, infrastructure development, and rising healthcare needs.
  6. The increasing adoption of carbon capture, utilization, and storage (CCUS) technologies will boost the demand for industrial gases used in emission reduction and sustainable practices.
  7. Digitalization and smart logistics solutions will optimize distribution, enhance supply chain transparency, and enable real-time monitoring, improving overall market efficiency and customer satisfaction.
  8. Companies will focus on mergers, acquisitions, and partnerships to enhance production capacities, broaden their market presence, and drive technological advancements in the industrial gases sector.
  9. Stringent regulatory frameworks focusing on environmental sustainability, safety, and emission control will push companies to innovate and adopt eco-friendly and compliant practices.
  10. The demand for customized and high-purity gas solutions tailored to specific industry requirements, such as electronics, pharmaceuticals, and semiconductors, will drive further market growth and innovation efforts.

CHAPTER NO. 1 : INTRODUCTION 24
1.1.1. Report Description 24
Purpose of the Report 24
USP & Key Offerings 24
1.1.2. Key Benefits for Stakeholders 24
1.1.3. Target Audience 25
1.1.4. Report Scope 25
1.1.5. Regional Scope 26
CHAPTER NO. 2 : EXECUTIVE SUMMARY 27
2.1. Industrial Gases Market Snapshot 27
2.1.1. Global Industrial Gases Market, 2018 – 2032 (USD Million) 28
CHAPTER NO. 3 : GEOPOLITICAL CRISIS IMPACT ANALYSIS 29
3.1. Russia-Ukraine and Israel-Palestine War Impacts 29
CHAPTER NO. 4 : INDUSTRIAL GASES MARKET – INDUSTRY ANALYSIS 30
4.1. Introduction 30
4.2. Market Drivers 31
4.2.1. Growing demand in the electronics and energy sectors for gases such as hydrogen and nitrogen 31
4.2.2. Rise in steel and metal manufacturing activities in emerging markets 32
4.3. Market Restraints 33
4.3.1. Stringent environmental regulations regarding emissions during gas production 33
4.4. Market Opportunities 34
4.4.1. Market Opportunity Analysis 34
4.5. Porter’s Five Forces Analysis 35
CHAPTER NO. 5 : ANALYSIS COMPETITIVE LANDSCAPE 36
5.1. Company Market Share Analysis – 2023 36
5.1.1. Global Industrial Gases Market: Company Market Share, by Volume, 2023 36
5.1.2. Global Industrial Gases Market: Company Market Share, by Revenue, 2023 37
5.1.3. Global Industrial Gases Market: Top 6 Company Market Share, by Revenue, 2023 37
5.1.4. Global Industrial Gases Market: Top 3 Company Market Share, by Revenue, 2023 38
5.2. Global Industrial Gases Market Company Revenue Market Share, 2023 39
5.3. Company Assessment Metrics, 2023 40
5.3.1. Stars 40
5.3.2. Emerging Leaders 40
5.3.3. Pervasive Players 40
5.3.4. Participants 40
5.4. Start-ups /SMEs Assessment Metrics, 2023 40
5.4.1. Progressive Companies 40
5.4.2. Responsive Companies 40
5.4.3. Dynamic Companies 40
5.4.4. Starting Blocks 40
5.5. Strategic Developments 41
5.5.1. Acquisitions & Mergers 41
New Product Launch 41
Regional Expansion 41
5.6. Key Players Product Matrix 42
CHAPTER NO. 6 : PESTEL & ADJACENT MARKET ANALYSIS 43
6.1. PESTEL 43
6.1.1. Political Factors 43
6.1.2. Economic Factors 43
6.1.3. Social Factors 43
6.1.4. Technological Factors 43
6.1.5. Environmental Factors 43
6.1.6. Legal Factors 43
6.2. Adjacent Market Analysis 43
CHAPTER NO. 7 : INDUSTRIAL GASES MARKET – BY PRODUCT SEGMENT ANALYSIS 44
7.1. Industrial Gases Market Overview, by Product Segment 44
7.1.1. Industrial Gases Market Revenue Share, By Product, 2023 & 2032 45
7.1.2. Industrial Gases Market Attractiveness Analysis, By Product 46
7.1.3. Incremental Revenue Growth Opportunity, by Product, 2024 – 2032 46
7.1.4. Industrial Gases Market Revenue, By Product, 2018, 2023, 2027 & 2032 47
7.2. Oxygen 48
7.2.1. Global Oxygen Industrial Gases Market Revenue, By Region, 2018 – 2023 (USD Million) 49
7.2.2. Global Oxygen Industrial Gases Market Revenue, By Region, 2024 – 2032 (USD Million) 49
7.3. Nitrogen 50
7.3.1. Global Nitrogen Industrial Gases Market Revenue, By Region, 2018 – 2023 (USD Million) 51
7.3.2. Global Nitrogen Industrial Gases Market Revenue, By Region, 2024 – 2032 (USD Million) 51
7.4. Hydrogen 52
7.4.1. Global Hydrogen Industrial Gases Market Revenue, By Region, 2018 – 2023 (USD Million) 53
7.4.2. Global Hydrogen Industrial Gases Market Revenue, By Region, 2024 – 2032 (USD Million) 53
7.5. Carbon dioxide 54
7.5.1. Global Carbon dioxide Industrial Gases Market Revenue, By Region, 2018 – 2023 (USD Million) 55
7.5.2. Global Carbon dioxide Industrial Gases Market Revenue, By Region, 2024 – 2032 (USD Million) 55
7.6. Others 56
7.6.1. Global Others Industrial Gases Market Revenue, By Region, 2018 – 2023 (USD Million) 57
7.6.2. Global Others Industrial Gases Market Revenue, By Region, 2024 – 2032 (USD Million) 57
CHAPTER NO. 8 : INDUSTRIAL GASES MARKET – BY APPLICATION SEGMENT ANALYSIS 58
8.1. Industrial Gases Market Overview, by Application Segment 58
8.1.1. Industrial Gases Market Revenue Share, By Application, 2023 & 2032 59
8.1.2. Industrial Gases Market Attractiveness Analysis, By Application 60
8.1.3. Incremental Revenue Growth Opportunity, by Application, 2024 – 2032 60
8.1.4. Industrial Gases Market Revenue, By Application, 2018, 2023, 2027 & 2032 61
8.2. Healthcare 62
8.2.1. Global Healthcare Industrial Gases Market Revenue, By Region, 2018 – 2023 (USD Million) 63
8.2.2. Global Healthcare Industrial Gases Market Revenue, By Region, 2024 – 2032 (USD Million) 63
8.3. Manufacturing 64
8.3.1. Global Manufacturing Industrial Gases Market Revenue, By Region, 2018 – 2023 (USD Million) 65
8.3.2. Global Manufacturing Industrial Gases Market Revenue, By Region, 2024 – 2032 (USD Million) 65
8.4. Metallurgy & Glass 66
8.4.1. Global Metallurgy & Glass Industrial Gases Market Revenue, By Region, 2018 – 2023 (USD Million) 67
8.4.2. Global Metallurgy & Glass Industrial Gases Market Revenue, By Region, 2024 – 2032 (USD Million) 67
8.5. Food & Beverages 68
8.5.1. Global Food & Beverages Industrial Gases Market Revenue, By Region, 2018 – 2023 (USD Million) 69
8.5.2. Global Food & Beverages Industrial Gases Market Revenue, By Region, 2024 – 2032 (USD Million) 69
8.6. Others 70
8.6.1. Global Others Industrial Gases Market Revenue, By Region, 2018 – 2023 (USD Million) 71
8.6.2. Global Others Industrial Gases Market Revenue, By Region, 2024 – 2032 (USD Million) 71
CHAPTER NO. 9 : INDUSTRIAL GASES MARKET – BY DISTRIBUTION CHANNEL SEGMENT ANALYSIS 72
9.1. Industrial Gases Market Overview, by Distribution Channel Segment 72
9.1.1. Industrial Gases Market Revenue Share, By Distribution Channel, 2023 & 2032 73
9.1.2. Industrial Gases Market Attractiveness Analysis, By Distribution Channel 74
9.1.3. Incremental Revenue Growth Opportunity, by Distribution Channel, 2024 – 2032 74
9.1.4. Industrial Gases Market Revenue, By Distribution Channel, 2018, 2023, 2027 & 2032 75
9.2. On-site 76
9.2.1. Global On-site Industrial Gases Market Revenue, By Region, 2018 – 2023 (USD Million) 77
9.2.2. Global On-site Industrial Gases Market Revenue, By Region, 2024 – 2032 (USD Million) 77
9.3. Bulk 78
9.3.1. Global Bulk Industrial Gases Market Revenue, By Region, 2018 – 2023 (USD Million) 79
9.3.2. Global Bulk Industrial Gases Market Revenue, By Region, 2024 – 2032 (USD Million) 79
9.4. Cylinder 80
9.4.1. Global Cylinder Industrial Gases Market Revenue, By Region, 2018 – 2023 (USD Million) 81
9.4.2. Global Cylinder Industrial Gases Market Revenue, By Region, 2024 – 2032 (USD Million) 81
CHAPTER NO. 10 : INDUSTRIAL GASES MARKET – REGIONAL ANALYSIS 82
10.1. Industrial Gases Market Overview, by Regional Segments 82
10.2. Region 83
10.2.1. Global Industrial Gases Market Revenue Share, By Region, 2023 & 2032 83
10.2.2. Industrial Gases Market Attractiveness Analysis, By Region 84
10.2.3. Incremental Revenue Growth Opportunity, by Region, 2024 – 2032 84
10.2.4. Industrial Gases Market Revenue, By Region, 2018, 2023, 2027 & 2032 85
10.2.5. Global Industrial Gases Market Revenue, By Region, 2018 – 2023 (USD Million) 86
10.2.6. Global Industrial Gases Market Revenue, By Region, 2024 – 2032 (USD Million) 86
10.3. Product 87
10.3.1. Global Industrial Gases Market Revenue, By Product, 2018 – 2023 (USD Million) 87
10.4. Global Industrial Gases Market Revenue, By Product, 2024 – 2032 (USD Million) 87
10.5. Application 88
10.5.1. Global Industrial Gases Market Revenue, By Application, 2018 – 2023 (USD Million) 88
10.5.2. Global Industrial Gases Market Revenue, By Application, 2024 – 2032 (USD Million) 88
10.6. Distribution Channel 89
10.6.1. Global Industrial Gases Market Revenue, By Distribution Channel, 2018 – 2023 (USD Million) 89
10.6.2. Global Industrial Gases Market Revenue, By Distribution Channel, 2024 – 2032 (USD Million) 89
CHAPTER NO. 11 : INDUSTRIAL GASES MARKET – NORTH AMERICA 90
11.1. North America 90
11.1.1. Key Highlights 90
11.1.2. North America Industrial Gases Market Revenue, By Country, 2018 – 2023 (USD Million) 91
11.1.3. North America Industrial Gases Market Revenue, By Product, 2018 – 2023 (USD Million) 92
11.1.4. North America Industrial Gases Market Revenue, By Application, 2018 – 2023 (USD Million) 93
11.1.5. North America Industrial Gases Market Revenue, By Distribution Channel, 2018 – 2023 (USD Million) 94
11.2. U.S. 95
11.3. Canada 95
11.4. Mexico 95
CHAPTER NO. 12 : INDUSTRIAL GASES MARKET – EUROPE 96
12.1. Europe 96
12.1.1. Key Highlights 96
12.1.2. Europe Industrial Gases Market Revenue, By Country, 2018 – 2023 (USD Million) 97
12.1.3. Europe Industrial Gases Market Revenue, By Product, 2018 – 2023 (USD Million) 98
12.1.4. Europe Industrial Gases Market Revenue, By Application, 2018 – 2023 (USD Million) 99
12.1.5. Europe Industrial Gases Market Revenue, By Distribution Channel, 2018 – 2023 (USD Million) 100
12.2. UK 101
12.3. France 101
12.4. Germany 101
12.5. Italy 101
12.6. Spain 101
12.7. Russia 101
12.8. Belgium 101
12.9. Netherland 101
12.10. Austria 101
12.11. Sweden 101
12.12. Poland 101
12.13. Denmark 101
12.14. Switzerland 101
12.15. Rest of Europe 101
CHAPTER NO. 13 : INDUSTRIAL GASES MARKET – ASIA PACIFIC 102
13.1. Asia Pacific 102
13.1.1. Key Highlights 102
13.1.2. Asia Pacific Industrial Gases Market Revenue, By Country, 2018 – 2023 (USD Million) 103
13.1.3. Asia Pacific Industrial Gases Market Revenue, By Product, 2018 – 2023 (USD Million) 104
13.1.4. Asia Pacific Industrial Gases Market Revenue, By Application, 2018 – 2023 (USD Million) 105
13.1.5. Asia Pacific Industrial Gases Market Revenue, By Distribution Channel, 2018 – 2023 (USD Million) 106
13.2. China 107
13.3. Japan 107
13.4. South Korea 107
13.5. India 107
13.6. Australia 107
13.7. Thailand 107
13.8. Indonesia 107
13.9. Vietnam 107
13.10. Malaysia 107
13.11. Philippines 107
13.12. Taiwan 107
13.13. Rest of Asia Pacific 107
CHAPTER NO. 14 : INDUSTRIAL GASES MARKET – LATIN AMERICA 108
14.1. Latin America 108
14.1.1. Key Highlights 108
14.1.2. Latin America Industrial Gases Market Revenue, By Country, 2018 – 2023 (USD Million) 109
14.1.3. Latin America Industrial Gases Market Revenue, By Product, 2018 – 2023 (USD Million) 110
14.1.4. Latin America Industrial Gases Market Revenue, By Application, 2018 – 2023 (USD Million) 111
14.1.5. Latin America Industrial Gases Market Revenue, By Distribution Channel, 2018 – 2023 (USD Million) 112
14.2. Brazil 113
14.3. Argentina 113
14.4. Peru 113
14.5. Chile 113
14.6. Colombia 113
14.7. Rest of Latin America 113
CHAPTER NO. 15 : INDUSTRIAL GASES MARKET – MIDDLE EAST 114
15.1. Middle East 114
15.1.1. Key Highlights 114
15.1.2. Middle East Industrial Gases Market Revenue, By Country, 2018 – 2023 (USD Million) 115
15.1.3. Middle East Industrial Gases Market Revenue, By Product, 2018 – 2023 (USD Million) 116
15.1.4. Middle East Industrial Gases Market Revenue, By Application, 2018 – 2023 (USD Million) 117
15.1.5. Middle East Industrial Gases Market Revenue, By Distribution Channel, 2018 – 2023 (USD Million) 118
15.2. UAE 119
15.3. KSA 119
15.4. Israel 119
15.5. Turkey 119
15.6. Iran 119
15.7. Rest of Middle East 119
CHAPTER NO. 16 : INDUSTRIAL GASES MARKET – AFRICA 120
16.1. Africa 120
16.1.1. Key Highlights 120
16.1.2. Africa Industrial Gases Market Revenue, By Country, 2018 – 2023 (USD Million) 121
16.1.3. Africa Industrial Gases Market Revenue, By Product, 2018 – 2023 (USD Million) 122
16.1.4. Africa Industrial Gases Market Revenue, By Application, 2018 – 2023 (USD Million) 123
16.1.5. Africa Industrial Gases Market Revenue, By Distribution Channel, 2018 – 2023 (USD Million) 124
16.2. Egypt 125
16.3. Nigeria 125
16.4. Algeria 125
16.5. Morocco 125
16.6. Rest of Africa 125
CHAPTER NO. 17 : COMPANY PROFILES 126
17.1. Air Liquide 126
17.1.1. Company Overview 126
17.1.2. Product Portfolio 126
17.1.3. Swot Analysis 126
17.1.4. Business Strategy 127
17.1.5. Financial Overview 127
17.2. Linde plc 128
17.3. Company 3 128
17.4. Taiyo Nippon Sanso Corp. 128
17.5. Messer 128
17.6. SOL Group 128
17.7. Iwatani Corp. 128
17.8. Matheson Tri-Gas, Inc. 128
17.9. INOX-Air Products Inc. 128
17.10. Strandmøllen A/S 128

List of Figures
FIG NO. 1. Global Industrial Gases Market Revenue, 2018 – 2032 (USD Million) 30
FIG NO. 2. Porter’s Five Forces Analysis for Global Industrial Gases Market 37
FIG NO. 3. Company Share Analysis, 2023 38
FIG NO. 4. Company Share Analysis, 2023 39
FIG NO. 5. Company Share Analysis, 2023 39
FIG NO. 6. Company Share Analysis, 2023 40
FIG NO. 7. Industrial Gases Market – Company Revenue Market Share, 2023 41
FIG NO. 8. Industrial Gases Market Revenue Share, By Product, 2023 & 2032 47
FIG NO. 9. Market Attractiveness Analysis, By Product 48
FIG NO. 10. Incremental Revenue Growth Opportunity by Product, 2024 – 2032 48
FIG NO. 11. Industrial Gases Market Revenue, By Product, 2018, 2023, 2027 & 2032 49
FIG NO. 12. Global Industrial Gases Market for Oxygen, Revenue (USD Million) 2018 – 2032 50
FIG NO. 13. Global Industrial Gases Market for Nitrogen, Revenue (USD Million) 2018 – 2032 52
FIG NO. 14. Global Industrial Gases Market for Hydrogen, Revenue (USD Million) 2018 – 2032 54
FIG NO. 15. Global Industrial Gases Market for Carbon dioxide, Revenue (USD Million) 2018 – 2032 56
FIG NO. 16. Global Industrial Gases Market for Others, Revenue (USD Million) 2018 – 2032 58
FIG NO. 17. Industrial Gases Market Revenue Share, By Application, 2023 & 2032 61
FIG NO. 18. Market Attractiveness Analysis, By Application 62
FIG NO. 19. Incremental Revenue Growth Opportunity by Application, 2024 – 2032 62
FIG NO. 20. Industrial Gases Market Revenue, By Application, 2018, 2023, 2027 & 2032 63
FIG NO. 21. Global Industrial Gases Market for Healthcare, Revenue (USD Million) 2018 – 2032 64
FIG NO. 22. Global Industrial Gases Market for Manufacturing, Revenue (USD Million) 2018 – 2032 66
FIG NO. 23. Global Industrial Gases Market for Metallurgy & Glass, Revenue (USD Million) 2018 – 2032 68
FIG NO. 24. Global Industrial Gases Market for Food & Beverages, Revenue (USD Million) 2018 – 2032 70
FIG NO. 25. Global Industrial Gases Market for Others, Revenue (USD Million) 2018 – 2032 72
FIG NO. 26. Industrial Gases Market Revenue Share, By Distribution Channel, 2023 & 2032 75
FIG NO. 27. Market Attractiveness Analysis, By Distribution Channel 76
FIG NO. 28. Incremental Revenue Growth Opportunity by Distribution Channel, 2024 – 2032 76
FIG NO. 29. Industrial Gases Market Revenue, By Distribution Channel, 2018, 2023, 2027 & 2032 77
FIG NO. 30. Global Industrial Gases Market for On-site, Revenue (USD Million) 2018 – 2032 78
FIG NO. 31. Global Industrial Gases Market for Bulk, Revenue (USD Million) 2018 – 2032 80
FIG NO. 32. Global Industrial Gases Market for Cylinder, Revenue (USD Million) 2018 – 2032 82
FIG NO. 33. Global Industrial Gases Market Revenue Share, By Region, 2023 & 2032 85
FIG NO. 34. Market Attractiveness Analysis, By Region 86
FIG NO. 35. Incremental Revenue Growth Opportunity by Region, 2024 – 2032 86
FIG NO. 36. Industrial Gases Market Revenue, By Region, 2018, 2023, 2027 & 2032 87
FIG NO. 37. North America Industrial Gases Market Revenue, 2018 – 2032 (USD Million) 92
FIG NO. 38. Europe Industrial Gases Market Revenue, 2018 – 2032 (USD Million) 98
FIG NO. 39. Asia Pacific Industrial Gases Market Revenue, 2018 – 2032 (USD Million) 104
FIG NO. 40. Latin America Industrial Gases Market Revenue, 2018 – 2032 (USD Million) 110
FIG NO. 41. Middle East Industrial Gases Market Revenue, 2018 – 2032 (USD Million) 116
FIG NO. 42. Africa Industrial Gases Market Revenue, 2018 – 2032 (USD Million) 122

List of Tables
TABLE NO. 1. : Global Industrial Gases Market: Snapshot 27
TABLE NO. 2. : Drivers for the Industrial Gases Market: Impact Analysis 31
TABLE NO. 3. : Restraints for the Industrial Gases Market: Impact Analysis 33
TABLE NO. 4. : Global Oxygen Industrial Gases Market Revenue, By Region, 2018 – 2023 (USD Million) 49
TABLE NO. 5. : Global Oxygen Industrial Gases Market Revenue, By Region, 2024 – 2032 (USD Million) 49
TABLE NO. 6. : Global Nitrogen Industrial Gases Market Revenue, By Region, 2018 – 2023 (USD Million) 51
TABLE NO. 7. : Global Nitrogen Industrial Gases Market Revenue, By Region, 2024 – 2032 (USD Million) 51
TABLE NO. 8. : Global Hydrogen Industrial Gases Market Revenue, By Region, 2018 – 2023 (USD Million) 53
TABLE NO. 9. : Global Hydrogen Industrial Gases Market Revenue, By Region, 2024 – 2032 (USD Million) 53
TABLE NO. 10. : Global Carbon dioxide Industrial Gases Market Revenue, By Region, 2018 – 2023 (USD Million) 55
TABLE NO. 11. : Global Carbon dioxide Industrial Gases Market Revenue, By Region, 2024 – 2032 (USD Million) 55
TABLE NO. 12. : Global Others Industrial Gases Market Revenue, By Region, 2018 – 2023 (USD Million) 57
TABLE NO. 13. : Global Others Industrial Gases Market Revenue, By Region, 2024 – 2032 (USD Million) 57
TABLE NO. 14. : Global Healthcare Industrial Gases Market Revenue, By Region, 2018 – 2023 (USD Million) 63
TABLE NO. 15. : Global Healthcare Industrial Gases Market Revenue, By Region, 2024 – 2032 (USD Million) 63
TABLE NO. 16. : Global Manufacturing Industrial Gases Market Revenue, By Region, 2018 – 2023 (USD Million) 65
TABLE NO. 17. : Global Manufacturing Industrial Gases Market Revenue, By Region, 2024 – 2032 (USD Million) 65
TABLE NO. 18. : Global Metallurgy & Glass Industrial Gases Market Revenue, By Region, 2018 – 2023 (USD Million) 67
TABLE NO. 19. : Global Metallurgy & Glass Industrial Gases Market Revenue, By Region, 2024 – 2032 (USD Million) 67
TABLE NO. 20. : Global Food & Beverages Industrial Gases Market Revenue, By Region, 2018 – 2023 (USD Million) 69
TABLE NO. 21. : Global Food & Beverages Industrial Gases Market Revenue, By Region, 2024 – 2032 (USD Million) 69
TABLE NO. 22. : Global Others Industrial Gases Market Revenue, By Region, 2018 – 2023 (USD Million) 71
TABLE NO. 23. : Global Others Industrial Gases Market Revenue, By Region, 2024 – 2032 (USD Million) 71
TABLE NO. 24. : Global On-site Industrial Gases Market Revenue, By Region, 2018 – 2023 (USD Million) 77
TABLE NO. 25. : Global On-site Industrial Gases Market Revenue, By Region, 2024 – 2032 (USD Million) 77
TABLE NO. 26. : Global Bulk Industrial Gases Market Revenue, By Region, 2018 – 2023 (USD Million) 79
TABLE NO. 27. : Global Bulk Industrial Gases Market Revenue, By Region, 2024 – 2032 (USD Million) 79
TABLE NO. 28. : Global Cylinder Industrial Gases Market Revenue, By Region, 2018 – 2023 (USD Million) 81
TABLE NO. 29. : Global Cylinder Industrial Gases Market Revenue, By Region, 2024 – 2032 (USD Million) 81
TABLE NO. 30. : Global Industrial Gases Market Revenue, By Region, 2018 – 2023 (USD Million) 86
TABLE NO. 31. : Global Industrial Gases Market Revenue, By Region, 2024 – 2032 (USD Million) 86
TABLE NO. 32. : Global Industrial Gases Market Revenue, By Product, 2018 – 2023 (USD Million) 87
TABLE NO. 33. : Global Industrial Gases Market Revenue, By Product, 2024 – 2032 (USD Million) 87
TABLE NO. 34. : Global Industrial Gases Market Revenue, By Application, 2018 – 2023 (USD Million) 88
TABLE NO. 35. : Global Industrial Gases Market Revenue, By Application, 2024 – 2032 (USD Million) 88
TABLE NO. 36. : Global Industrial Gases Market Revenue, By Distribution Channel, 2018 – 2023 (USD Million) 89
TABLE NO. 37. : Global Industrial Gases Market Revenue, By Distribution Channel, 2024 – 2032 (USD Million) 89
TABLE NO. 38. : North America Industrial Gases Market Revenue, By Country, 2018 – 2023 (USD Million) 91
TABLE NO. 39. : North America Industrial Gases Market Revenue, By Country, 2024 – 2032 (USD Million) 91
TABLE NO. 40. : North America Industrial Gases Market Revenue, By Product, 2018 – 2023 (USD Million) 92
TABLE NO. 41. : North America Industrial Gases Market Revenue, By Product, 2024 – 2032 (USD Million) 92
TABLE NO. 42. : North America Industrial Gases Market Revenue, By Application, 2018 – 2023 (USD Million) 93
TABLE NO. 43. : North America Industrial Gases Market Revenue, By Application, 2024 – 2032 (USD Million) 93
TABLE NO. 44. : North America Industrial Gases Market Revenue, By Distribution Channel, 2018 – 2023 (USD Million) 94
TABLE NO. 45. : North America Industrial Gases Market Revenue, By Distribution Channel, 2024 – 2032 (USD Million) 94
TABLE NO. 46. : Europe Industrial Gases Market Revenue, By Country, 2018 – 2023 (USD Million) 97
TABLE NO. 47. : Europe Industrial Gases Market Revenue, By Country, 2024 – 2032 (USD Million) 97
TABLE NO. 48. : Europe Industrial Gases Market Revenue, By Product, 2018 – 2023 (USD Million) 98
TABLE NO. 49. : Europe Industrial Gases Market Revenue, By Product, 2024 – 2032 (USD Million) 98
TABLE NO. 50. : Europe Industrial Gases Market Revenue, By Application, 2018 – 2023 (USD Million) 99
TABLE NO. 51. : Europe Industrial Gases Market Revenue, By Application, 2024 – 2032 (USD Million) 99
TABLE NO. 52. : Europe Industrial Gases Market Revenue, By Distribution Channel, 2018 – 2023 (USD Million) 100
TABLE NO. 53. : Europe Industrial Gases Market Revenue, By Distribution Channel, 2024 – 2032 (USD Million) 100
TABLE NO. 54. : Asia Pacific Industrial Gases Market Revenue, By Country, 2018 – 2023 (USD Million) 103
TABLE NO. 55. : Asia Pacific Industrial Gases Market Revenue, By Country, 2024 – 2032 (USD Million) 103
TABLE NO. 56. : Asia Pacific Industrial Gases Market Revenue, By Product, 2018 – 2023 (USD Million) 104
TABLE NO. 57. : Asia Pacific Industrial Gases Market Revenue, By Product, 2024 – 2032 (USD Million) 104
TABLE NO. 58. : Asia Pacific Industrial Gases Market Revenue, By Application, 2018 – 2023 (USD Million) 105
TABLE NO. 59. : Asia Pacific Industrial Gases Market Revenue, By Application, 2024 – 2032 (USD Million) 105
TABLE NO. 60. : Asia Pacific Industrial Gases Market Revenue, By Distribution Channel, 2018 – 2023 (USD Million) 106
TABLE NO. 61. : Asia Pacific Industrial Gases Market Revenue, By Distribution Channel, 2024 – 2032 (USD Million) 106
TABLE NO. 62. : Latin America Industrial Gases Market Revenue, By Country, 2018 – 2023 (USD Million) 109
TABLE NO. 63. : Latin America Industrial Gases Market Revenue, By Country, 2024 – 2032 (USD Million) 109
TABLE NO. 64. : Latin America Industrial Gases Market Revenue, By Product, 2018 – 2023 (USD Million) 110
TABLE NO. 65. : Latin America Industrial Gases Market Revenue, By Product, 2024 – 2032 (USD Million) 110
TABLE NO. 66. : Latin America Industrial Gases Market Revenue, By Application, 2018 – 2023 (USD Million) 111
TABLE NO. 67. : Latin America Industrial Gases Market Revenue, By Application, 2024 – 2032 (USD Million) 111
TABLE NO. 68. : Latin America Industrial Gases Market Revenue, By Distribution Channel, 2018 – 2023 (USD Million) 112
TABLE NO. 69. : Latin America Industrial Gases Market Revenue, By Distribution Channel, 2024 – 2032 (USD Million) 112
TABLE NO. 70. : Middle East Industrial Gases Market Revenue, By Country, 2018 – 2023 (USD Million) 115
TABLE NO. 71. : Middle East Industrial Gases Market Revenue, By Country, 2024 – 2032 (USD Million) 115
TABLE NO. 72. : Middle East Industrial Gases Market Revenue, By Product, 2018 – 2023 (USD Million) 116
TABLE NO. 73. : Middle East Industrial Gases Market Revenue, By Product, 2024 – 2032 (USD Million) 116
TABLE NO. 74. : Middle East Industrial Gases Market Revenue, By Application, 2018 – 2023 (USD Million) 117
TABLE NO. 75. : Middle East Industrial Gases Market Revenue, By Application, 2024 – 2032 (USD Million) 117
TABLE NO. 76. : Middle East Industrial Gases Market Revenue, By Distribution Channel, 2018 – 2023 (USD Million) 118
TABLE NO. 77. : Middle East Industrial Gases Market Revenue, By Distribution Channel, 2024 – 2032 (USD Million) 118
TABLE NO. 78. : Africa Industrial Gases Market Revenue, By Country, 2018 – 2023 (USD Million) 121
TABLE NO. 79. : Africa Industrial Gases Market Revenue, By Country, 2024 – 2032 (USD Million) 121
TABLE NO. 80. : Africa Industrial Gases Market Revenue, By Product, 2018 – 2023 (USD Million) 122
TABLE NO. 81. : Africa Industrial Gases Market Revenue, By Product, 2024 – 2032 (USD Million) 122
TABLE NO. 82. : Africa Industrial Gases Market Revenue, By Application, 2018 – 2023 (USD Million) 123
TABLE NO. 83. : Africa Industrial Gases Market Revenue, By Application, 2024 – 2032 (USD Million) 123
TABLE NO. 84. : Africa Industrial Gases Market Revenue, By Distribution Channel, 2018 – 2023 (USD Million) 124
TABLE NO. 85. : Africa Industrial Gases Market Revenue, By Distribution Channel, 2024 – 2032 (USD Million) 124

Frequently Asked Questions

What is the projected market size of the industrial gases market in 2023 and 2032?

The industrial gases market is expected to grow from USD 102,578.43 million in 2023 to USD 162,575.46 million by 2032, with a compound annual growth rate (CAGR) of 5.25% from 2024 to 2032.

What factors are driving the growth of the industrial gases market?

Market growth is driven by industrialization, rising healthcare needs, adoption of clean technologies, and growing demand for gases such as hydrogen, oxygen, and nitrogen across various industries.

Which regions dominate the industrial gases market?

The Asia-Pacific region leads the market due to rapid industrialization and strong demand in key sectors like manufacturing and healthcare, followed by North America and Europe.

What role do industrial gases play in the energy transition?

Industrial gases, especially hydrogen, play a key role in clean energy initiatives and the global shift towards renewable energy, aiding decarbonization and sustainable energy solutions.

Who are the major players in the industrial gases market?

Key players include Linde plc, Air Liquide, Praxair Technology, Inc., Air Products and Chemicals, Inc., and Messer Group GmbH, known for strategic innovations and expansions.

Industrial Hose Assemblies Market

Published:
Report ID: 64193

Industrial Wireless Broken Signal Solutions Market

Published:
Report ID: 63526

Industrial Operational Intelligence Solutions Market

Published:
Report ID: 63518

Industrial and Institutional Hand Hygiene Chemicals Market

Published:
Report ID: 63510

Industrial and Institutional Cleaning Chemicals Market

Published:
Report ID: 56561

Industrial Pails Market

Published:
Report ID: 62888

Industrial Hearable Market

Published:
Report ID: 7480

Industrial Cyber Security Solutions And Services Market

Published:
Report ID: 6773

Industrial Battery Chargers Market

Published:
Report ID: 6577

Acrylic Styrene Acrylonitrile Resin Market

Published:
Report ID: 64537

2 Ethyl-Anthraquinone Market

Published:
Report ID: 64510

Indian Automotive Appearance Chemical Market

Published:
Report ID: 64509

Canada Automotive Appearance Chemical Market

Published:
Report ID: 64506

Cosmetic Ingredients Market

Published:
Report ID: 3703

Turkey Automotive Appearance Chemical Market

Published:
Report ID: 64388

Ceramic Membrane Market

Published:
Report ID: 64350

Encapsulated Lactic Acid Market

Published:
Report ID: 17223

Japan Automotive Appearance Chemical Market

Published:
Report ID: 64207

Algae Treatment Chemical Market

Published:
Report ID: 63835

Low Frequency Sound Absorbing Insulation Material Market

Published:
Report ID: 63698

White Coal Market

Published:
Report ID: 63569

Purchase Options

The report comes as a view-only PDF document, optimized for individual clients. This version is recommended for personal digital use and does not allow printing.
$4699

To meet the needs of modern corporate teams, our report comes in two formats: a printable PDF and a data-rich Excel sheet. This package is optimized for internal analysis and multi-location access, making it an excellent choice for organizations with distributed workforce.
$5699

The report will be delivered in printable PDF format along with the report’s data Excel sheet. This license offers 100 Free Analyst hours where the client can utilize Credence Research Inc.’s research team. It is highly recommended for organizations seeking to execute short, customized research projects related to the scope of the purchased report.
$7699

Smallform of Sample request

Have a question?

User Profile

Don’t settle for less – trust Mitul to help you find the best solution.

Report delivery within 24 to 48 hours

– Other Info –

What people say?-

User Review

I am very impressed with the information in this report. The author clearly did their research when they came up with this product and it has already given me a lot of ideas.

Jana Schmidt
CEDAR CX Technologies

– Connect with us –

Phone

+91 6232 49 3207


support

24/7 Research Support


sales@credenceresearch.com

– Research Methodology –

Going beyond the basics: advanced techniques in research methodology

– Trusted By –

Pepshi, LG, Nestle
Motorola, Honeywell, Johnson and johnson
LG Chem, SIEMENS, Pfizer
Unilever, Samsonite, QIAGEN