
Blades, vehicles and circuit boards set composite demand
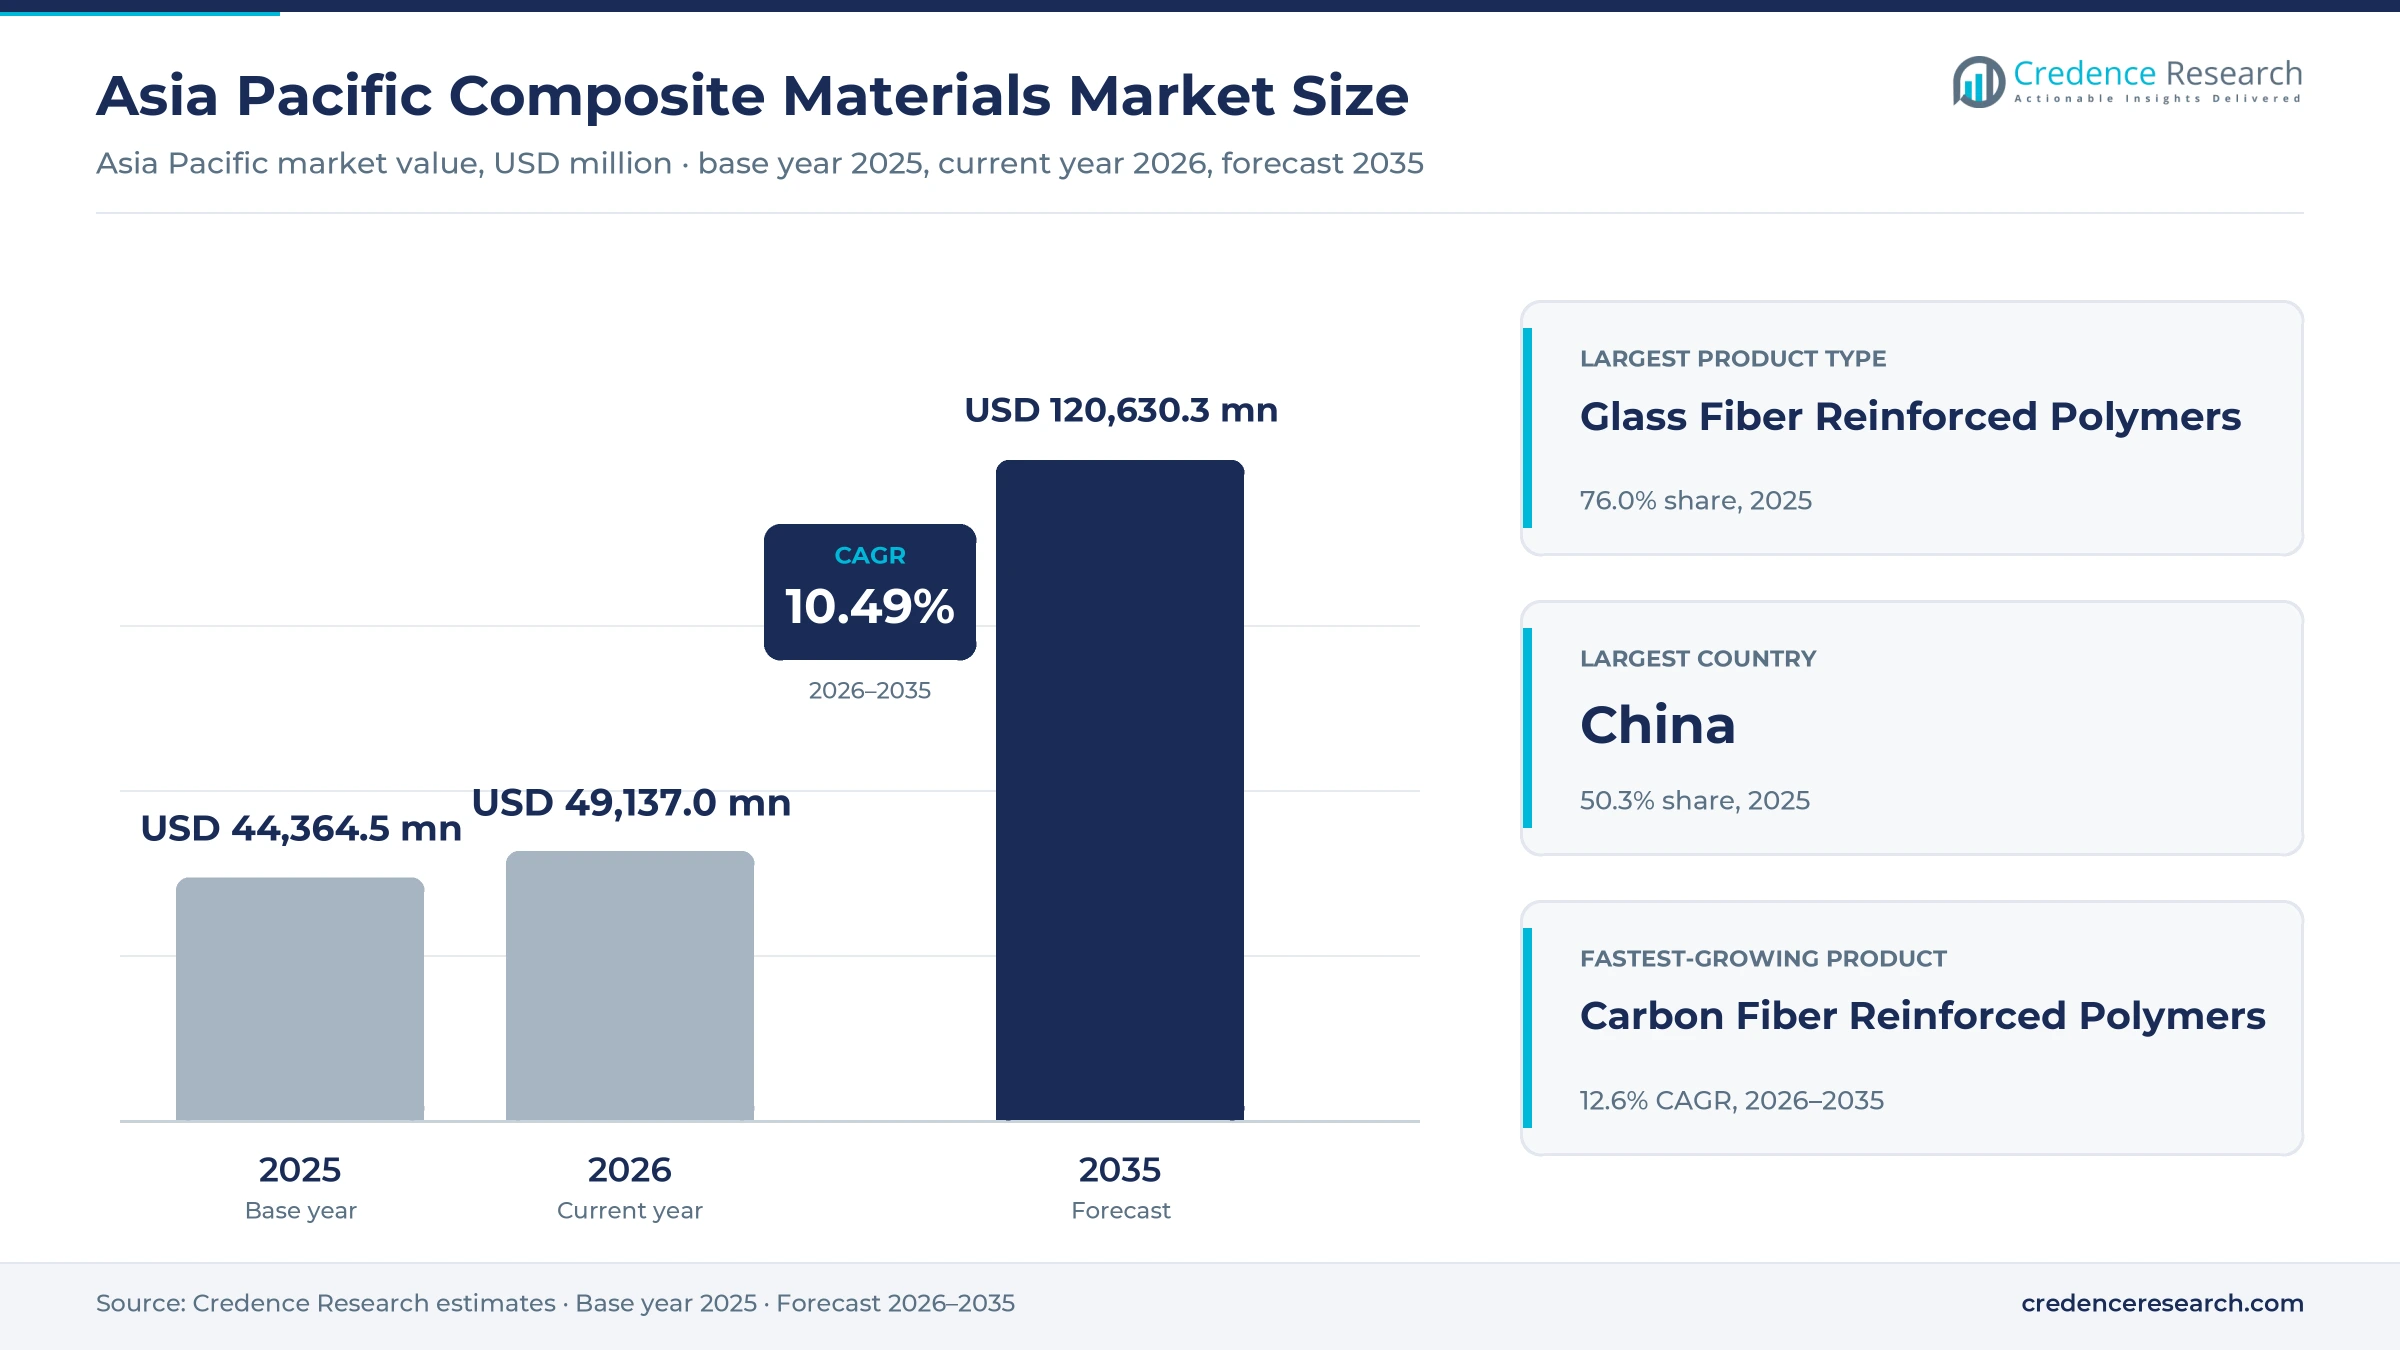
The Asia Pacific composite materials market was valued at USD 44.36 billion in 2025 and is projected to increase from USD 49.14 billion in 2026 to USD 120.63 billion by 2035, registering a CAGR of 10.49% during 2026–2035. Wind blade makers, vehicle and rail builders, pipe and tank fabricators and circuit board laminators account for most purchases, because each needs stiffness or corrosion resistance at lower weight than steel or aluminum. China held the largest share, 50.3% in 2025, on the strength of its glass fiber furnaces, carbon fiber lines and blade plants. India is the fastest-growing country at 12.9% a year, supported by record wind additions and rail fleet renewal. Hydrogen storage has also moved into national law in China and Japan, which gives filament-wound pressure vessels a qualified market. Weak commodity glass fiber prices, however, keep margins thin for producers without scale or specialty grades.
Glass, carbon, natural and aramid reinforced polymers define the scope
The estimate measures the value of fiber-reinforced polymer composites sold for use in Asia Pacific, counted at first sale as molded, wound, pultruded, laminated or prepreg material and parts. It covers glass, carbon, natural and aramid or hybrid reinforcements in thermoset or thermoplastic resins, bought by component fabricators, equipment makers, engineering contractors and specialist product manufacturers.
The estimate excludes metal-matrix and ceramic-matrix composites, wood-plastic decking, unreinforced plastics and the value added when a composite part is assembled into a turbine, vehicle or building. Fiber and resin enter the count only through the composite products made from them, which avoids counting the same kilogram twice. The value chain runs from glass furnaces, precursor and carbon fiber lines and resin plants through weavers and prepreggers to molders, winders and pultruders that serve end users.
Asia Pacific Composite Materials Market Insights
- The Asia Pacific composite materials market grows from USD 44.36 billion in 2025 to USD 120.63 billion by 2035 at a 10.49% CAGR, led by wind blades, vehicles and electronics substrates.
- China held 50.3% of regional value in 2025, while India is the fastest-growing country at 12.9% a year on record wind additions and rail renewal.
- Glass fiber reinforced polymers led product types with 76.0% of 2025 value, because pipes, panels, blades and circuit boards use them in the largest tonnages.
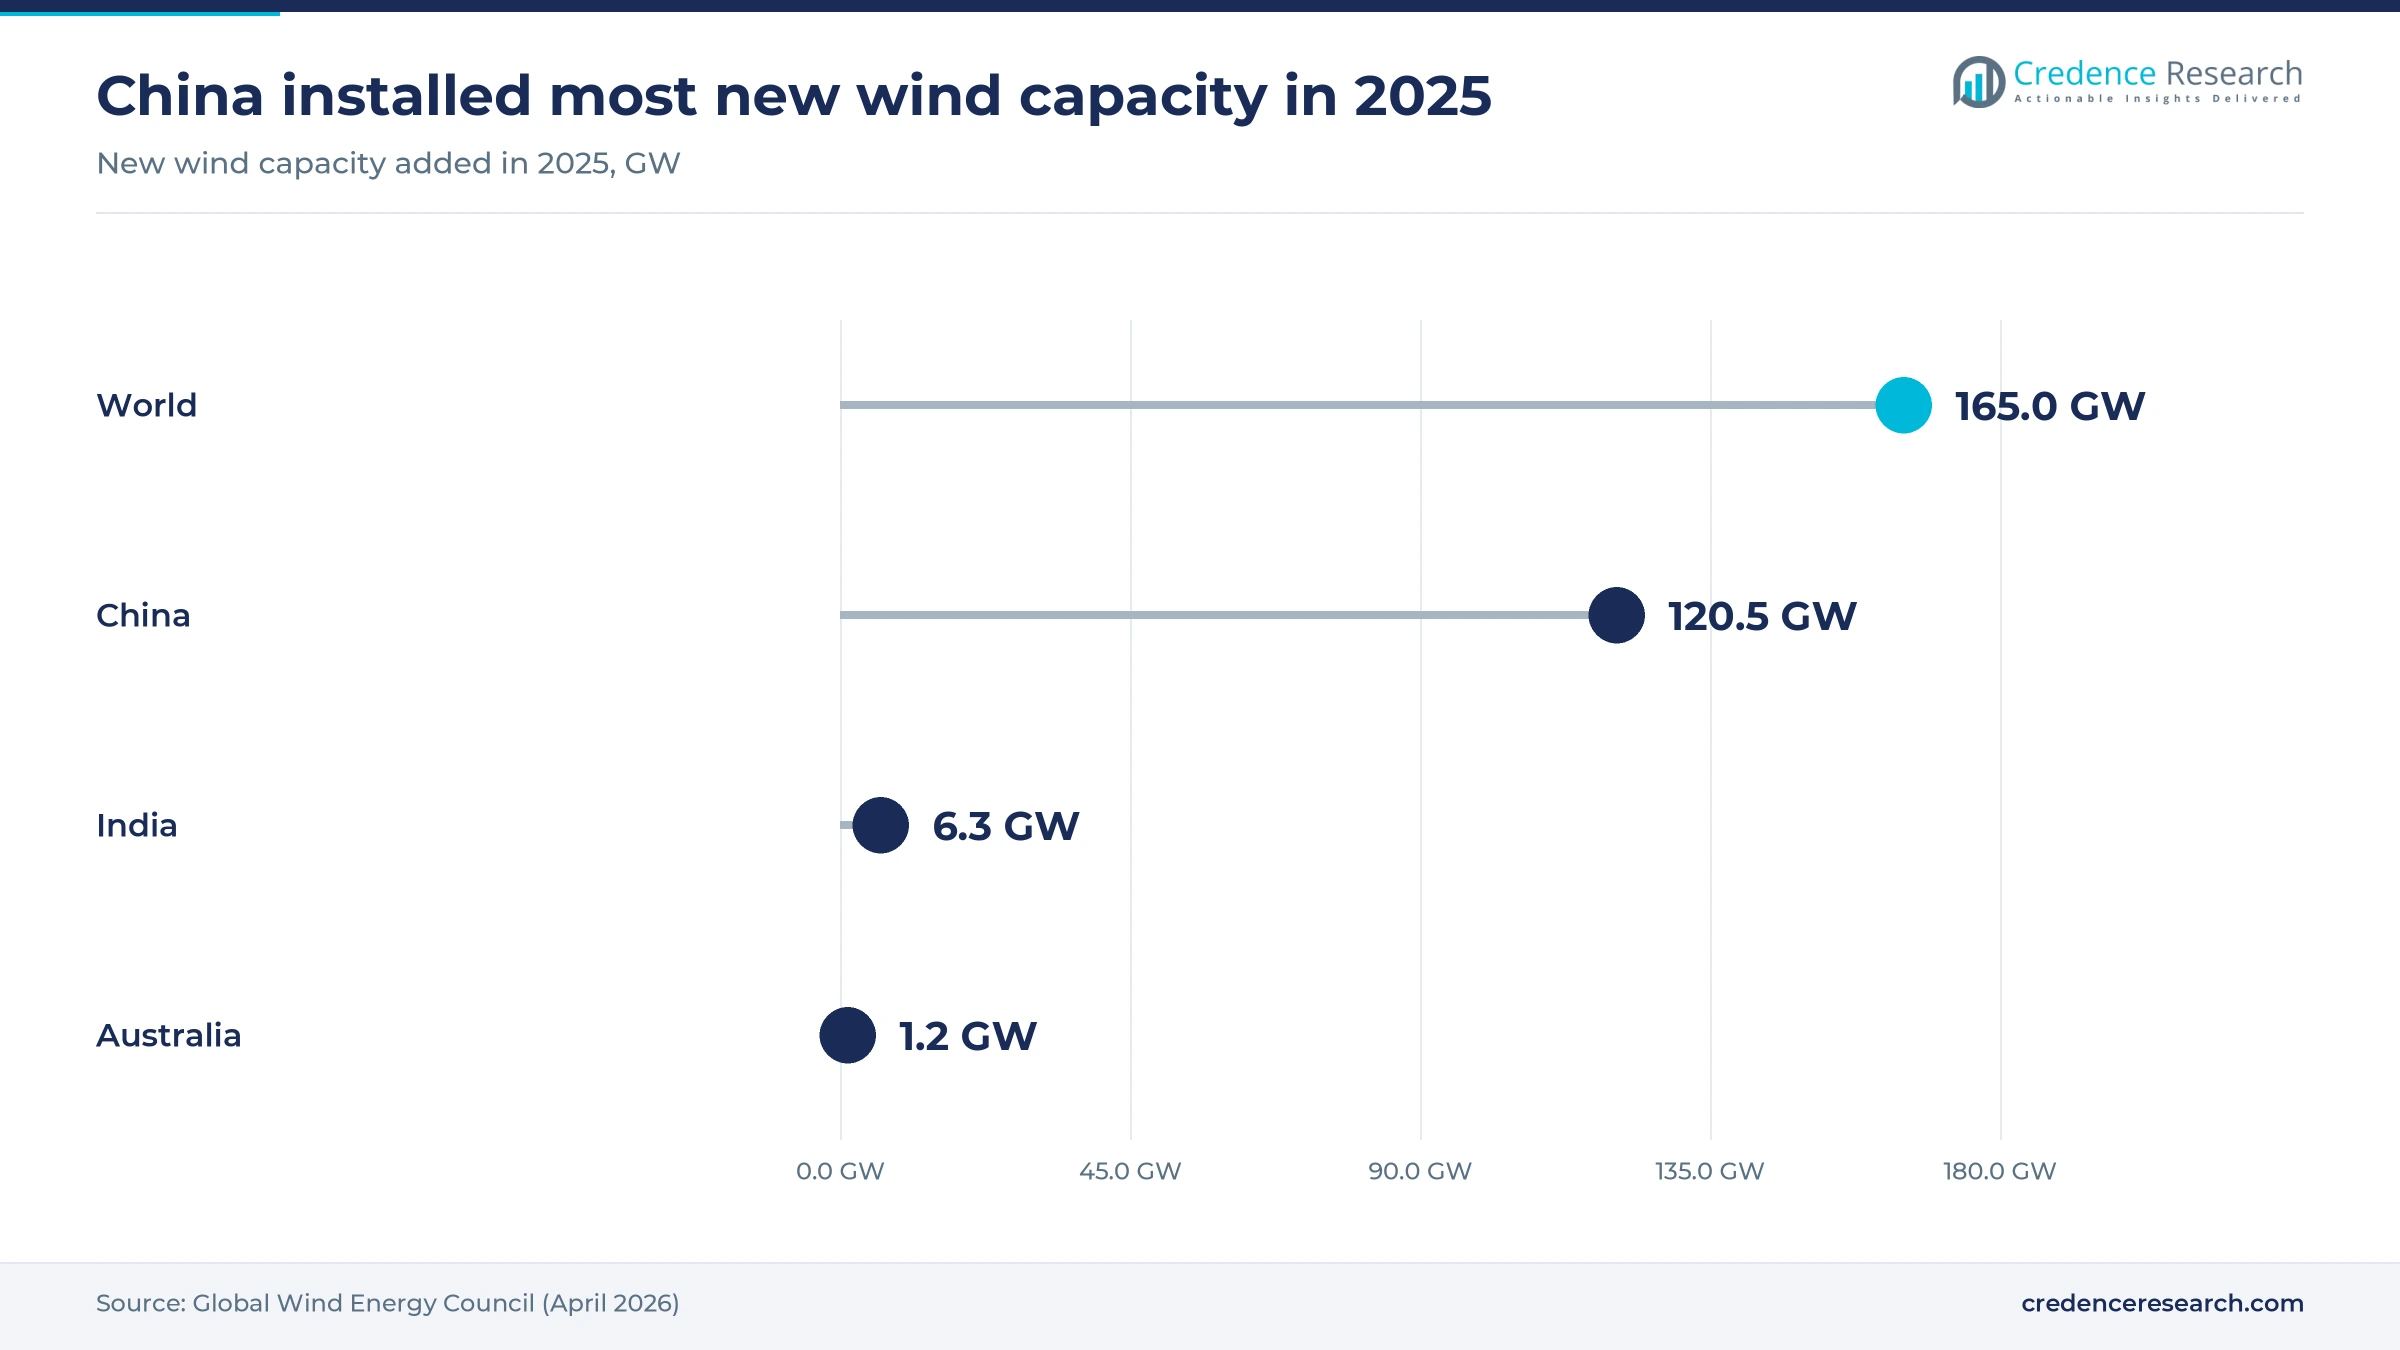
- China added a record 120.5 GW of wind capacity in 2025, according to the Global Wind Energy Council, which sustains demand for long infused blades.
- Zhongfu Shenying commissioned three carbon fiber lines in Lianyungang on June 28, 2026, including a large-tow line aimed at wind, hydrogen storage and vehicles.
Glass reinforcement leads while carbon fiber gains fastest
Glass reinforcement keeps the lead as carbon fiber grows fastest
Based on product type, the market is categorized into glass fiber reinforced polymers, carbon fiber reinforced polymers, natural fiber reinforced polymers and aramid and hybrid reinforced polymers. Glass Fiber Reinforced Polymers led with 76.0% of 2025 value because pipes, tanks, panels, blades and circuit boards consume glass reinforcement in the largest tonnages. Glass grades made up 95% of the 13.5 million tons of composites produced worldwide in 2024, with 51% made in Asia, according to the German reinforced plastics association AVK. Carbon Fiber Reinforced Polymers grow fastest at 12.6% a year, as Chinese carbon fiber demand rose 57.1% to 132,000 tons in 2025, The Beijing News reported in July 2026.
Mobility buys the most while electronics substrates grow fastest
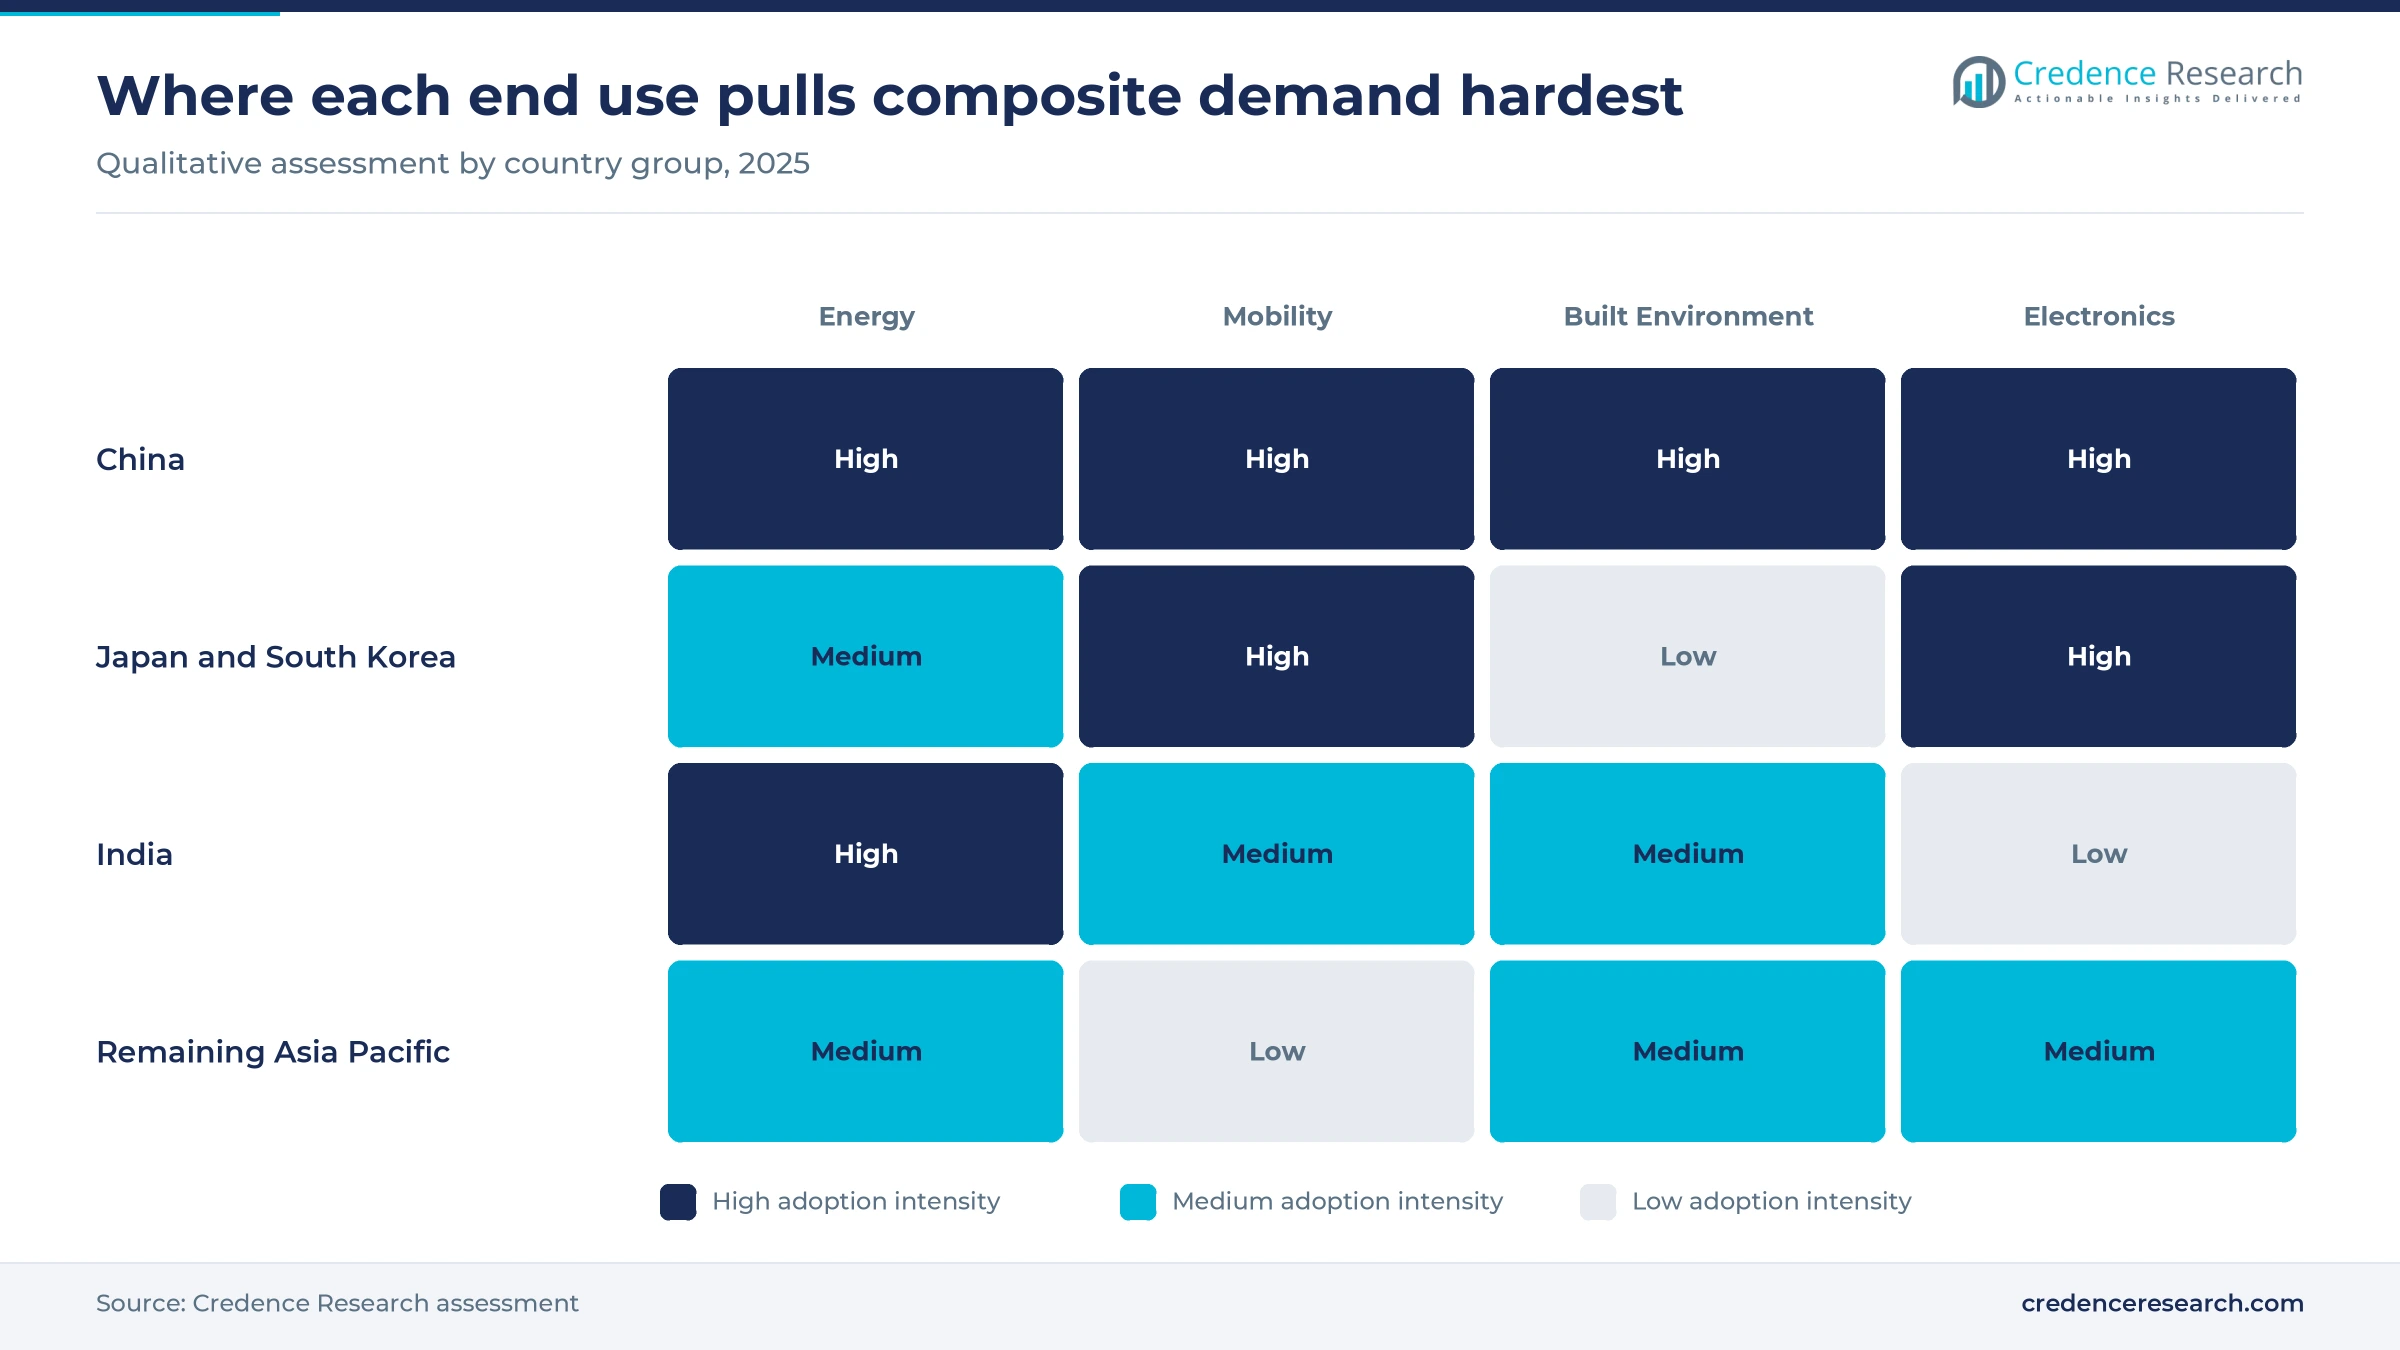
Based on end-use industry, the market is categorized into energy, built environment, mobility and electronics and consumer products. Mobility led with 28.0% of 2025 value because car, bus, rail and aircraft builders buy composites for body panels, battery covers, interiors and airframe parts. Battery packs add enclosures, covers and underbody shields to each electric model, which widens composite use beyond the body panels of conventional cars. Electronics and Consumer Products grows fastest at 11.7% a year, because AI server boards need low-dielectric glass fabric with tighter signal-loss limits than standard laminates. China Jushi opened a Huai'an line in March 2026 that makes 100,000 metric tons of electronic-grade glass fiber a year, China Daily reported.
Closed molds lead while winding and pultrusion grow fastest
Based on technology, the market is categorized into open-mold, closed-mold, continuous and winding, and prepreg and compression processing. Closed-Mold Processing led with 32.0% of 2025 value because wind blades, bus panels and electrical housings are infused or molded in sealed tools that control fiber content and emissions. Continuous and Winding Processing grows fastest at 11.7% a year, because filament winding and pultrusion are the processes behind new hydrogen and CNG cylinders and the carbon spar caps of very long blades. Time Technoplast became the first Indian company to receive final PESO approval for Type IV composite hydrogen cylinders in June 2024, Business Standard reported.
| Segment Group | Leading Sub-segment | Share, 2025 | Fastest-growing Sub-segment | CAGR, 2026–2035 |
|---|---|---|---|---|
| By Product Type | Glass Fiber Reinforced Polymers | 76.0% | Carbon Fiber Reinforced Polymers | 12.6% |
| By End-Use Industry | Mobility | 28.0% | Electronics and Consumer Products | 11.7% |
| By Technology | Closed-Mold Processing | 32.0% | Continuous and Winding Processing | 11.7% |
Fiber grade sets a wide spread in reinforcement prices
Glass reinforcement is priced per metric ton and carbon fiber per kilogram, and the spread between grades is wider than the spread between suppliers. Domestic carbon fiber in China costs more than 20 times as much per kilogram as commodity roving, while electronic yarn sells at more than twice the roving price. Furnace utilization, energy costs and the share of specialty output move glass prices, whereas tow size, modulus and qualification status move carbon prices. Toray's increase for January 2026 shows that Japanese suppliers can still pass costs through on qualified grades. Buyers save most by matching fiber grade to the load case rather than by negotiating unit price alone.
| Reinforcement or grade | Typical price or fee | Basis |
|---|---|---|
| E-glass winding direct roving, China | CNY 3,100 to 3,700 per metric ton | Chinese spot quotes carried by Tiger Brokers, September 2025 |
| Electronic yarn G75, China | CNY 8,300 to 9,200 per metric ton | Chinese spot quotes carried by Tiger Brokers, September 2025 |
| Domestic carbon fiber, China average | About CNY 83.8 per kg at the end of 2024 | Yicai Global, March 2025 |
| TORAYCA carbon fiber, Japan | 10% to 20% list increase from January 2026 | Toray announcement reported by Tiger Brokers, December 2025 |
Request a Free Sample
Fill in your details and we'll send you a free sample report.
- Sample data tables & charts
- Research methodology
Longer blades, lighter vehicles and hydrogen rules lift use
Longer wind blades raise composite mass per turbine
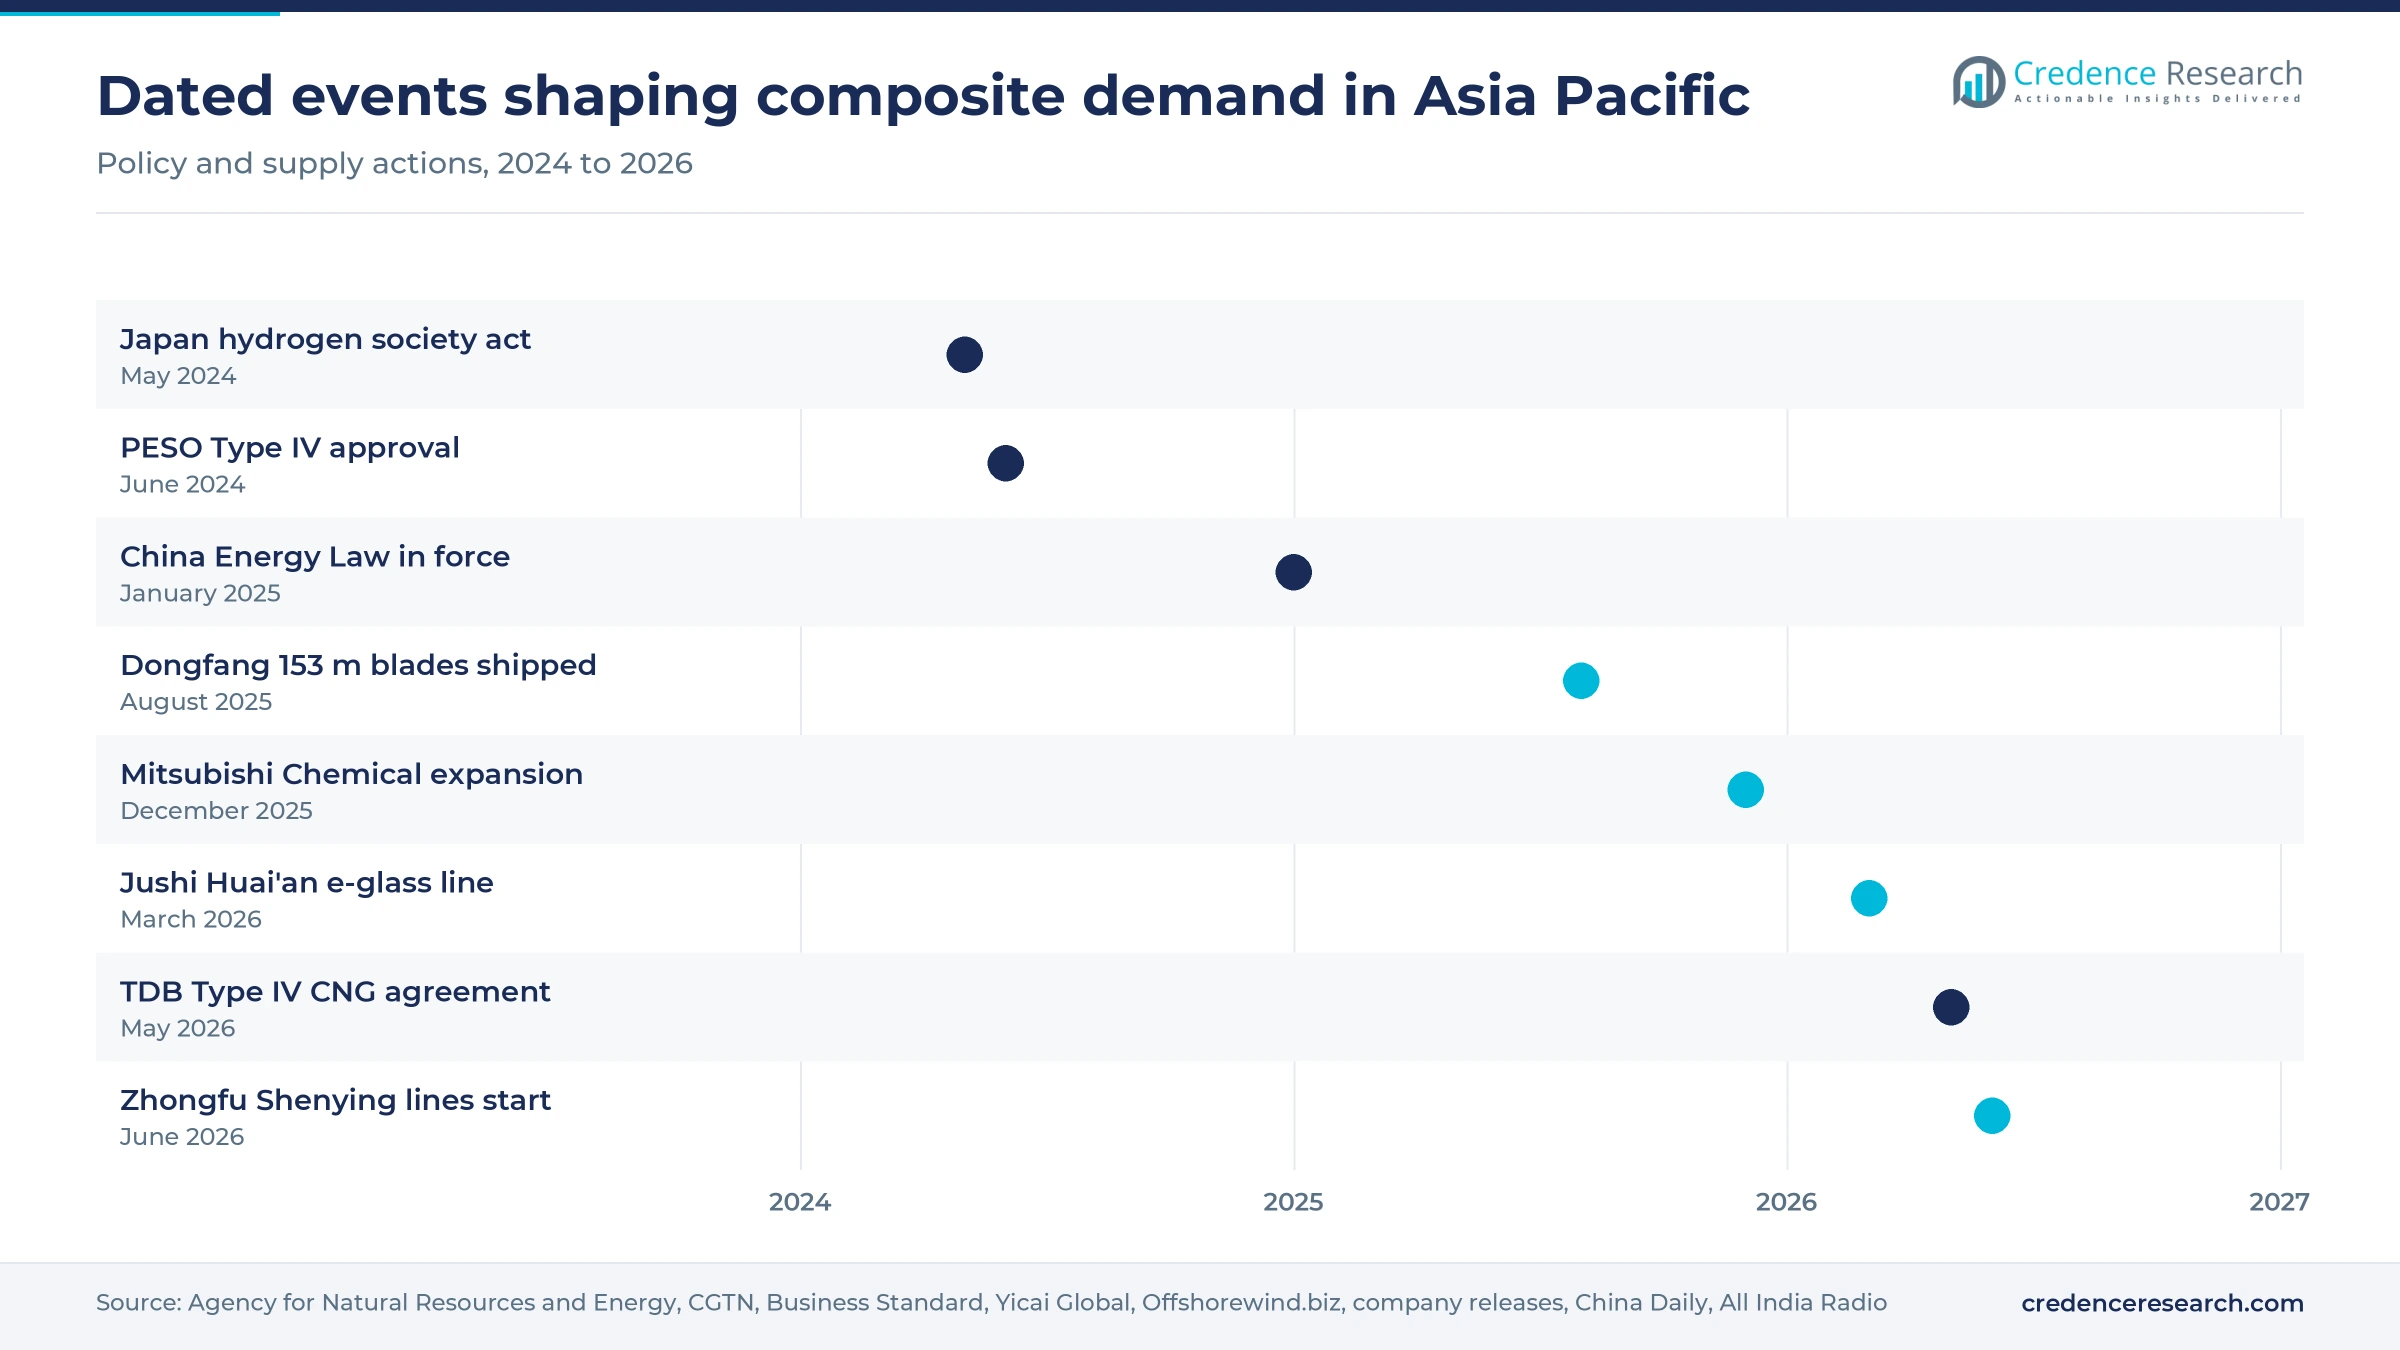
Wind turbine makers are lengthening blades to capture more energy per tower, which raises the mass of glass and carbon reinforcement in every rotor. China added a record 120.5 GW of wind capacity in 2025, according to the Global Wind Energy Council, and it connected 6.6 GW of the 9.3 GW of offshore wind added worldwide. Offshore machines carry the longest shells, so each gigawatt installed at sea uses more reinforcement than onshore capacity. Sany Heavy Energy used large-tow carbon fiber from Sinopec Shanghai Petrochemical in 131-meter onshore rotor blades, the Shanghai government reported in April 2024. Blade suppliers that master spar-cap pultrusion and the infusion of very long shells secure multiyear volume, while molders without long tooling halls lose share.
Electric vehicle redesign moves parts to light composites
Automakers redesigning platforms around batteries are replacing steel housings, covers and panels with composites that cut mass without losing crash or fire performance. China produced 16.524 million new energy vehicles in 2025, according to the National Bureau of Statistics, and these models carry heavy packs that reward weight savings elsewhere. Nantong Fuyuan and Qianwei Technology developed a lower battery enclosure from recycled carbon fiber thermoplastic that weighs over 60% less than steel, CompositesWorld reported on Oct. 14, 2026. Its integrated molding cycle runs under six minutes, which brings composite enclosures closer to stamping economics. Mobility buyers already hold 28.0% of 2025 value, and suppliers with fast-cycle thermoplastic tooling stand to win the next platform awards.
Hydrogen laws create a qualified market for wound tanks
Hydrogen storage depends on filament-wound carbon fiber vessels, and new laws in China and Japan give buyers a legal basis to order them at scale. China's Energy Law took effect on Jan. 1, 2025, and moved hydrogen from the hazardous chemicals category into the national energy system, CGTN reported. Japan enacted its Hydrogen Society Promotion Act in May 2024, offering 15 years of price-gap support to approved low-carbon hydrogen suppliers, according to the Agency for Natural Resources and Energy. A CIMC-Hexagon joint venture in Shijiazhuang unveiled China's first homegrown 20-foot Type IV composite gas container with 38 MPa cylinders in early 2026, Hydrogen Fuel News reported. Makers of Type IV hydrogen tanks gain from these rules, because certified pressure vessels command higher prices than industrial pipe and tank work.
Domestic carbon fiber output lowers cost per kilogram
Large domestic carbon fiber capacity is lowering fiber costs in China, which lets fabricators specify carbon reinforcement in parts that once used glass or metal. Zhongfu Shenying started a 5,000-ton large-tow line in Lianyungang on June 28, 2026, alongside aerospace and high-modulus lines, according to Yicai Global. Domestic producers supplied 113,000 tons of China's carbon fiber demand in 2025, an 85.9% localization rate, The Beijing News reported. The average domestic price settled at CNY 83.8 per kg at the end of 2024, Yicai Global reported in March 2025. Cheaper carbon fiber widens the gap between commodity and aerospace grades, and buyers in wind and pressure vessels capture most of the saving.
Low-dielectric fabric and recyclable resins reshape supply
Glass fiber makers shift furnaces to low-dielectric fabric
Glass fiber producers are shifting furnace capacity toward electronic yarn and low-dielectric fabric to meet the signal-loss limits of AI server boards. Kingboard commissioned a 70,000-ton electronic-grade yarn line in Shaoguan, and China Jushi said in May 2026 it would invest USD 653 million in a further Huai'an line, according to CompositesWorld. Chongqing Polycomp International approved a 36-million-meter high-frequency electronic fabric line on Dec. 29, 2025, with construction scheduled to June 2027. Nippon Electric Glass plans spring 2027 mass production of server-grade glass fiber at Higashi-Omi, Nikkei reported in August 2026. These plans lift value per ton for suppliers to makers of copper-clad laminates, while commodity roving lines lose priority for capital.
Shift toward recyclable resins and low-carbon fiber plants
Producers are shifting toward recyclable matrix chemistry and low-carbon furnaces as automakers and wind developers ask for end-of-life and emissions data. Teijin announced on July 21, 2026, a thermosetting long carbon fiber composite that heals with brief heating and can be remolded or chemically separated, with samples planned for 2028. China Jushi is building a zero-carbon base in Lianshui, Huai'an, for 400,000 tons of reinforced glass fiber a year, powered partly by a 200 MW wind farm, according to JEC Composites. The recycled carbon fiber enclosure described above shows that recovered fiber can already carry structural loads in vehicles. Suppliers that document recycled content and plant emissions gain an edge in export-linked tenders and automaker sourcing reviews.
Opportunity in Indian rail interiors and nose cones
Indian Railways' fleet renewal opens a market for composite interior and front-end suppliers that can meet fire, smoke and weight rules for fast coaches. Kineco delivered its 100th composite nose cone for Vande Bharat Express trains on June 27, 2025, according to The Machinist. CompositesWorld reported in May 2026 that Kineco supplies interior systems for 100 Vande Bharat Sleeper trains, covering panels, sanitation modules and lightweight structures. The company also bought Semvac of Denmark and TRB Lightweight Structures of the U.K., grouping them under Kineco Global Rail. Each sleeper fleet order keeps molding lines busy for several years, so fabricators that pair Indian costs with European rail certification can bid for export coaches as well as domestic work.
Opportunity in Type IV CNG cylinders made in India
The national push to localize lightweight gas cylinders in India opens a supply gap for wound composite vessels in buses, trucks and gas logistics. The Technology Development Board signed an agreement on May 7, 2026, to fund a private facility for indigenously developed Type IV composite CNG cylinders, according to All India Radio. Such cylinders weigh up to 75% less than steel, so city buses and delivery fleets can carry more payload. Toray said in July 2023 that it would lift regular-tow carbon fiber capacity by more than 20% to 35,000 metric tons from 2025, citing pressure vessel demand, CompositesWorld reported. Indian winders that secure local fiber supply can undercut imported cylinders and win state bus and gas distribution tenders.
Weak roving prices and slow qualification limit margins
Weak roving prices squeeze non-integrated glass fiber makers
Commodity glass fiber prices remain low enough to erode margins at furnaces without specialty grades or captive energy. Chinese winding direct roving traded at CNY 3,100 to 3,700 per ton on Sept. 4, 2025, down 4.25% from a year earlier, according to spot price data carried by Tiger Brokers. Four mid-size producers announced 5% to 10% increases that week, yet fiberglass roving makers stay exposed when pipe and panel molders cut orders. Glass furnaces run nonstop for years between rebuilds, so output stays high when prices fall and the surplus lasts.
Feedstock surcharges raise carbon fiber costs for molders
Higher energy and petrochemical costs are pushing up prices for Japanese carbon fiber grades, which hurts fabricators that sold on fixed annual contracts. Toray announced on Dec. 11, 2025, an increase of 10% to 20% for TORAYCA carbon fiber and related products from January 2026, Tiger Brokers reported. In March 2026 Toray added emergency surcharges on carbon fiber composites after naphtha costs jumped with the de facto blockade of the Strait of Hormuz, Chemxplore reported. Sporting goods and industrial molders with thin margins are the most exposed buyers.
Airworthiness approval slows domestic fiber in airliners
Certification rules keep most commercial aircraft carbon fiber imported, which limits the highest-value outlet for new Chinese fiber lines. Carbon fiber composites make up about 11.5% of the C919 airframe weight, while the C929 widebody is expected to exceed 50%, The Beijing News reported in July 2026. Most of that fiber is still imported because validation and airworthiness approval take years. Domestic producers must fund long qualification programs before they can sell into airframes, which delays returns on aerospace-grade capacity.
Thin hydrogen station networks cap passenger tank demand
Slow refueling build-out limits how many fuel cell cars, and the tanks inside them, reach the road in South Korea. The country had about 231 hydrogen refueling stations in 2025, each dispensing about 100 kg a day against roughly 300 kg needed to break even, CleanTechnica reported in November 2025. Operators lose money at that throughput, so new sites depend on subsidies. Tank makers that rely on passenger cars face volatile orders, while buses, trucks and gas containers offer steadier volume.
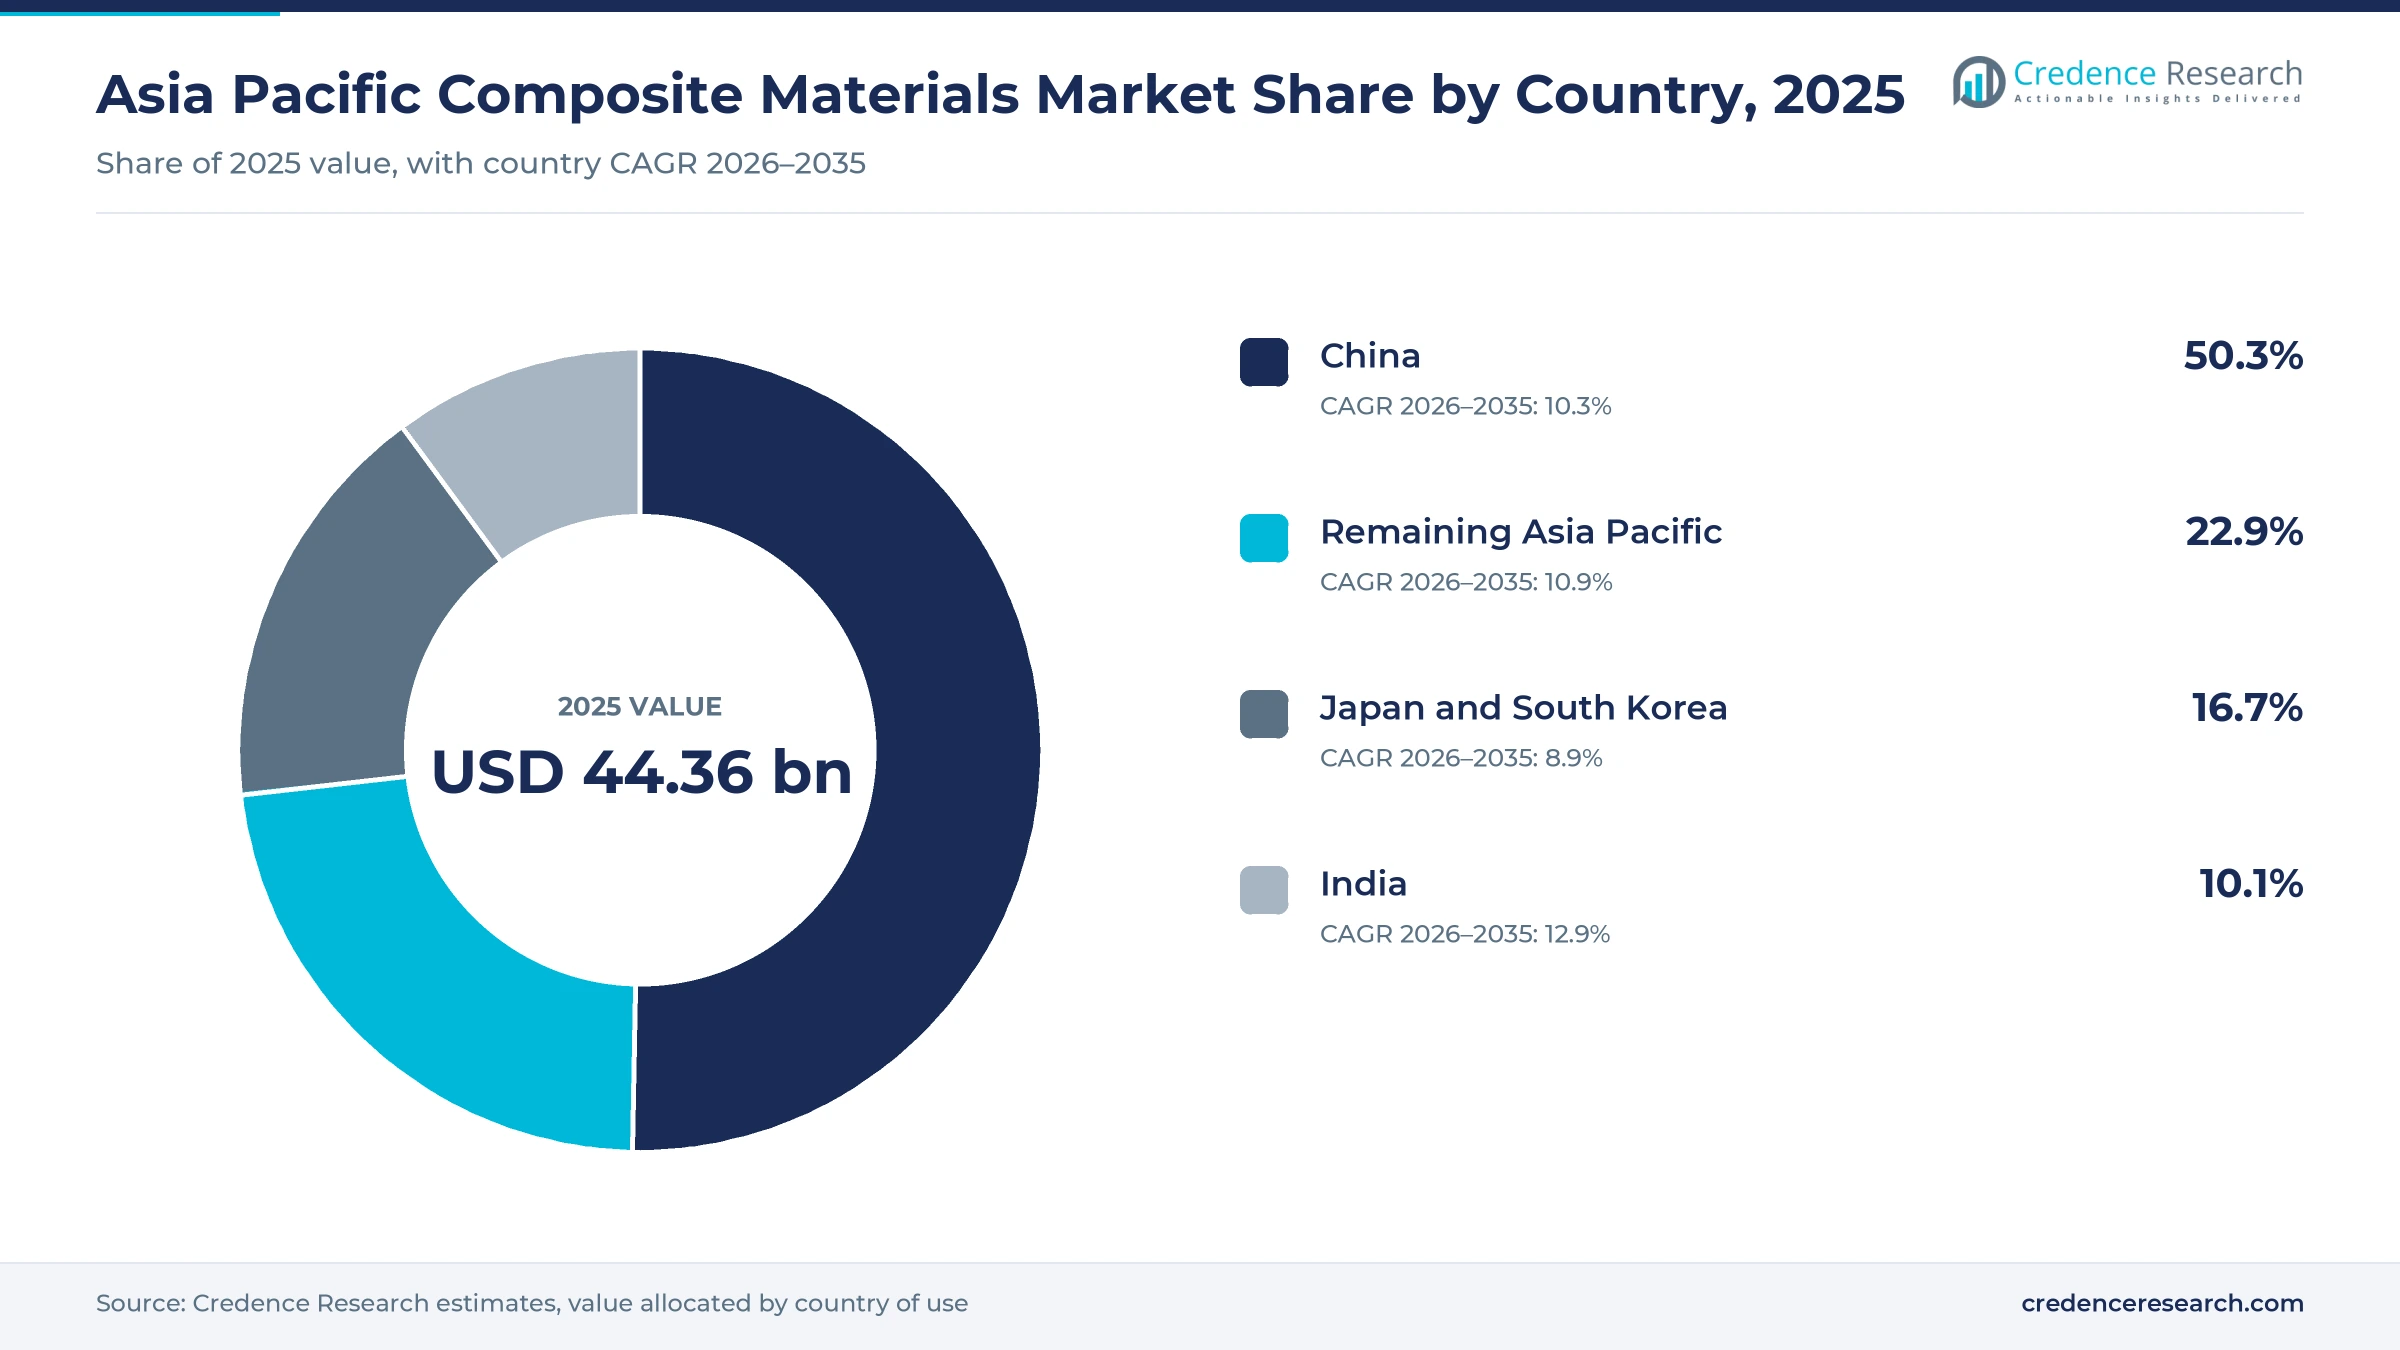
China holds half of value as India grows fastest
| Country | Value, 2025 (USD billion) | Share, 2025 | CAGR, 2026–2035 |
|---|---|---|---|
| China | 22.32 | 50.3% | 10.3% |
| Remaining Asia Pacific | 10.16 | 22.9% | 10.9% |
| Japan and South Korea | 7.41 | 16.7% | 8.9% |
| India | 4.48 | 10.1% | 12.9% |
China leads on fiber furnaces, blade plants and EV output
China held 50.3% of 2025 value and grows at 10.3% a year. Installed wind capacity reached 640.01 GW at the end of 2025, up 22.9%, according to the National Bureau of Statistics, and domestic blade plants sit close to their largest customers. Sinoma's Taishan Fiberglass started a second line in Taiyuan in December 2025, taking the site to 300,000 tons of designed annual output. Furnaces, carbon fiber lines and molders sit within short trucking distance of each other, which gives Chinese buyers lower delivered costs than anywhere else in the region.
Japan and South Korea sell high-grade fiber and resins
Japan and South Korea held 16.7% of 2025 value and grow at 8.9% a year, the slowest pace in the region. Value comes from aerospace, pressure vessel and electronics grades rather than tonnage. Toray signed a plan on May 22, 2024, to raise carbon fiber capacity at Gumi in South Korea from 4,700 to 8,000 tons a year, The Korea Economic Daily reported. Mitsubishi Chemical said in December 2025 that it would roughly double high-end carbon fiber capacity across its Tokai Plant in Aichi and its Sacramento plant in the U.S. by 2027. Mature vehicle and construction volumes cap growth in both countries.
India grows fastest on wind additions and rail renewal
India held 10.1% of 2025 value and is the fastest-growing country at 12.9% a year. The country added a record 6.05 GW of wind capacity in fiscal 2025-26, taking the total above 56 GW, according to the Ministry of New and Renewable Energy. Rail interiors made in Goa and the first PESO-approved Type IV hydrogen cylinders, both noted above, add new composite uses. Growth starts from a smaller base, so local fiber supply and certified molders set how fast demand turns into domestic output.
Taiwan and Australia anchor the rest of the region
The remaining Asia Pacific countries held 22.9% of 2025 value and grow at 10.9% a year. Taiwan Glass plans to invest about NT$2 billion in 2026 to expand low-k and low-CTE glass fabric for AI and high-performance computing boards, CompositesWorld reported. Australia added 1.2 GW of wind capacity in 2025, according to the Global Wind Energy Council, and that fleet sustains blade service and repair work. Southeast Asian demand is spread across pipes, tanks, boats and building panels, and no official series tracks it, so its share rests on Credence Research estimates.
Fiber lines, blade tests and fabric plants in 2025 and 2026
| Development | Status and market relevance |
|---|---|
| In August 2025, Dongfang Electric shipped three 153-meter blades for its 26 MW offshore turbine from Yantai Port to a test base | Testing milestone after static tests in May 2025, not yet a commercial order |
| In December 2025, Chongqing Polycomp International approved a high-frequency electronic fiber fabric line in Changshou District, Chongqing | Approved plan, with construction scheduled from December 2025 to June 2027 |
| In December 2025, Mitsubishi Chemical Group announced a phased expansion of high-end carbon fiber capacity at its Tokai Plant in Japan | Announced investment, with capacity rising in steps through 2027 |
| In March 2026, China Jushi started production at its electronic-grade glass fiber and fabric line in Huai'an, Jiangsu | Completed investment now operating, the largest line of its kind worldwide according to China Daily |
| In June 2026, Zhongfu Shenying commissioned three high-performance carbon fiber lines in Lianyungang as the first phase of a 30,000-ton project | Completed and operating, adding large-tow, T1100 and high-modulus supply |
Large tow, winding and low-dielectric glass change output
- Large-tow carbon fiber with 48,000 or more filaments per bundle lowers cost per kilogram enough for spar caps, pressure vessels and vehicle parts.
- Filament winding over polymer liners produces Type IV cylinders that are far lighter than steel vessels at the same working pressure.
- Low-dielectric glass fabric uses specialty glass chemistry to cut signal loss in server boards and high-frequency circuit laminates.
- Integrated compression and injection molding forms thermoplastic composite parts such as battery enclosures in one press cycle, which removes secondary steps.
Need a Custom Version of This Report?
Tailor the scope, geography, or segments to your exact requirements.
- Custom geography or segment scope
- Direct access to our analyst team
Fiber scale and qualification decide competitive position
Competition among composite materials suppliers sorts them by fiber stage, scale and qualification rather than by brand alone. China Jushi, Sinoma and Chongqing Polycomp International compete on furnace scale and energy cost in glass fiber, and each is moving capacity toward electronic yarn and fabric to escape commodity roving prices. Toray, Teijin and Mitsubishi Chemical defend aerospace, pressure vessel and sporting goods grades through long qualification records, precursor know-how and prepreg ranges, while adding capacity selectively in Japan and South Korea. Zhongfu Shenying competes on domestic supply security and large-tow cost, which suits wind, hydrogen and vehicle buyers that want local sourcing. Nippon Electric Glass is returning to electronic glass fiber after about 20 years away, Nikkei reported. Kineco works one stage lower, converting fiber and resin into certified rail interiors and front ends for Indian and overseas train builders. Buyers weigh qualification status, delivered cost and supply security more heavily than list price.
Integrated fiber majors and qualified specialists split supply
Reinforcement supply is concentrated at the fiber stage and fragmented at the molding stage. A few Chinese groups, led by China Jushi, Sinoma's Taishan Fiberglass and Chongqing Polycomp International, run most regional glass furnaces, and the new Jushi line in Huai'an alone equals about 9% of global electronic-grade capacity, according to China Daily. Toray, Teijin, Mitsubishi Chemical and Zhongfu Shenying lead carbon fiber supply. Molders, winders and pultruders below them are numerous and mostly regional. Entry barriers are highest in furnaces, precursor lines and aerospace qualification, and margins are richest in low-dielectric fabric and aerospace tow rather than commodity roving.
Leading fiber producers and fabricators in the region
| Company | Type | Role in the market |
|---|---|---|
| China Jushi Co., Ltd. | Integrated glass fiber producer | Supplies wind, pipe and electronic-grade glass fiber from Zhejiang and Jiangsu plants |
| Toray Industries, Inc. | Carbon fiber and prepreg leader | Sells TORAYCA fiber and is expanding carbon fiber output at Gumi in South Korea |
| Sinoma Science & Technology Co., Ltd. | Glass fiber and blade maker | Runs Taishan Fiberglass furnaces and a wind blade unit |
| Chongqing Polycomp International Corporation | Glass fiber producer | Plans a high-frequency electronic fiber fabric line in Changshou, Chongqing |
| Teijin Limited | Carbon fiber producer | Develops recyclable, self-healing thermoset carbon fiber composites |
| Mitsubishi Chemical Group Corporation | Carbon fiber and prepreg producer | Expanding high-end carbon fiber at the Tokai Plant in Aichi |
| Zhongfu Shenying Carbon Fiber Co., Ltd. | Domestic carbon fiber producer | Runs Xining and Lianyungang lines for large-tow and aerospace grades |
| Nippon Electric Glass Co., Ltd. | Glass fiber producer | Plans server-grade glass fiber output at Higashi-Omi in Shiga |
| Kineco Limited | Composite fabricator | Makes Vande Bharat nose cones and rail interiors in Goa |
Credence Research view on regional composite demand
Credence Research's view is that demand for composite materials in the region is moving from tonnage-led growth toward grade-led growth. Wind blades and vehicles still absorb most volume, but low-dielectric glass fabric, large-tow carbon fiber and certified pressure vessels now earn the margins. China will keep its scale advantage, while Japan and South Korea hold value through qualification depth. India offers the fastest expansion if local fiber supply and certified molders keep pace with rail and cylinder programs. Suppliers tied to commodity roving face the weakest returns through 2030, even as their volumes keep rising.
Tonnage, fiber prices and project data drive the estimate
The report uses 2025 as the base year and forecasts value to 2035. Market values come from the Credence Research model, which links composite materials tonnage to wind installations, vehicle output, electronics production and construction activity, then applies prices by fiber and process. Country, product, end-use and technology splits are Credence Research estimates, because official statistics do not separate composite consumption by country. Sources include national statistics offices, energy ministries, industry associations, company releases and exchange filings, government notices and trade press. No interviews or surveys were used to prepare this edition of the report.
Blades, vehicles and electronics carry demand to 2035
Through 2035, regional demand for composite materials will rest on wind blades, lighter vehicles and electronics substrates, with hydrogen vessels adding a fourth source from a smaller base. China will remain the production center, although Indian wind and rail programs should narrow the gap in growth rates. Carbon fiber will gain share as domestic large-tow supply keeps prices near the 2024 floor. Glass fiber producers will keep moving furnaces toward electronic and high-modulus grades. Feedstock shocks and slow hydrogen station rollout remain the main risks to the base case.
Wind build rates and fiber prices set the 2035 range
The range of outcomes depends mainly on whether Chinese wind installations hold near 2025 levels and whether carbon fiber prices stay low enough to widen its use in vehicles and tanks. A sharp slowdown in wind auctions or a long naphtha shock would lower growth. Faster hydrogen fleet uptake, stronger server demand for low-dielectric fabric and Indian localization of cylinders would lift it. Glass fiber oversupply affects margins more than volumes in every case.
| Scenario | CAGR, 2026–2035 | Value, 2035 | What has to hold |
|---|---|---|---|
| Downside | 8.7% | USD 104.02 billion | Chinese wind additions fall back and feedstock surcharges persist through 2027 |
| Base | 10.49% | USD 120.63 billion | Wind, vehicle and electronics demand follow recent rates across the region |
| Upside | 11.9% | USD 135.06 billion | Hydrogen fleets scale faster and AI server boards absorb more specialty glass fabric |
Frequently Asked Questions
How big is the Asia Pacific composite materials market?
Which country leads regional composite demand?
Which country grows fastest?
Which product type leads the market?
Why do carbon fiber composites grow fastest?
How much do composite reinforcements cost?
What holds the market back?
Who are the main companies in this market?
Table of Content
Chapter 1 Market Segmentation
- 1.1 Segmentation Framework
- 1.1.1 Product and Service Classification
- 1.1.2 Application and End-Use Classification
- 1.1.3 Technology and Solution Classification
- 1.1.4 Customer and Distribution Channel Classification
- 1.1.5 Geographic Segmentation
- 1.1.6 Market Segment Definitions and Boundaries
- 1.2 By Product Type
- 1.2.1 Glass Fiber Reinforced Polymers
- 1.2.2 Carbon Fiber Reinforced Polymers
- 1.2.3 Natural Fiber Reinforced Polymers
- 1.2.4 Aramid and Hybrid Reinforced Polymers
- 1.3 By End-Use Industry
- 1.3.1 Mobility
- 1.3.2 Built Environment
- 1.3.3 Energy
- 1.3.4 Electronics and Consumer Products
- 1.4 By Technology
- 1.4.1 Closed-Mold Processing
- 1.4.2 Continuous and Winding Processing
- 1.4.3 Open-Mold Processing
- 1.4.4 Prepreg and Compression Processing
- 1.5 By Country
- 1.5.1 China
- 1.5.2 Japan and South Korea
- 1.5.3 India
- 1.5.4 Remaining Asia Pacific
Chapter 2 Introduction
- 2.1 Report Objectives and Scope
- 2.2 Product Definition and Industry Terminology
- 2.3 Market Inclusions and Exclusions
- 2.4 Research Process
- 2.4.1 Primary Research and Expert Interviews
- 2.4.2 Secondary Research and Source Review
- 2.4.3 Top-Down and Bottom-Up Estimation
- 2.4.4 Data Triangulation and Verification
- 2.5 Market Size Measurement Basis
- 2.5.1 2025: USD 44.36 billion → 2035: USD 120.63 billion
- 2.6 Historical and Forecast Reference Periods
- 2.6.1 Historical Period: 2018-2025
- 2.6.2 Base Year: 2025
- 2.6.3 Forecast Period: 2025-2035
- 2.7 Research Assumptions and Limitations
Chapter 3 Executive Summary
- 3.1 Market Snapshot and Key Findings
- 3.2 Base-Year Market Size, 2025
- 3.3 Forecast Market Size, 2035
- 3.4 Revenue and Volume Growth Outlook
- 3.5 Key Demand and Supply Indicators
- 3.6 Leading Market Segments
- 3.7 Fastest-Growing Market Opportunities
- 3.8 Regional Performance Highlights
- 3.9 Technology and Industry Transformation
- 3.10 Competitive Landscape Summary
- 3.11 Analyst View and Strategic Implications
Chapter 4 Asia Pacific Composite Materials Market Trends and Developments
- 4.1 Historical Industry Development, 2018-2025
- 4.2 Recent Market Trends and Developments
- 4.3 Demand and Customer Behavior Trends
- 4.4 Technology and Product Innovation
- 4.5 Artificial Intelligence, Automation and Digitalization
- 4.6 Local Manufacturing and Supply Chain Realignment
- 4.7 Industry Partnerships, Mergers and Acquisitions
- 4.8 Sustainability and Circular Economy Developments
- 4.9 Government and Private Sector Investment Trends
- 4.10 Emerging Business Models and Commercialization
- 4.11 Industry Developments and Announcements
Chapter 5 Asia Pacific Composite Materials Market Production, Supply and Demand Analysis
- 5.1 Demand Trend and Consumption Analysis, 2018-2025
- 5.2 Demand Forecast, 2025-2035
- 5.3 Production and Output Trend, 2018-2025
- 5.4 Production and Output Forecast, 2025-2035
- 5.5 Installed Capacity and Capacity Utilization
- 5.6 Company-Wise Production Plants and Statistics
- 5.6.1 Installed Production Capacity
- 5.6.2 Actual Production
- 5.6.3 Planned Capacity and Expansion Targets
- 5.7 Supply Chain Structure and Procurement Trends
- 5.8 Supply-Demand Gap and Bottlenecks
- 5.9 Import Dependence and Sourcing Structure
- 5.10 Contract Manufacturing and Outsourcing
- 5.11 Regional Supply and Demand Concentration
Chapter 6 Asia Pacific Composite Materials Market Pricing Analysis
- 6.1 Pricing Structure and Measurement
- 6.2 Historical Pricing Trends, 2018-2025
- 6.3 Pricing Outlook, 2025-2035
- 6.4 Average Selling Price and Unit Economics
- 6.5 Pricing by Product and Market Segment
- 6.6 Geographic Pricing Differences
- 6.7 Key Input, Energy, Labor and Logistics Costs
- 6.8 Contract Pricing and Purchasing Models
- 6.9 Pricing Sensitivity and Competitive Positioning
- 6.10 Price, Margin and Profitability Implications
Chapter 7 Asia Pacific Composite Materials Market Dynamics
- 7.1 Market Growth Drivers
- 7.1.1 Demand-Side Drivers
- 7.1.2 Technology and Innovation Drivers
- 7.1.3 Infrastructure and Investment Drivers
- 7.1.4 Regulatory and Policy Drivers
- 7.2 Market Restraints
- 7.2.1 Cost and Affordability Constraints
- 7.2.2 Technology and Adoption Barriers
- 7.2.3 Supply Chain and Operational Constraints
- 7.3 Market Challenges
- 7.3.1 Competitive Pressure and Margin Erosion
- 7.3.2 Skills, Infrastructure and Implementation Gaps
- 7.4 Emerging Market Opportunities
- 7.5 Market Dynamics Impact and Time-Horizon Assessment
Chapter 8 Asia Pacific Composite Materials Value Chain Analysis
- 8.1 Industry Value Chain Overview
- 8.2 Upstream Suppliers and Critical Inputs
- 8.3 Technology and Component Providers
- 8.4 Manufacturing or Service Delivery
- 8.5 Distribution, Channel Partners and Integrators
- 8.6 Downstream Applications and End Users
- 8.7 Value Addition and Profit Pools
- 8.8 Vertical Integration and Outsourcing
- 8.9 Supplier Concentration and Risk
- 8.10 Supply Chain Localization and Resilience
Chapter 9 Asia Pacific Composite Materials Market Regulations and Policies
- 9.1 Relevant Laws, Standards and Compliance Frameworks
- 9.2 Product, Service, Safety and Quality Requirements
- 9.3 Government Policies, Incentives and Subsidies
- 9.4 Imports, Exports and Trade Barriers
- 9.5 Public Procurement and Local Content Requirements
- 9.6 Environmental and Sustainability Compliance
- 9.7 Upcoming Policy Changes and Market Implications
Chapter 10 Asia Pacific Composite Materials Market Hotspots and Opportunities
- 10.1 Market Opportunity Mapping and Growth Hotspots
- 10.2 High-Growth Applications and Customer Groups
- 10.3 Underserved Markets and White-Space Opportunities
- 10.4 Emerging Technology and Product Opportunities
- 10.5 New Capacity and Investment Hotspots
- 10.6 Market Entry and Expansion Opportunities
- 10.7 Distribution and Partnership Opportunities
- 10.8 Near-Term and Long-Term Commercial Potential
- 10.9 Opportunity Attractiveness and Execution Risks
Chapter 11 Asia Pacific Composite Materials Market Outlook, 2025-2035
- 11.1 Market Size and Analysis
- 11.1.1 Revenue (Market Measurement: 2025: USD 44.36 billion → 2035: USD 120.63 billion)
- 11.1.2 Market Volume and Quantity Sold
- 11.1.3 Historical Market Size, 2018-2025
- 11.1.4 Base-Year Market Size, 2025
- 11.2 Market Forecast, 2025-2035
- 11.2.1 Revenue Forecast to 2035
- 11.2.2 Volume Forecast to 2035
- 11.2.3 CAGR and Year-on-Year Growth
- 11.2.4 Incremental Revenue Opportunity
- 11.3 Forecast Assumptions and Scenario Analysis
- 11.3.1 Base-Case Forecast
- 11.3.2 Optimistic and Conservative Scenarios
- 11.3.3 Technology, Pricing and Policy Sensitivities
- 11.4 Market Attractiveness and Growth Outlook
Chapter 12 Asia Pacific Composite Materials Market Segmentation and Outlook
- 12.1 Segmentation Summary and Market Shares, 2025
- 12.2 Largest and Fastest-Growing Segments
- 12.3 By Product Type - Market Size and Forecast, 2025-2035
- 12.3.1 Segment Definition and Scope
- 12.3.2 Historical Market Size, 2018-2025
- 12.3.3 Revenue Forecast, 2025-2035
- 12.3.4 Volume Forecast, 2025-2035
- 12.3.5 Base-Year Market Share, 2025
- 12.3.6 Segment CAGR and Growth Drivers
- 12.3.7 Subsegment Market Size and Forecast
- 12.3.7.1 Glass Fiber Reinforced Polymers
- 12.3.7.2 Carbon Fiber Reinforced Polymers
- 12.3.7.3 Natural Fiber Reinforced Polymers
- 12.3.7.4 Aramid and Hybrid Reinforced Polymers
- 12.3.8 Subsegment Pricing and Adoption Trends
- 12.3.9 Leading Suppliers and Competition
- 12.3.10 Regional Demand and Opportunities
- 12.4 By End-Use Industry - Market Size and Forecast, 2025-2035
- 12.4.1 Segment Definition and Scope
- 12.4.2 Historical Market Size, 2018-2025
- 12.4.3 Revenue Forecast, 2025-2035
- 12.4.4 Volume Forecast, 2025-2035
- 12.4.5 Base-Year Market Share, 2025
- 12.4.6 Segment CAGR and Growth Drivers
- 12.4.7 Subsegment Market Size and Forecast
- 12.4.7.1 Mobility
- 12.4.7.2 Built Environment
- 12.4.7.3 Energy
- 12.4.7.4 Electronics and Consumer Products
- 12.4.8 Subsegment Pricing and Adoption Trends
- 12.4.9 Leading Suppliers and Competition
- 12.4.10 Regional Demand and Opportunities
- 12.5 By Technology - Market Size and Forecast, 2025-2035
- 12.5.1 Segment Definition and Scope
- 12.5.2 Historical Market Size, 2018-2025
- 12.5.3 Revenue Forecast, 2025-2035
- 12.5.4 Volume Forecast, 2025-2035
- 12.5.5 Base-Year Market Share, 2025
- 12.5.6 Segment CAGR and Growth Drivers
- 12.5.7 Subsegment Market Size and Forecast
- 12.5.7.1 Closed-Mold Processing
- 12.5.7.2 Continuous and Winding Processing
- 12.5.7.3 Open-Mold Processing
- 12.5.7.4 Prepreg and Compression Processing
- 12.5.8 Subsegment Pricing and Adoption Trends
- 12.5.9 Leading Suppliers and Competition
- 12.5.10 Regional Demand and Opportunities
- 12.6 By Country - Market Size and Forecast, 2025-2035
- 12.6.1 Segment Definition and Scope
- 12.6.2 Historical Market Size, 2018-2025
- 12.6.3 Revenue Forecast, 2025-2035
- 12.6.4 Volume Forecast, 2025-2035
- 12.6.5 Base-Year Market Share, 2025
- 12.6.6 Segment CAGR and Growth Drivers
- 12.6.7 Subsegment Market Size and Forecast
- 12.6.7.1 China
- 12.6.7.2 Japan and South Korea
- 12.6.7.3 India
- 12.6.7.4 Remaining Asia Pacific
- 12.6.8 Subsegment Pricing and Adoption Trends
- 12.6.9 Leading Suppliers and Competition
- 12.6.10 Regional Demand and Opportunities
- 12.7 Segment Growth Comparison
- 12.8 Segment Attractiveness and Priority Matrix
Chapter 13 Asia Pacific Composite Materials End-Use and Application Market Outlook
- 13.1 End-Use Industry and Customer Demand Structure
- 13.2 Leading Applications and Customer Groups
- 13.3 End-Use Market Size, Share and Forecast
- 13.4 Major End-Use Industry Deep Dives
- 13.4.1 Customer Requirements and Use Cases
- 13.4.2 Demand and Replacement Cycles
- 13.4.3 Technical and Regulatory Considerations
- 13.4.4 Purchasing and Procurement Models
- 13.4.5 Leading Vendors and Distribution Channels
- 13.4.6 Forecast and Commercial Opportunities
- 13.5 Emerging Applications and Cross-Segment Demand
- 13.6 End-Use Industry Investment Priorities
Chapter 14 Asia Pacific Composite Materials Geographic Market Outlook, 2025-2035
- 14.1 Regional Market Size and Country-Level Shares, 2025
- 14.2 Country Market Size Comparison, 2025
- 14.3 Country Market Forecasts, 2025-2035
- 14.4 Subregional Industrial and Demand Clusters
- 14.5 Intra-Regional Pricing and Cost Differences
- 14.6 Cross-Border Trade and Supply Networks
- 14.7 Regional Supply and Demand Balances
- 14.8 Country Opportunity Comparison and Prioritization
Note: Every listed country is covered on the structure shown under the first country.
Chapter 15 Asia Pacific Composite Materials Technology, Innovation and Sustainability Outlook
- 15.1 Technology Landscape and Maturity
- 15.2 Product, Process and Service Innovation
- 15.3 AI, Automation and Digital Tools in the Industry
- 15.4 Technology Adoption and Performance Benchmarking
- 15.5 Innovation Pipeline and R&D Investment
- 15.6 Patent and Intellectual Property Trends
- 15.7 Energy Efficiency and Resource Management
- 15.8 Sustainability, Recycling and Circularity
- 15.9 Technology Roadmap, 2025-2035
- 15.10 Risks of Obsolescence and Technology Substitution
Chapter 16 Asia Pacific Composite Materials Market Key Strategic Imperatives
- 16.1 Growth and Market Entry Priorities
- 16.2 High-Return Products and Segments
- 16.3 Pricing, Profitability and Cost Optimization
- 16.4 Technology Investment and Product Differentiation
- 16.5 Supply Chain Localization and Resilience
- 16.6 Distribution and Customer Acquisition
- 16.7 Partnership, Acquisition and Capacity Strategy
- 16.8 Regional Expansion Priorities
- 16.9 Short-, Medium- and Long-Term Actions
Chapter 17 Competition Outlook
- 17.1 Industry Competition Characteristics
- 17.2 Market Structure and Concentration
- 17.3 Market Share and Competitive Positioning, 2025
- 17.4 Company-Wise Revenue and Product Benchmarking
- 17.5 Production and Service Capacity Benchmarking
- 17.6 Technology, Pricing and Differentiation
- 17.7 Regional Footprint and Distribution Strength
- 17.8 Mergers, Acquisitions and Strategic Alliances
- 17.9 New Entrants and Competitive Threats
- 17.10 Porter's Five Forces and Industry Attractiveness
- 17.11 Competitive Outlook, 2025-2035
Chapter 18 Company Profiles
- 18.1 Company Coverage and Selection Criteria
- 18.2 China Jushi Co., Ltd.
- 18.2.1 Business Description
- 18.2.2 Company Ownership and Geographic Presence
- 18.2.3 Product and Service Portfolio
- 18.2.4 Manufacturing and Operating Footprint
- 18.2.5 Production Capacity and Expansion Plans
- 18.2.6 Financial Performance and Investment
- 18.2.7 Market Share and Competitive Position
- 18.2.8 Technology and Innovation Capabilities
- 18.2.9 Strategic Alliances or Partnerships
- 18.2.10 Recent Developments
- 18.2.11 Growth Strategy and Outlook
- 18.3 Toray Industries, Inc.
- 18.4 Sinoma Science & Technology Co., Ltd.
- 18.5 Chongqing Polycomp International Corporation
- 18.6 Teijin Limited
- 18.7 Mitsubishi Chemical Group Corporation
- 18.8 Zhongfu Shenying Carbon Fiber Co., Ltd.
- 18.9 Jiangsu Hengshen Co., Ltd.
- 18.10 Nippon Electric Glass Co., Ltd.
- 18.11 Kineco Limited
- 18.12 Other Relevant Market Participants
Note: Every listed company is profiled on the structure shown under the first company. The company list is preliminary and may change based on research findings, market developments, data availability and client requirements.
Chapter 19 Disclaimer
- 19.1 Research and Forecast Disclaimer
- 19.2 Data Source and Estimation Limitations
Note: The depth of individual sections depends on data availability for this market. Volume, capacity, trade and other unit-based metrics are included where applicable.

