
Java mills supply garment makers at home and abroad
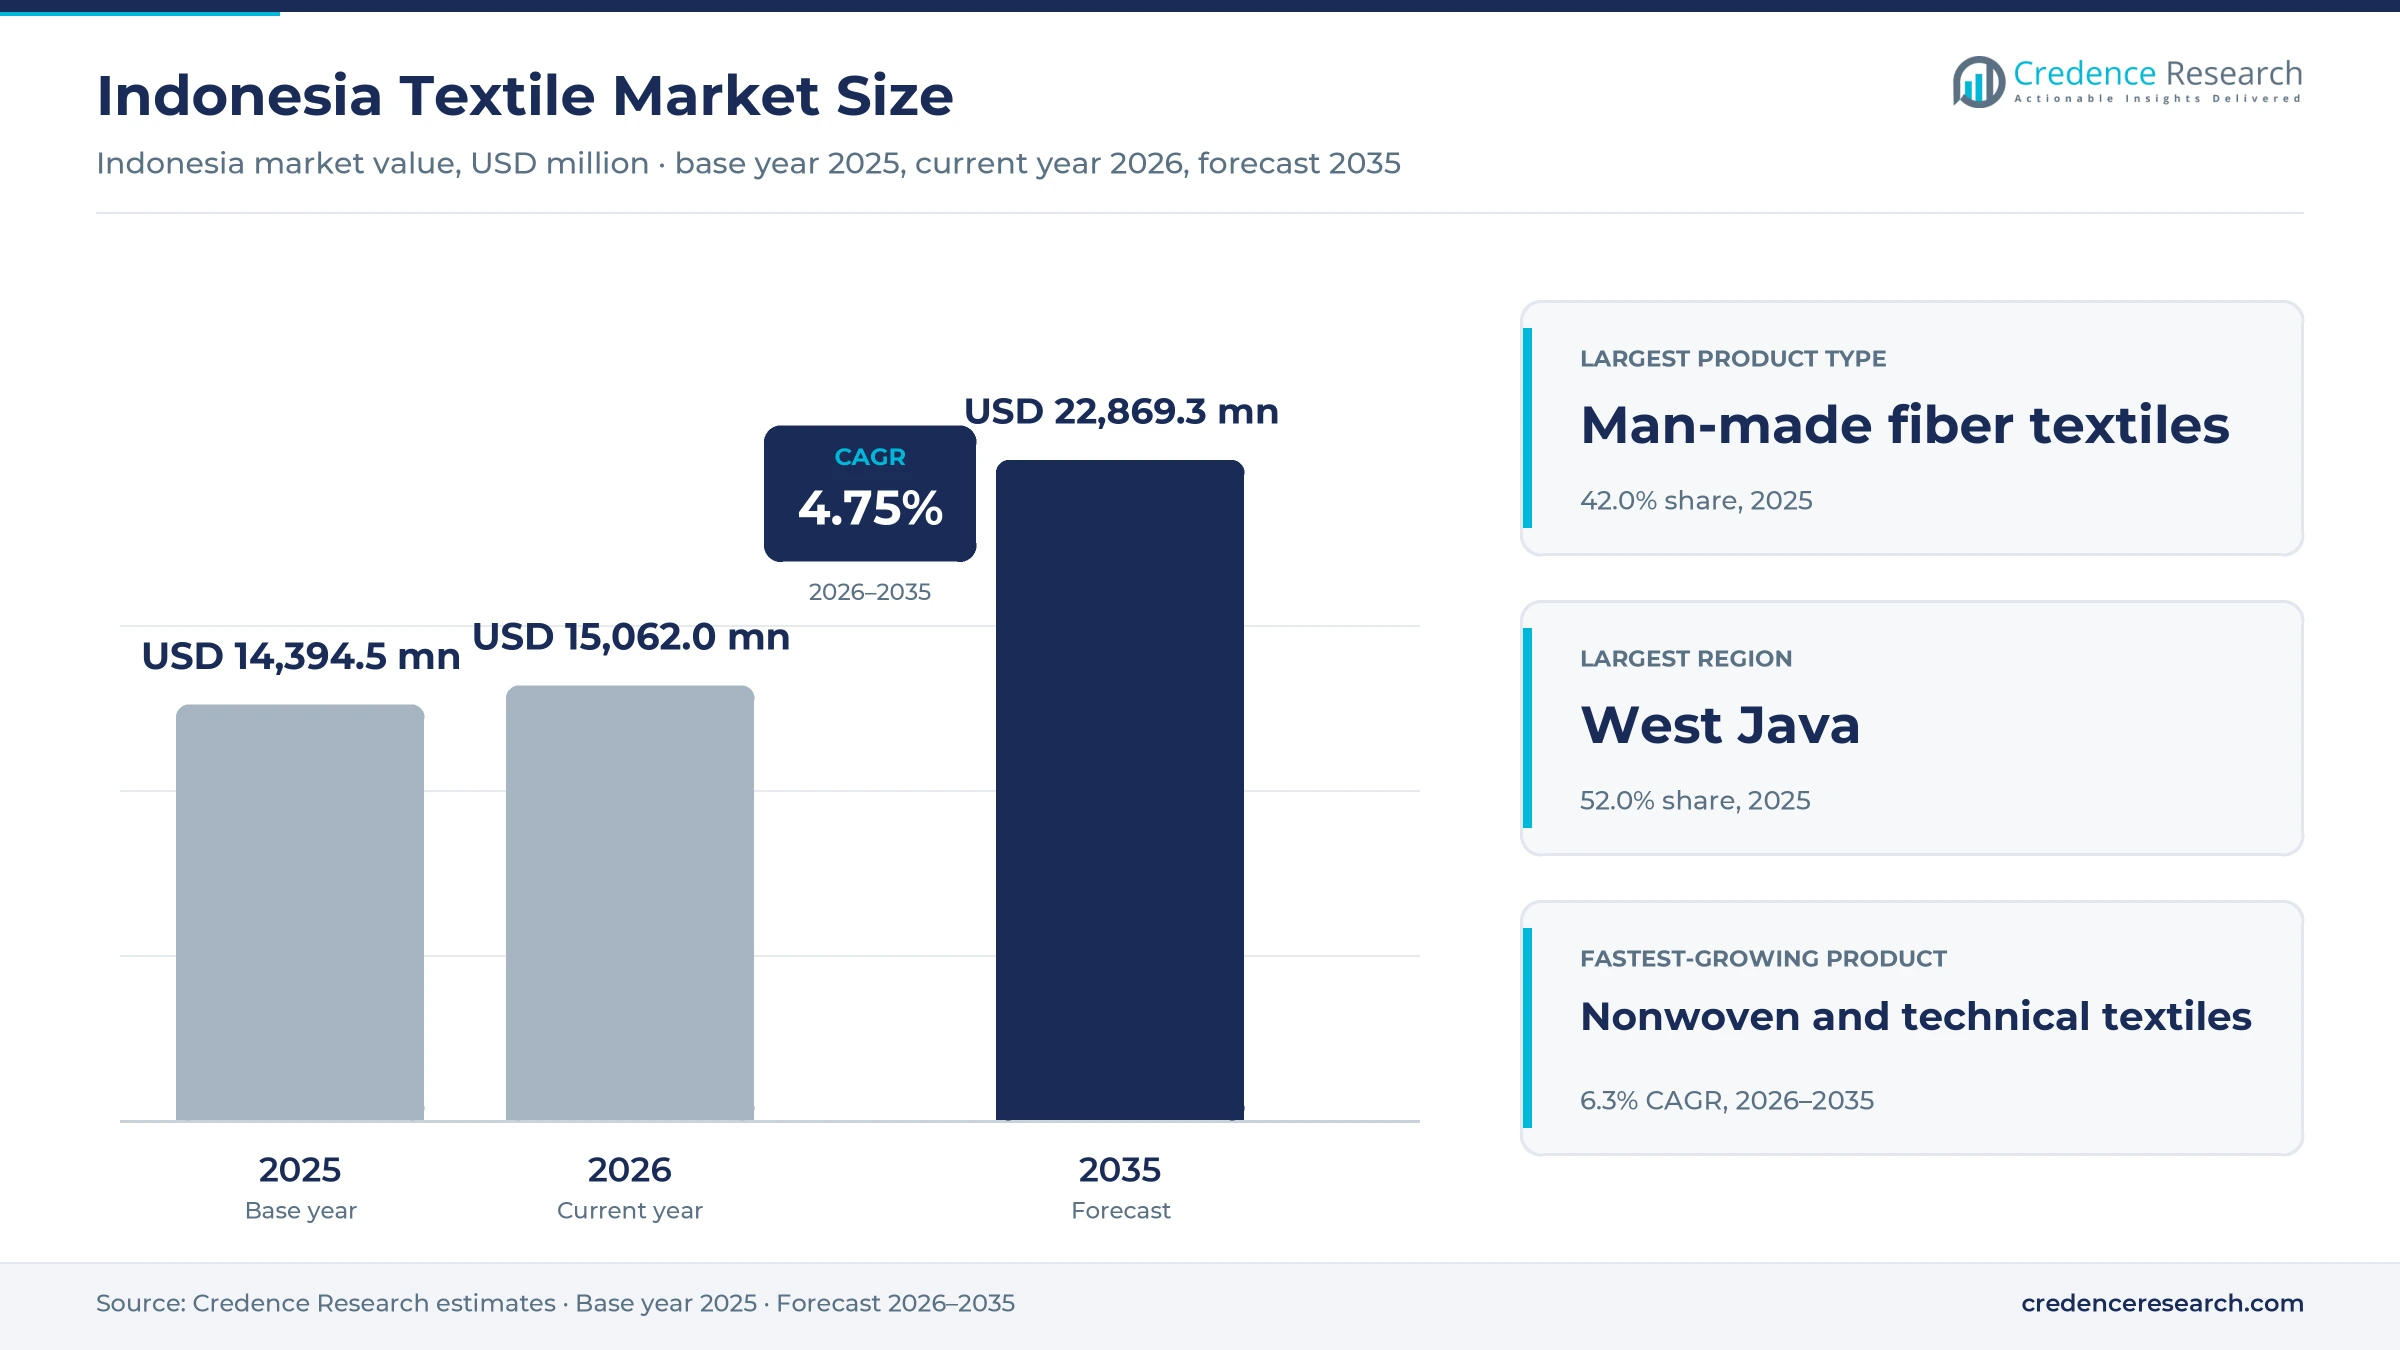
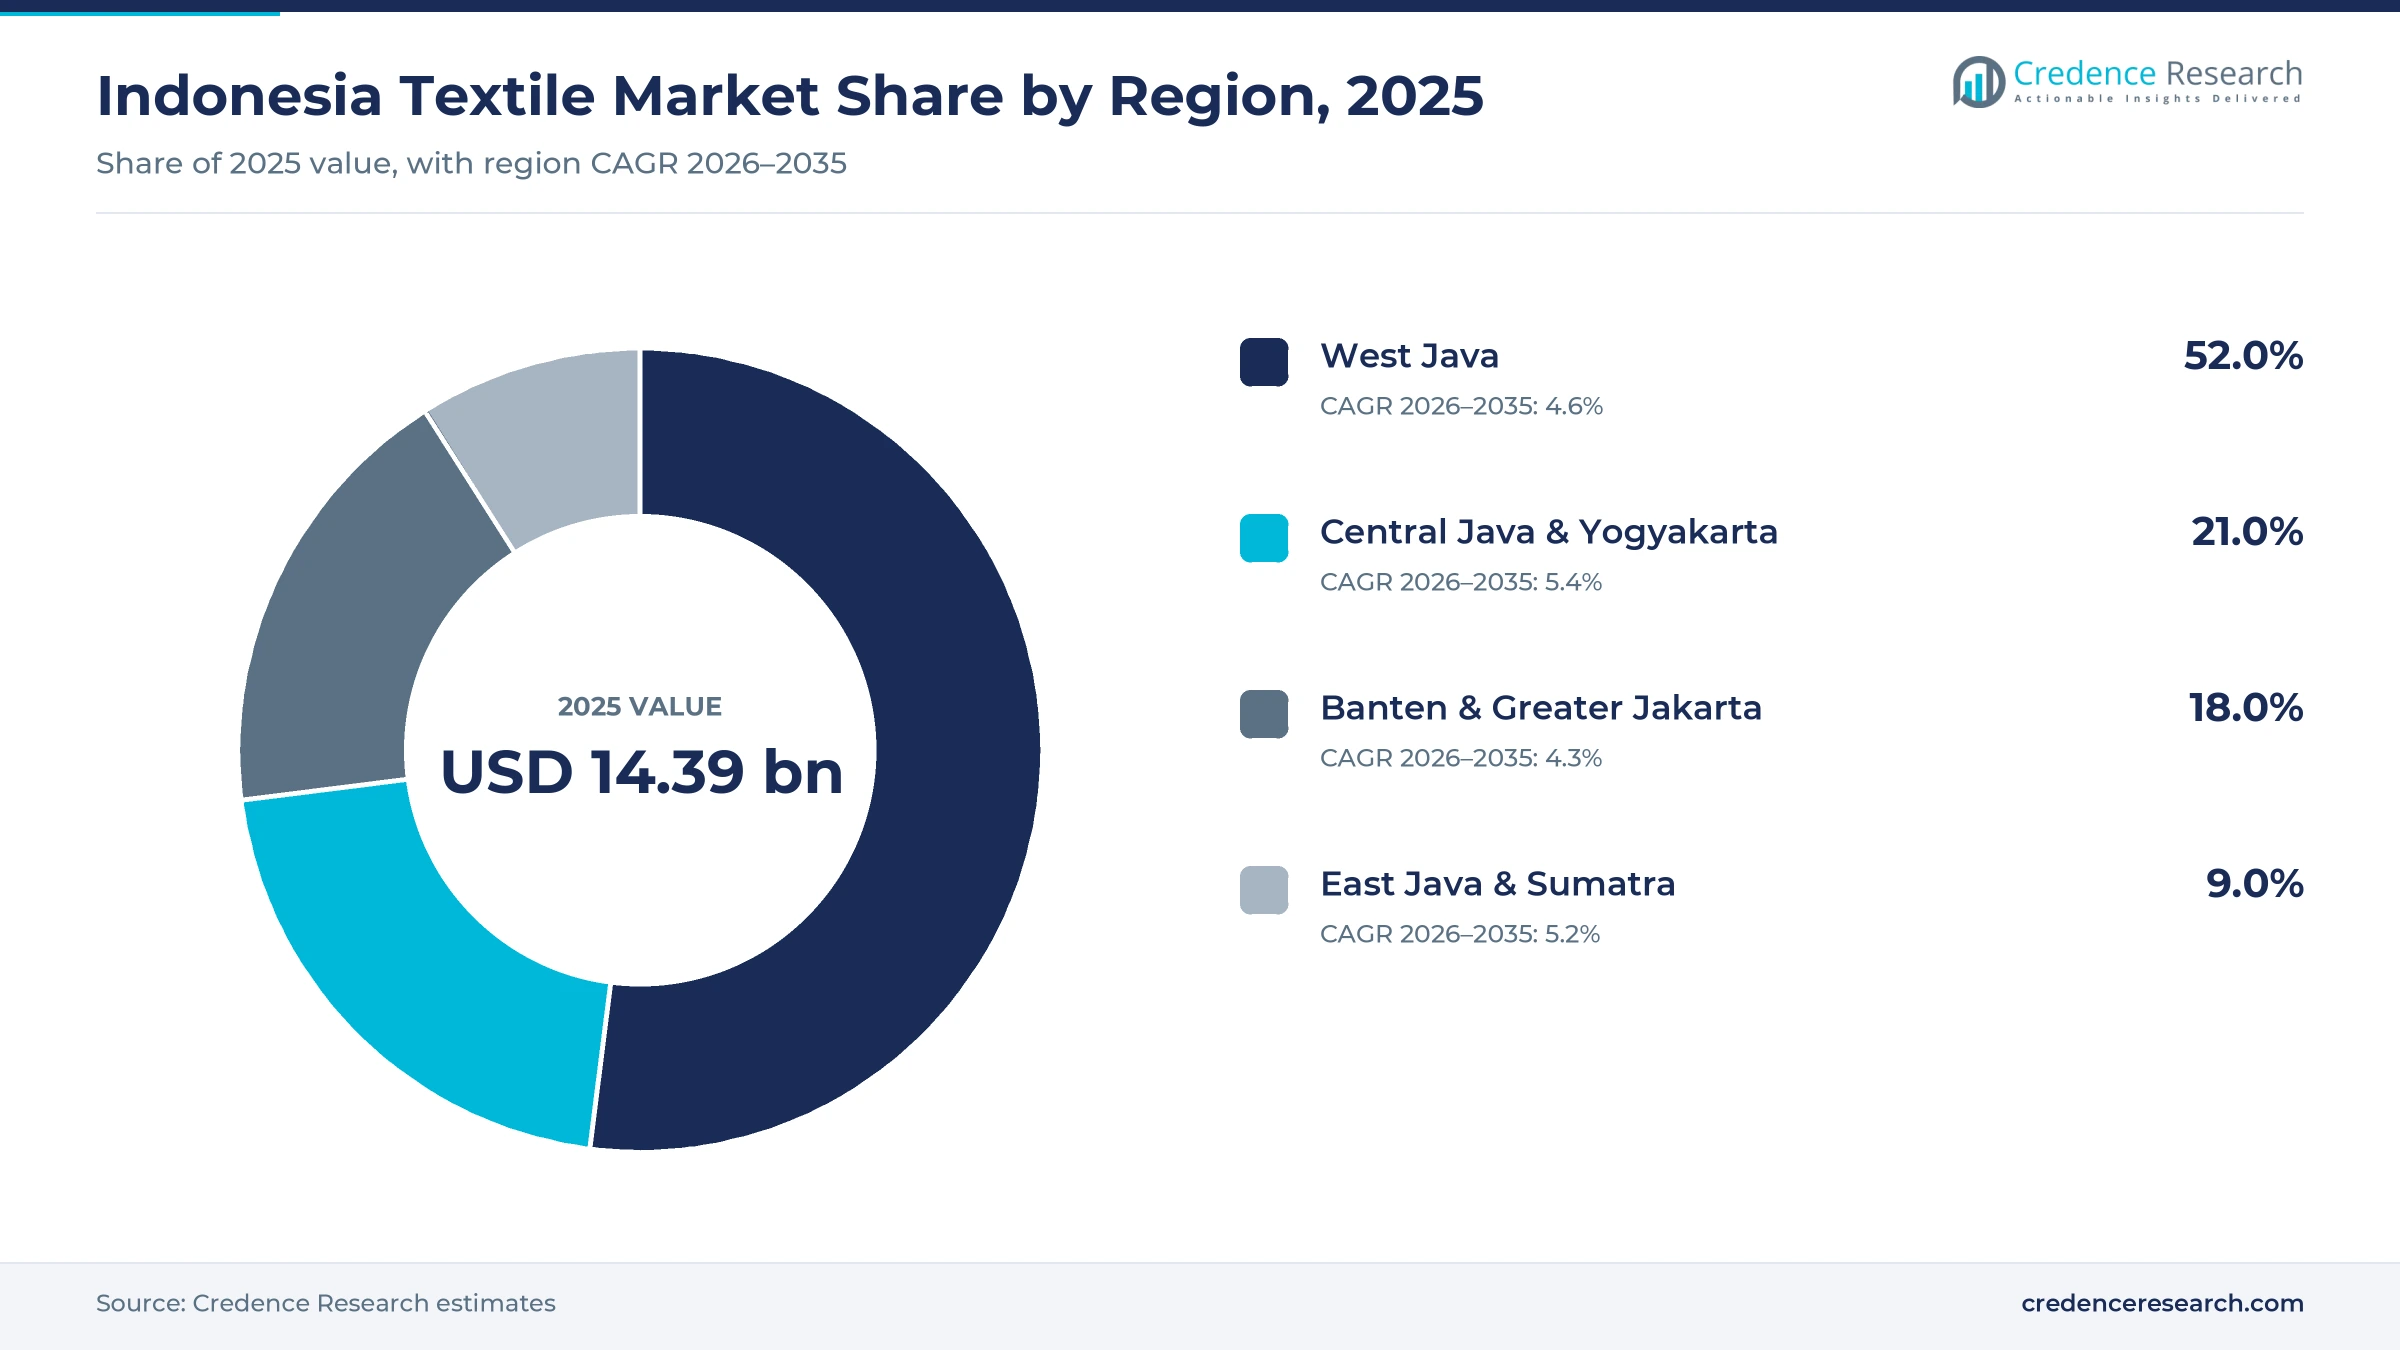
The Indonesia textile market was valued at USD 14.39 billion in 2025 and is projected to increase from USD 15.06 billion in 2026 to USD 22.87 billion by 2035, registering a CAGR of 4.75% during 2026–2035. Demand comes from a large domestic garment base, from export orders for yarn and fabric, and from home furnishing and industrial buyers that need upholstery, filtration and protective materials. West Java held the largest regional share, 52.0% in 2025, because Bandung, Purwakarta and Karawang host the densest cluster of spinning, weaving and finishing mills. Central Java & Yogyakarta is the fastest-growing region at 5.4% a year, as labor-intensive plants keep moving to lower-cost regencies around Solo and Semarang. On the policy side, the government plans a state-owned textile company backed by the Danantara investment agency, which could absorb idle capacity left by recent bankruptcies.
Which fibers, fabrics and buyers does the estimate cover?
The estimate measures the value of cotton, man-made fiber, blended and nonwoven textiles produced or sold in Indonesia at the mill gate. It covers yarn, greige and finished fabric, knitted cloth and technical materials bought by garment makers, home textile converters, vehicle suppliers, hospitals and industrial buyers, together with textiles shipped abroad by Indonesian mills.
The estimate excludes finished garments, footwear and retail margins on clothing, as well as raw cotton lint and chemical feedstocks such as purified terephthalic acid. The value chain runs from fiber producers through spinning, weaving, knitting, dyeing and finishing mills to converters, exporters and the brands that cut and sew each meter.
Indonesia Textile Market Insights
- The Indonesia textile market was valued at USD 14.39 billion in 2025 and is projected to reach USD 22.87 billion by 2035, registering a CAGR of 4.75% during 2026–2035.
- West Java held a 52.0% share of 2025 value, because its Bandung, Purwakarta and Karawang clusters host most large integrated mills.
- Man-made fiber textiles led with a 42.0% share of 2025 value, because local polyester and nylon plants feed most domestic weaving and knitting.
- Sritex was declared bankrupt in October 2024 and ceased operations in March 2025, which removed one of the largest integrated mills from the market.
- Investment in textiles and garments rose 11.85% to IDR 11.40 trillion in the first half of 2026, IDR 6.78 trillion of it in textile mills, according to the Indonesian Textile Association.
Synthetic fabric leads as nonwoven lines grow fastest
Why do synthetic fabrics carry the largest share?
Based on product type, the market is categorized into cotton-based textiles, man-made fiber textiles, blended textiles and nonwoven and technical textiles. Man-made Fiber Textiles led with a 42.0% share of 2025 value, because polyester and nylon are made locally while cotton is almost entirely imported. USDA forecasts Indonesian cotton use of only about 1.8 million bales in 2025/26, according to its cotton and products annual. Nonwoven & Technical Textiles grow fastest at 6.3% a year, as Toray lifted its Indonesian polypropylene spunbond capacity to 37,000 metric tons a year with an 18,000-ton line, according to Nonwovens Industry. Such spunbond nonwoven materials serve local hygiene, medical and filtration converters.
How much of the demand comes from garment makers?
Based on end-use industry, the market is categorized into apparel and fashion manufacturing, home furnishing and interior textiles, automotive and transportation, and healthcare and protective products. Apparel & Fashion Manufacturing led with a 66.0% share of 2025 value, because household spending on clothing, footwear and related services grew 4.52% in 2025 to about Rp 258 trillion at 2020 prices, Kemenperin said, citing BPS. Automotive & Transportation grows fastest at 5.9% a year, as Gaikindo set a 2026 target of 850,000 car sales after 803,687 wholesale units in 2025, and each car needs seat fabric, headliners and airbag cloth.
Where is mill investment moving inside the process chain?
Based on technology, the market is categorized into ring and compact spinning, air-jet and rapier weaving, circular and warp knitting, and digital dyeing, printing and finishing. Ring & Compact Spinning led with a 32.0% share of 2025 value, because yarn is the first value step and large mills run big spindle parks, such as Indorama Synthetics with 155,000 metric tons of spun yarn capacity at Purwakarta. Digital Dyeing, Printing & Finishing grows fastest at 5.7% a year, as large mills replace old finishing lines, and Kahatex alone has installed 12 Brückner stenter frames, including the newest POWER-FRAME line, according to Textilegence.
| Segment Group | Leading Sub-segment | Share, 2025 | Fastest-growing Sub-segment | CAGR, 2026–2035 |
|---|---|---|---|---|
| By Product Type | Man-made Fiber Textiles | 42.0% | Nonwoven & Technical Textiles | 6.3% |
| By End-Use Industry | Apparel & Fashion Manufacturing | 66.0% | Automotive & Transportation | 5.9% |
| By Technology | Ring & Compact Spinning | 32.0% | Digital Dyeing, Printing & Finishing | 5.7% |
Cheap Chinese filament sets the floor for local yarn prices
Mill prices in Indonesia are set by fiber cost and by the landed price of imports. Imported Chinese POY sold below the price in China itself during 2024, so local filament makers cannot pass on feedstock increases easily. Cotton fabric now carries a per-meter safeguard duty, which gives domestic weavers a small cushion for three years. Indonesian textile exports earn a low average value per kilogram, because yarn and greige cloth dominate shipments. Mills that move into dyed, printed and technical fabric can earn higher prices per meter, while commodity spinners compete mainly on energy and fiber cost.
| Offer or segment | Typical price or fee | Basis |
|---|---|---|
| Imported polyester POY from China, 2024 average | USD 1.02 per kg, versus USD 1.22 in China | APSyFI data reported by Bisnis Indonesia, June 2025 |
| Imported polyester DTY from China, 2024 average | USD 1.51 per kg, versus USD 1.81 in China | APSyFI data reported by Bisnis Indonesia, June 2025 |
| Safeguard duty on woven cotton fabric, year one | Rp 3,000 to Rp 3,300 per meter | Minister of Finance Regulation 98 of 2025, December 2025 |
| Indonesian textile exports, average unit value | About USD 2.3 per kg | Credence Research estimate from BPS 2025 export value and volume |
| Textile and textile product imports, average unit value | About USD 4.1 per kg | Credence Research estimate from BPS 2024 import value and volume |
Request a Free Sample
Fill in your details and we'll send you a free sample report.
- Sample data tables & charts
- Research methodology
Apparel pull, new trade deals and machine upgrades
How does the domestic garment base keep mills running?
Indonesia still has one of the largest garment industries in Asia, and that domestic manufacturing base buys most of the yarn and fabric made at home. The textile and textile product industry employs about 3.8 million workers, the Ministry of Industry said in a statement in August 2026. The subsector grew 4.37% year on year in the fourth quarter of 2025, according to BPS data reported by Kontan, as factory utilization recovered. The Indonesian Textile Association put growth at 6.36% in the second quarter of 2026. Local garment and apparel brands that source fabric nearby gain shorter lead times, which keeps garment makers the main buyers of local fabric.
Why do new trade deals widen export access for mills?
Indonesian mills have depended heavily on the U.S. market, so new trade agreements matter for export access and diversification. Indonesia and the EU finalized their comprehensive economic partnership on Sept. 23, 2025, and the European Commission says tariffs on over 98% of tariff lines will go, with about 80% removed at entry into force. Coordinating Economic Minister Airlangga Hartarto is targeting entry into force on Jan. 1, 2027, Arab News reported. Exports of textiles and garments combined (TPT) reached USD 4.85 billion in the first half of 2026, up 1.57%, according to Indonesia Business Post. Mills with EU-ready certification should win the first orders once duties fall.
How do machine upgrades lift technical fabric output?
Much of the installed base is old, and the state now pays part of the cost of new machines, which supports modernization and the move into technical fabric. The 2026 restructuring program of the Ministry of Industry reimburses up to Rp 500 million per company for spinning, weaving, knitting, dyeing and printing machines bought between June 1, 2025, and June 30, 2026, UKM Indonesia reported. Investment in the textile subsector rose to IDR 6.78 trillion in the first half of 2026, the Indonesian Textile Association said. In April 2026, three firms committed up to USD 60 million to weaving, dyeing and garment plants at Subang Smartpolitan. New digital printing and finishing lines lift value per meter.
Can trade defense measures win back domestic share?
Cheap imports took share from local mills in 2023 and 2024, and new trade defense measures now aim to return part of the home market to domestic producers. Textile and textile product imports reached USD 8.94 billion in 2024, up about 7%, according to BPS data compiled by Katadata. A safeguard duty on woven cotton fabric from most countries took effect on Jan. 10, 2026, for three years. The trade remedies committee also recommended anti-dumping duties of up to 42.3% on Chinese POY and DTY filament yarn, Bisnis Indonesia reported in June 2025. Cotton weavers gain the most, because imported cloth had undercut local greige prices for two years.
Feedstock swings and consolidation reshape the mill base
How is the shift to polyester raising feedstock risk?
Synthetic fiber now dominates local fabric, a shift that ties mill margins to oil-based feedstock prices. Polyester raw material prices rose as much as 40% in two weeks, Kontan reported on April 8, 2026, after conflict in the Middle East disrupted supply. Indorama Synthetics runs 140,000 metric tons of polyester staple fiber and 85,000 metric tons of filament yarn capacity at Purwakarta, so domestic supply exists but follows world prices. Buyers of polyester staple fiber face fast price resets on every new contract. Because synthetic fabric is the largest product pool, feedstock costs move most fabric prices. Mills that hold longer supply contracts with fiber makers can protect margins better than rivals that buy spot.
Why is consolidation of the mill base emerging?
Weak demand and heavy debt are forcing a consolidation of the mill base, with the state stepping in as a buyer. Sritex laid off 11,025 workers between August 2024 and February 2025, CNBC Indonesia reported, after a court declared it bankrupt in October 2024. Industry Minister Sarmuji said in October 2026 that a planned state textile company will acquire firms including Sritex, with an investment need of about USD 6 billion. Integrated groups such as Duniatex have hired workers released by failed rivals. About 1,000 to 1,300 former Sritex workers were rehired by PT Citra Busana Sejahtera from May 2025, CNBC Indonesia reported. Buyers should expect fewer but larger suppliers to set fabric terms over the forecast period.
Can U.S. cotton-linked quotas open a new export lane?
The U.S. trade deal creates an opening for mills that use American cotton or U.S. man-made fiber. The White House said on Feb. 19, 2026, that certain Indonesian textile and apparel goods will enter at 0% within a volume tied to U.S. exports of cotton and man-made fiber inputs. The 19% reciprocal rate still applies to other goods, so the quota is valuable. Trisula Textile plans to sell a new recycled-yarn fabric entirely for export in 2026, Kontan reported in February. Spinners that certify U.S. cotton content should gain share in U.S.-bound orders. Mills that document fiber origin through the chain can qualify faster than rivals using mixed imported lint.
Is the Central Java relocation corridor an opening for new mills?
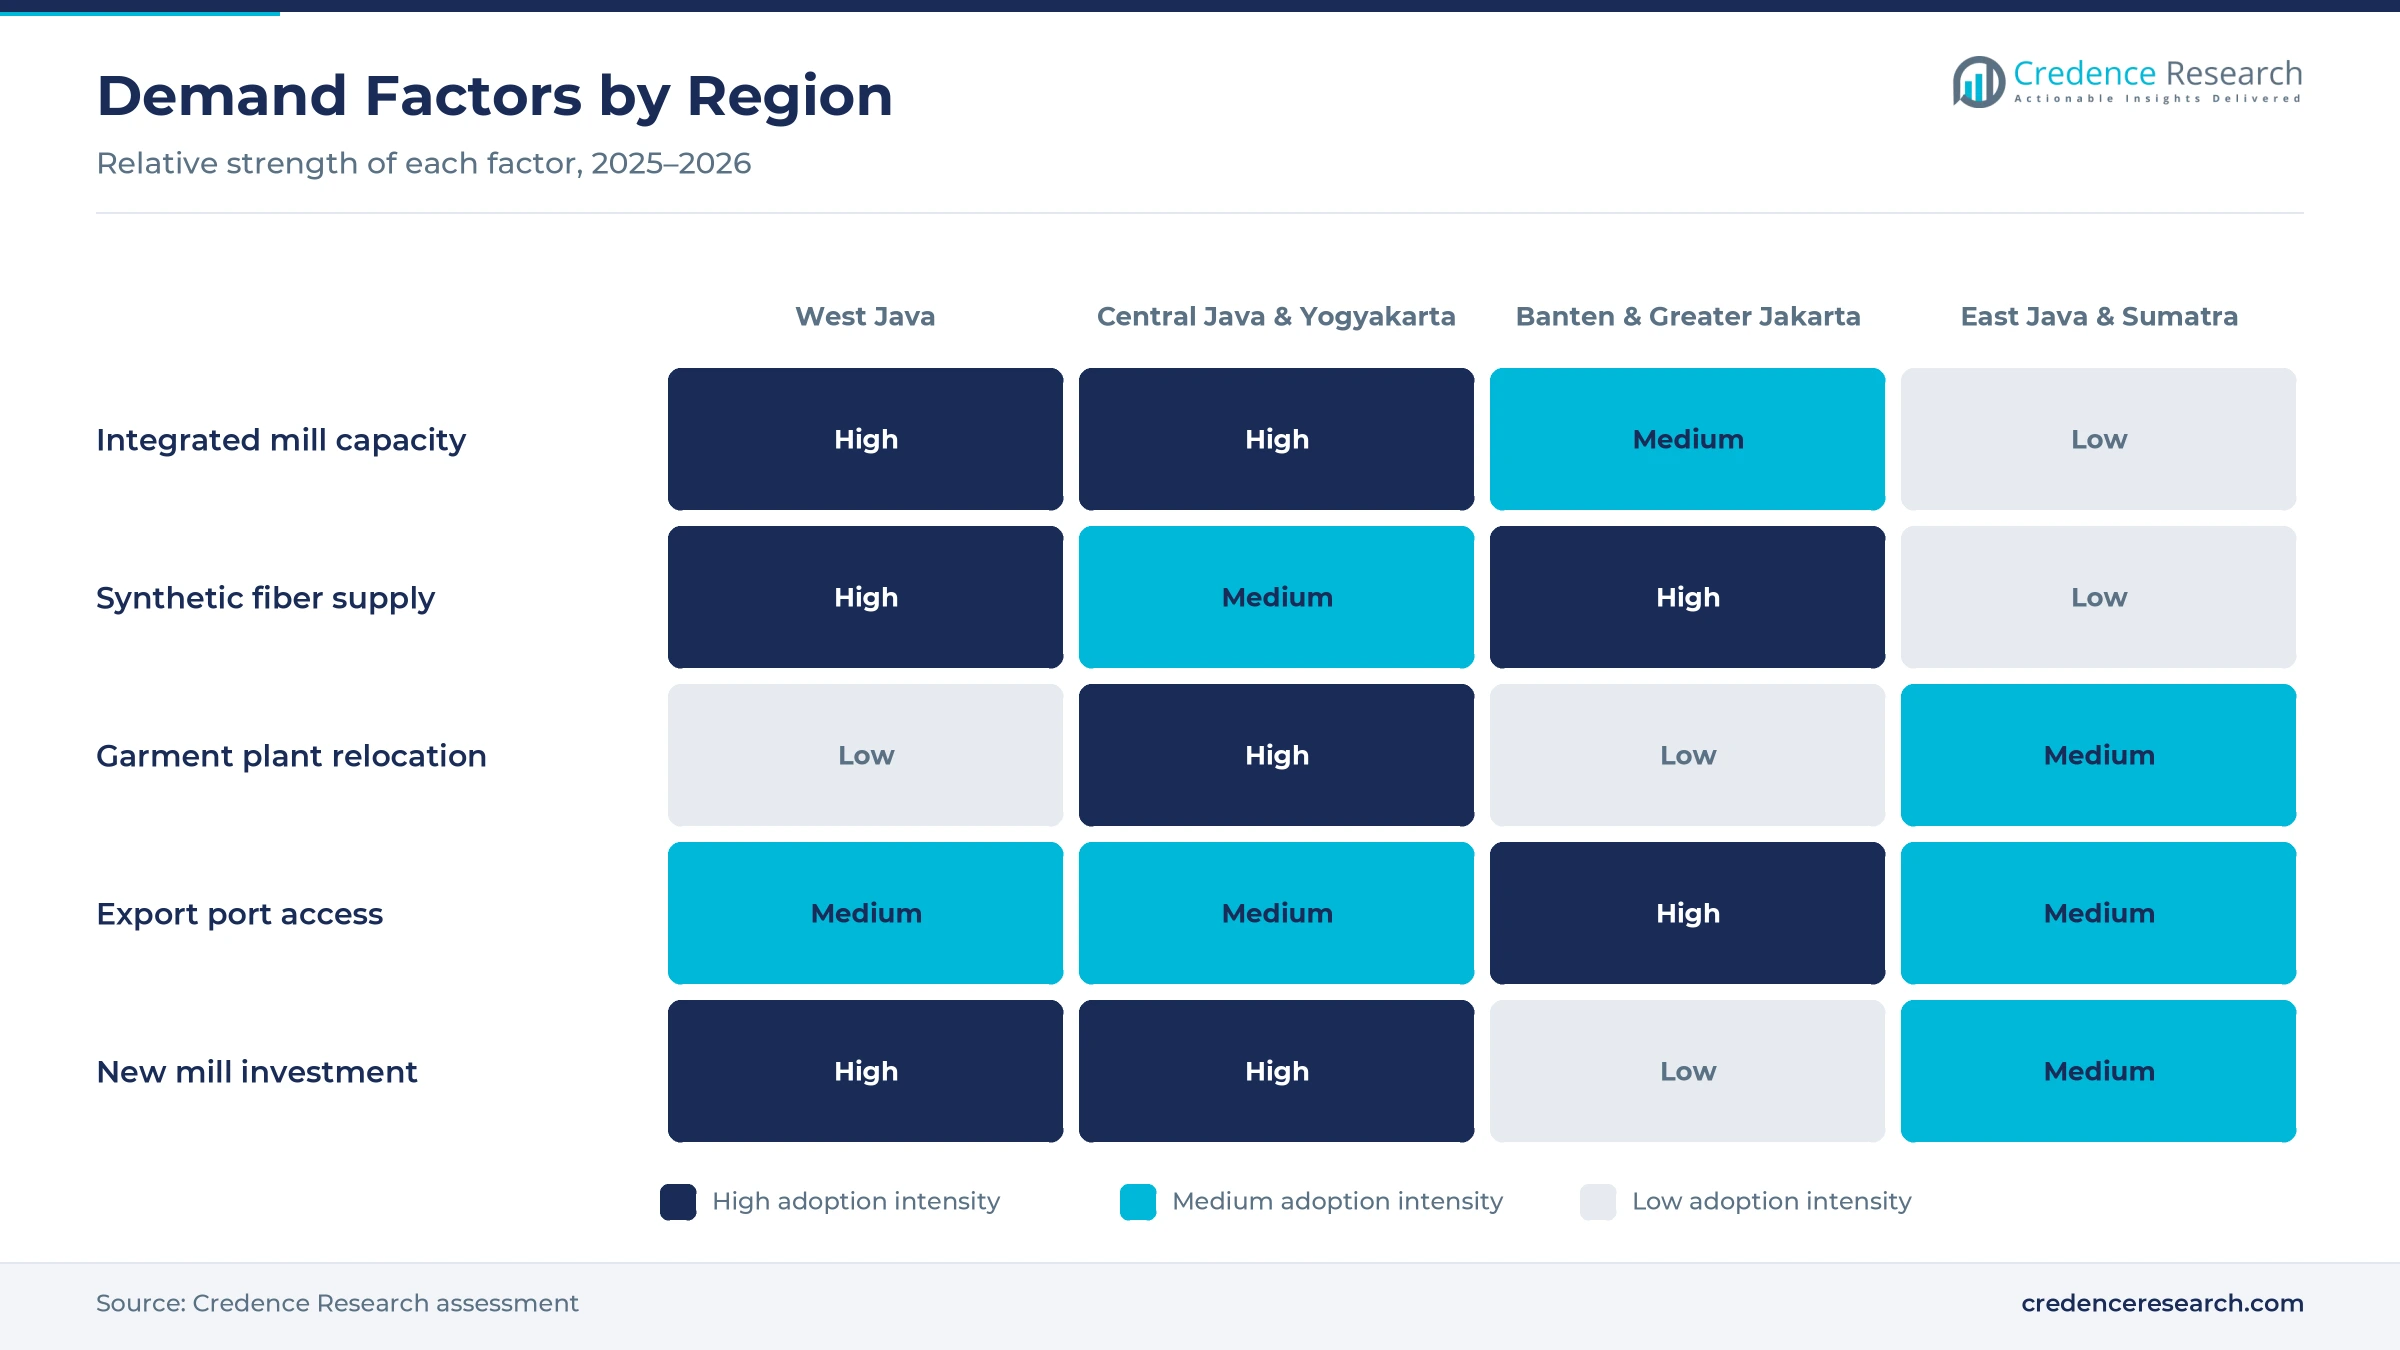
Lower wages and available land in Central Java give mill investors an opening to build or buy capacity outside the costly West Java belt. The West Java chapter of Apindo counted 28 labor-intensive factories that moved to Central Java between 2019 and 2022, Bisnis Indonesia reported in November 2024. The same Apindo data showed 91,450 workers laid off in West Java because of relocations from 2021 through October 2023. After the Sritex layoffs, Sukoharjo prepared about 8,000 vacancies at other local companies, CNBC Indonesia reported in December 2025, which shows a ready labor pool for new mills. Central Java & Yogyakarta is the fastest-growing region in this report, so suppliers of yarn and finishing services should follow garment plants into the province.
Cheap imports, U.S. duties and plant closures weigh on mills
How do cheap imports keep mill output under pressure?
Clothing demand rose in 2025, yet much of it was met by imported goods, so local mills did not gain in step. Kemenperin said the textile industry contracted in October and November 2025 on its industry confidence index, Katadata reported in February 2026. Textile exports fell 9.5% to USD 3.28 billion in 2025, a decade low, according to BPS data compiled by Katadata Databoks. Spinners and weavers without branded or technical lines feel this most and must cut costs or move up the value chain.
Why does reliance on Middle East glycol raise cost risk?
Polyester mills depend on a narrow set of imported feedstocks, which leaves them exposed when supply routes close. About 85% of the monoethylene glycol used in Indonesian textile production comes from the Middle East, APSyFI chairman Redma Gita Wirawasta said in March 2026. Freight, insurance and longer transit times also raise export costs to Europe. Filament makers with thin margins face the largest losses, so many are seeking longer supply contracts and Asian glycol sources.
How do U.S. duties limit price competitiveness for exporters?
Indonesian textiles still pay a 19% U.S. tariff, while palm oil and other tropical products won exemptions. Coordinating Economic Minister Airlangga Hartarto said in December 2025 that textiles do not qualify as natural products under the agreement, Asia News Network reported. U.S.-bound garment orders therefore carry a cost that mills share with brand buyers. Exporters respond by shifting part of their output toward the EU and by certifying U.S. cotton content for the duty-free quota.
Why do idle plants and debt strain synthetic fiber makers?
Several fiber producers carry heavy debt from earlier expansions, and weak orders have forced permanent closures. Asia Pacific Fibers suspended its Karawang chemical and fiber unit on Nov. 1, 2024, and closed it permanently in July 2025, VOI reported, keeping only its Kendal plant. APSyFI linked five closures in 2025, including Sulindafin in Tangerang, to about 3,000 job losses. Downstream weavers lose local suppliers and rely more on imported yarn.
West Java holds over half of national mill value
The Indonesia textile market is split into four zones, and their 2025 shares are Credence Research estimates based on BPS textile and apparel output by province. Regional growth rates are Credence Research estimates based on plant relocation, wage levels and new investment.
| Region | Value, 2025 (USD billion) | Share, 2025 | CAGR, 2026–2035 |
|---|---|---|---|
| West Java | 7.49 | 52.0% | 4.6% |
| Central Java & Yogyakarta | 3.02 | 21.0% | 5.4% |
| Banten & Greater Jakarta | 2.59 | 18.0% | 4.3% |
| East Java & Sumatra | 1.30 | 9.0% | 5.2% |
Why does West Java hold most mill value?
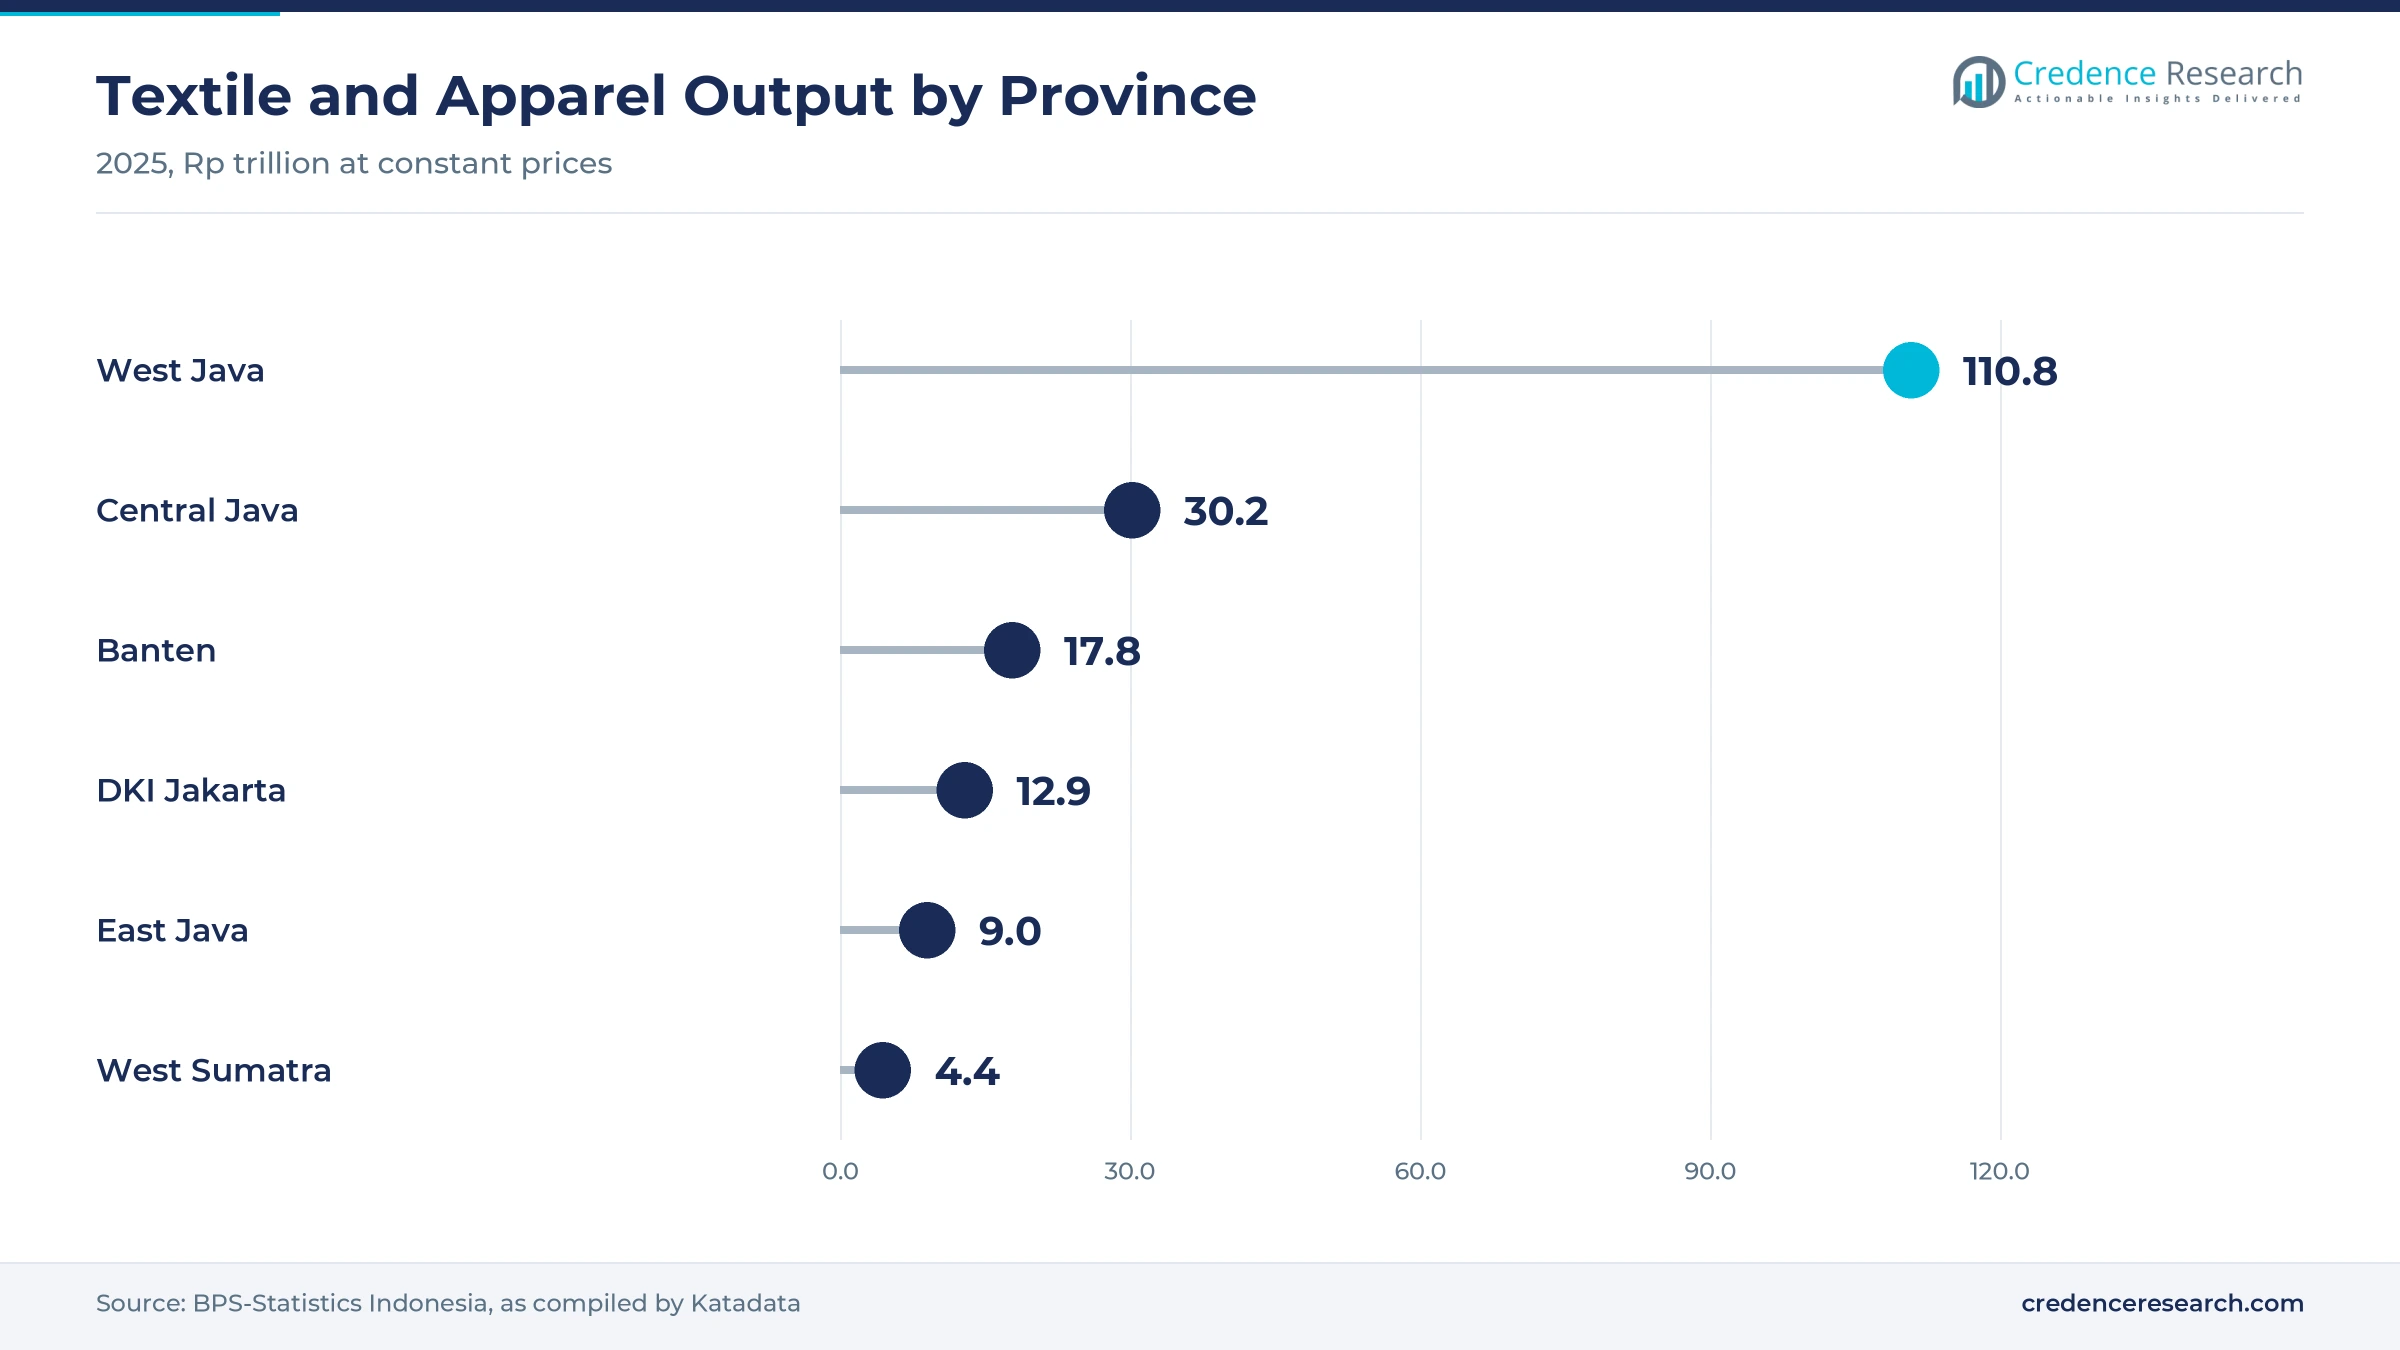
West Java held a 52.0% share of 2025 value and grows at 4.6% a year, because Bandung, Cimahi, Purwakarta and Karawang host the largest integrated mills. BPS put the 2025 textile and apparel output of the province at Rp 110.79 trillion at constant prices, far above any other province. Kahatex, Indorama Synthetics and Trisula Textile all operate in the zone. Rising minimum wages slow its growth slightly, so the zone keeps investing in automation instead of headcount.
How is Central Java & Yogyakarta gaining share?
Central Java & Yogyakarta held 21.0% of 2025 value and grows fastest at 5.4% a year, because spinning and garment plants keep moving to lower-cost regencies. Central Java produced Rp 30.2 trillion of textile and apparel output in 2025 at constant prices, BPS data show. Duniatex runs 25 factories in the province, and Dan Liris operates an integrated mill in Sukoharjo. The Sritex closure left idle capacity that a state buyer may restart.
Why do Banten and Jakarta anchor synthetic fiber supply?
Banten & Greater Jakarta held 18.0% of 2025 value and grows at 4.3% a year, because Tangerang hosts the older synthetic fiber and fabric plants. Banten recorded Rp 17.78 trillion of textile and apparel output in 2025 and Jakarta Rp 12.88 trillion. Tifico, Indonesia Toray Synthetics and ISTEM supply polyester and nylon from the area. Closures of older fiber lines explain the slowest regional growth rate.
What role do East Java and Sumatra play?
East Java & Sumatra held 9.0% of 2025 value and grows at 5.2% a year, because the zone mainly serves regional garment makers and home textile buyers. East Java recorded about Rp 9.0 trillion of textile and apparel output in 2025 and West Sumatra about Rp 4.36 trillion. Lower land costs and port access in Surabaya attract new knitting and finishing plants from a small base.
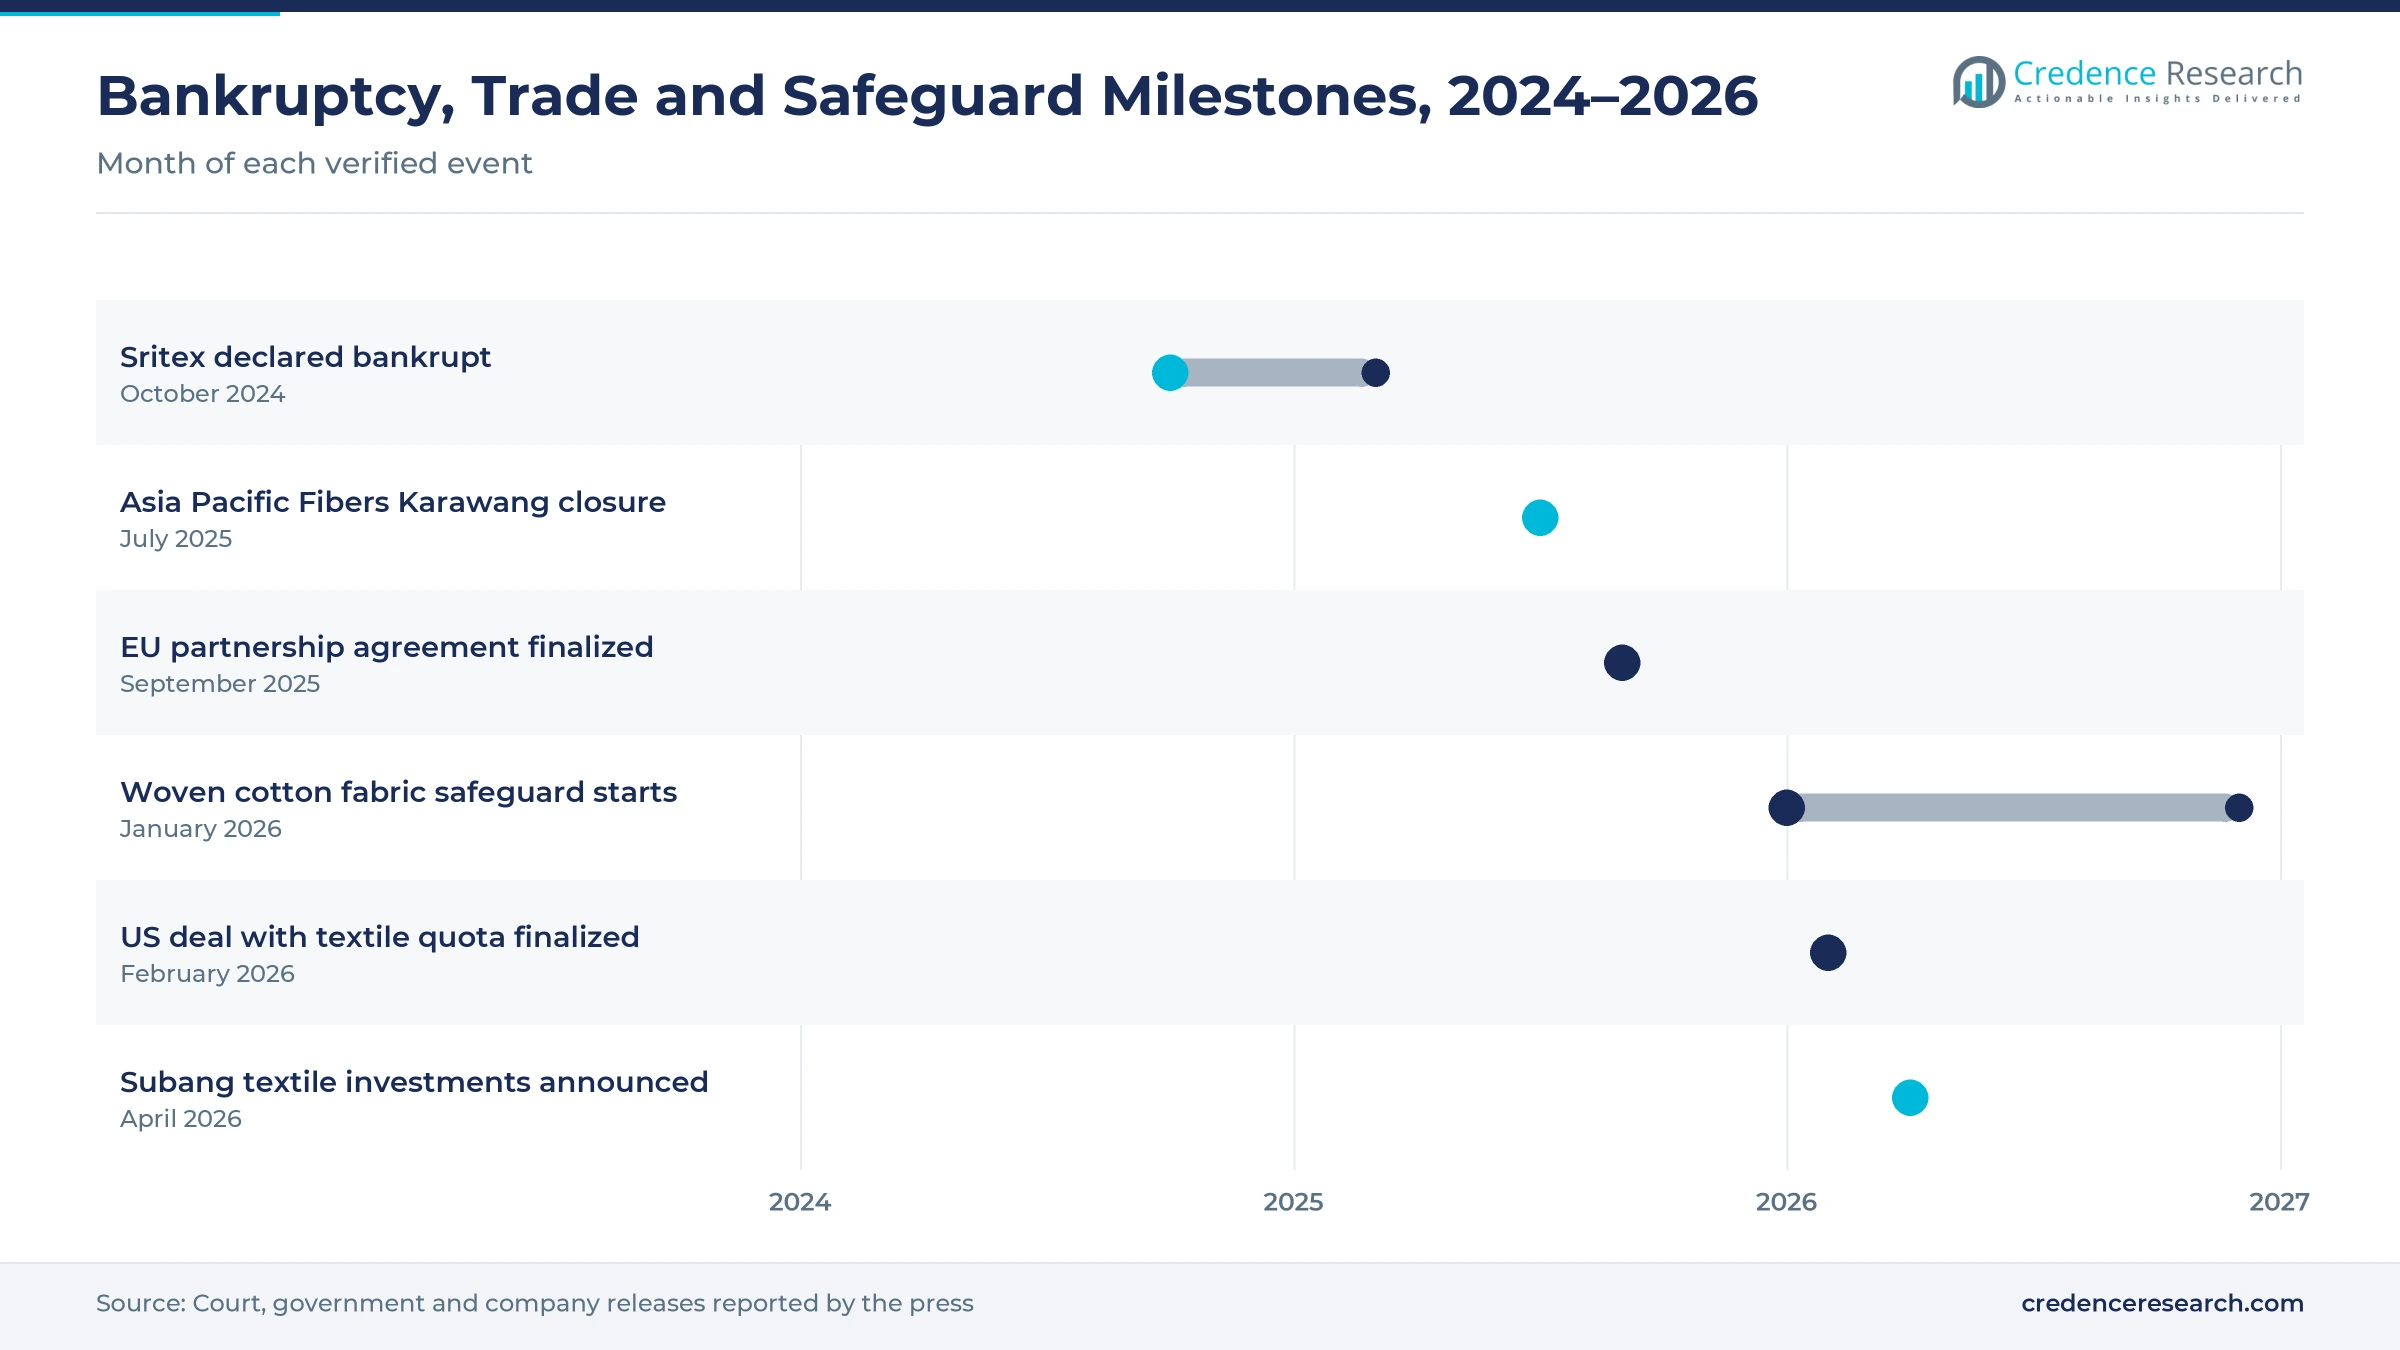
Bankruptcy, trade and safeguard milestones, 2024 to 2026
| Development | Status and market relevance |
|---|---|
| In October 2024, a commercial court declared Sritex bankrupt, and the group ceased operations in March 2025. | Removes a large integrated mill and frees orders |
| In July 2025, Asia Pacific Fibers permanently closed its Karawang chemical and fiber unit. | Cuts domestic polyester supply |
| In September 2025, Indonesia and the EU finalized their comprehensive economic partnership agreement. | Opens tariff-free access to the EU from entry into force |
| In January 2026, a three-year safeguard duty on woven cotton fabric imports took effect. | Supports domestic cotton weavers |
| In February 2026, the United States and Indonesia finalized a trade deal with a duty-free textile quota. | Rewards fabric made with U.S. cotton and fiber |
Compact spinning and digital finishing raise mill output
- Compact spinning frames condense fibers before twisting, a step that gives stronger and less hairy yarn for knitwear and fine shirting.
- Air-jet and rapier looms insert weft at high speed or with gentle control, so weavers can run commodity greige and fancy fabric in the same shed.
- Circular and warp knitting machines make jersey, fleece and tricot fabric for sportswear, lining and automotive headliners at high output per worker.
- Digital printing and modern stenters cut sample times and energy use in finishing, which lets mills take small fashion orders at higher margins.
Need a Custom Version of This Report?
Tailor the scope, geography, or segments to your exact requirements.
- Custom geography or segment scope
- Direct access to our analyst team
Integrated groups and synthetic fiber makers set the pace
Competition is shaped by family-run integrated groups, synthetic fiber producers with Japanese or listed parents, and mid-size listed weavers. Kahatex and Duniatex run spinning, weaving and finishing at very large scale in West and Central Java. Indorama Synthetics, Indonesia Toray Synthetics, Tifico Fiber and Asia Pacific Fibers supply polyester and nylon fiber and yarn to downstream mills. Dan Liris and ISTEM combine spinning, weaving and dyeing for apparel and uniform fabric. Trisula Textile focuses on polyester and blended uniform fabric, while Ever Shine Tex makes nylon filament yarn and synthetic woven and warp-knit fabric. Rivals compete on fiber cost, energy efficiency, delivery time and certification for export brands. Firms with integrated chains and export approvals hold the strongest positions.
How concentrated is the Indonesian mill base?
The Indonesian supply side is concentrated upstream and fragmented downstream. Only about four companies still produce polyester polymer for the domestic market, APSyFI said in June 2025, and a few groups such as Indorama, Toray and Tifico make most staple fiber and filament. Below them, hundreds of spinning, weaving and knitting mills and many small finishers compete on price for garment orders. Entry barriers are high in fiber and integrated mills, which need power plants and large working capital. Margins are thin in commodity yarn and greige cloth and best in finished, technical and export-certified fabric.
Which mills and fiber makers lead Indonesian supply?
| Company | Type | Role in the market |
|---|---|---|
| PT Kahatex | Integrated mill group | Spins, weaves, knits and finishes fabric at three Indonesian sites for export |
| Duniatex Group | Integrated mill group | Runs 25 spinning, weaving and finishing factories across Central Java |
| PT Indorama Synthetics Tbk | Fiber and yarn producer | Makes polyester staple fiber, filament, spun yarn and fabric at Purwakarta |
| PT Asia Pacific Fibers Tbk | Polyester fiber producer | Makes polyester fiber and yarn at its Kaliwungu plant in Kendal |
| PT Indonesia Toray Synthetics | Synthetic fiber producer | Makes nylon filament yarn, polyester staple fiber and polyester filament yarn |
| PT Tifico Fiber Indonesia Tbk | Polyester fiber producer | Makes polyester chips, staple fiber and filament yarn in Tangerang |
| PT Dan Liris | Integrated mill | Spins, weaves, dyes and digitally prints fabric in Sukoharjo |
| PT Trisula Textile Industries Tbk | Fabric manufacturer | Makes polyester, polyester-rayon and recycled fabric for uniforms and export |
| PT Ever Shine Tex Tbk | Filament yarn and fabric maker | Makes nylon 6 filament yarn and synthetic woven and warp-knit fabric |
| PT Indonesia Synthetic Textile Mills | Integrated fabric mill | Makes dyed polyester-viscose fabric for uniforms and suits in Tangerang |
Credence Research view on Indonesian mills to 2035
Credence Research's view is that Indonesian textile value will grow steadily because a large garment base buys most local yarn and fabric, while trade deals and machine upgrades add export and technical demand. Man-made fiber fabric will stay the largest pool, but nonwoven, automotive and digitally finished lines will set the pace. Consolidation after the Sritex failure should leave fewer, stronger groups. Mills that secure EU and U.S. certification and control their fiber costs should outperform commodity spinners.
Trade, output and plant data behind the estimate
The report uses 2025 as the base year on a calendar basis, and market values come from the Credence Research model. That model combines textile export and import values and volumes, household clothing spending, provincial output data, fiber capacity and cotton use, and company releases on plants, closures and investments. Regional shares, regional growth rates, segment splits and segment growth rates are Credence Research estimates. Sources used are government statistics and releases, international agency data, trade association statements and company filings reported in the press, and no interviews or surveys were used.
Synthetic, technical and export fabric lead to 2035
The Indonesia textile market is expected to reach USD 22.87 billion by 2035, a 4.75% CAGR during 2026–2035, as domestic garment demand holds and export access widens. Growth should be strongest in nonwoven and technical textiles, automotive fabric and digital finishing, because these lines earn more per meter and face less import competition. Central Java & Yogyakarta should gain share as garment and spinning plants relocate eastward. Cheap imports, feedstock price spikes and the debt of older fiber producers could slow commodity spinners and weavers.
What decides whether mill value grows faster or slower?
The range of outcomes depends mostly on import pressure and on how fast new trade access turns into orders. A downside case follows a renewed flood of cheap fabric, further fiber plant closures and a long feedstock price spike. The base case assumes steady domestic garment demand, a working safeguard regime and gradual gains from the EU deal. An upside case needs early entry into force of the EU agreement, a large U.S. duty-free quota and a quick restart of idle Sritex capacity.
| Scenario | CAGR, 2026–2035 | Value, 2035 | What has to hold |
|---|---|---|---|
| Downside | 3.4% | USD 20.26 billion | Cheap imports return, more fiber plants close and feedstock prices stay high |
| Base | 4.75% | USD 22.87 billion | Garment demand holds, safeguards work and EU access phases in on schedule |
| Upside | 6.0% | USD 25.56 billion | The EU deal starts early, the U.S. quota is large and idle mills restart |
Frequently Asked Questions
How big is the Indonesia textile market?
Which product type leads Indonesian textile sales?
Which region leads the Indonesian market?
How do trade deals affect Indonesian mills?
Which end-use industry grows fastest?
How will a state textile company change supply?
Who are the leading companies in the Indonesian market?
What are the main challenges for Indonesian mills?
Table of Content
Chapter 1 Market Segmentation
- 1.1 Segmentation Framework
- 1.1.1 Product and Service Classification
- 1.1.2 Application and End-Use Classification
- 1.1.3 Technology and Solution Classification
- 1.1.4 Customer and Distribution Channel Classification
- 1.1.5 Geographic Segmentation
- 1.1.6 Market Segment Definitions and Boundaries
- 1.2 By Product Type
- 1.2.1 Cotton-based Textiles
- 1.2.2 Man-made Fiber Textiles
- 1.2.3 Blended Textiles
- 1.2.4 Nonwoven & Technical Textiles
- 1.3 By End-Use Industry
- 1.3.1 Apparel & Fashion Manufacturing
- 1.3.2 Home Furnishing & Interior Textiles
- 1.3.3 Automotive & Transportation
- 1.3.4 Healthcare & Protective Products
- 1.4 By Technology
- 1.4.1 Ring & Compact Spinning
- 1.4.2 Air-Jet & Rapier Weaving
- 1.4.3 Circular & Warp Knitting
- 1.4.4 Digital Dyeing, Printing & Finishing
Chapter 2 Introduction
- 2.1 Report Objectives and Scope
- 2.2 Product Definition and Industry Terminology
- 2.3 Market Inclusions and Exclusions
- 2.4 Research Process
- 2.4.1 Primary Research and Expert Interviews
- 2.4.2 Secondary Research and Source Review
- 2.4.3 Top-Down and Bottom-Up Estimation
- 2.4.4 Data Triangulation and Verification
- 2.5 Market Size Measurement Basis
- 2.5.1 2025: USD 14.39 billion → 2035: USD 22.87 billion
- 2.6 Historical and Forecast Reference Periods
- 2.6.1 Historical Period: 2018-2025
- 2.6.2 Base Year: 2025
- 2.6.3 Forecast Period: 2025-2035
- 2.7 Research Assumptions and Limitations
Chapter 3 Executive Summary
- 3.1 Market Snapshot and Key Findings
- 3.2 Base-Year Market Size, 2025
- 3.3 Forecast Market Size, 2035
- 3.4 Revenue and Volume Growth Outlook
- 3.5 Key Demand and Supply Indicators
- 3.6 Leading Market Segments
- 3.7 Fastest-Growing Market Opportunities
- 3.8 Regional Performance Highlights
- 3.9 Technology and Industry Transformation
- 3.10 Competitive Landscape Summary
- 3.11 Analyst View and Strategic Implications
Chapter 4 Indonesia Textile Market Trends and Developments
- 4.1 Historical Industry Development, 2018-2025
- 4.2 Recent Market Trends and Developments
- 4.3 Demand and Customer Behavior Trends
- 4.4 Technology and Product Innovation
- 4.5 Artificial Intelligence, Automation and Digitalization
- 4.6 Local Manufacturing and Supply Chain Realignment
- 4.7 Industry Partnerships, Mergers and Acquisitions
- 4.8 Sustainability and Circular Economy Developments
- 4.9 Government and Private Sector Investment Trends
- 4.10 Emerging Business Models and Commercialization
- 4.11 Industry Developments and Announcements
Chapter 5 Indonesia Textile Market Production, Supply and Demand Analysis
- 5.1 Demand Trend and Consumption Analysis, 2018-2025
- 5.2 Demand Forecast, 2025-2035
- 5.3 Production and Output Trend, 2018-2025
- 5.4 Production and Output Forecast, 2025-2035
- 5.5 Installed Capacity and Capacity Utilization
- 5.6 Company-Wise Production Plants and Statistics
- 5.6.1 Installed Production Capacity
- 5.6.2 Actual Production
- 5.6.3 Planned Capacity and Expansion Targets
- 5.7 Supply Chain Structure and Procurement Trends
- 5.8 Supply-Demand Gap and Bottlenecks
- 5.9 Import Dependence and Sourcing Structure
- 5.10 Contract Manufacturing and Outsourcing
- 5.11 Regional Supply and Demand Concentration
Chapter 6 Indonesia Textile Market Pricing Analysis
- 6.1 Pricing Structure and Measurement
- 6.2 Historical Pricing Trends, 2018-2025
- 6.3 Pricing Outlook, 2025-2035
- 6.4 Average Selling Price and Unit Economics
- 6.5 Pricing by Product and Market Segment
- 6.6 Geographic Pricing Differences
- 6.7 Key Input, Energy, Labor and Logistics Costs
- 6.8 Contract Pricing and Purchasing Models
- 6.9 Pricing Sensitivity and Competitive Positioning
- 6.10 Price, Margin and Profitability Implications
Chapter 7 Indonesia Textile Market Dynamics
- 7.1 Market Growth Drivers
- 7.1.1 Demand-Side Drivers
- 7.1.2 Technology and Innovation Drivers
- 7.1.3 Infrastructure and Investment Drivers
- 7.1.4 Regulatory and Policy Drivers
- 7.2 Market Restraints
- 7.2.1 Cost and Affordability Constraints
- 7.2.2 Technology and Adoption Barriers
- 7.2.3 Supply Chain and Operational Constraints
- 7.3 Market Challenges
- 7.3.1 Competitive Pressure and Margin Erosion
- 7.3.2 Skills, Infrastructure and Implementation Gaps
- 7.4 Emerging Market Opportunities
- 7.5 Market Dynamics Impact and Time-Horizon Assessment
Chapter 8 Indonesia Textile Value Chain Analysis
- 8.1 Industry Value Chain Overview
- 8.2 Upstream Suppliers and Critical Inputs
- 8.3 Technology and Component Providers
- 8.4 Manufacturing or Service Delivery
- 8.5 Distribution, Channel Partners and Integrators
- 8.6 Downstream Applications and End Users
- 8.7 Value Addition and Profit Pools
- 8.8 Vertical Integration and Outsourcing
- 8.9 Supplier Concentration and Risk
- 8.10 Supply Chain Localization and Resilience
Chapter 9 Indonesia Textile Market Regulations and Policies
- 9.1 Relevant Laws, Standards and Compliance Frameworks
- 9.2 Product, Service, Safety and Quality Requirements
- 9.3 Government Policies, Incentives and Subsidies
- 9.4 Imports, Exports and Trade Barriers
- 9.5 Public Procurement and Local Content Requirements
- 9.6 Environmental and Sustainability Compliance
- 9.7 Upcoming Policy Changes and Market Implications
Chapter 10 Indonesia Textile Market Hotspots and Opportunities
- 10.1 Market Opportunity Mapping and Growth Hotspots
- 10.2 High-Growth Applications and Customer Groups
- 10.3 Underserved Markets and White-Space Opportunities
- 10.4 Emerging Technology and Product Opportunities
- 10.5 New Capacity and Investment Hotspots
- 10.6 Market Entry and Expansion Opportunities
- 10.7 Distribution and Partnership Opportunities
- 10.8 Near-Term and Long-Term Commercial Potential
- 10.9 Opportunity Attractiveness and Execution Risks
Chapter 11 Indonesia Textile Market Outlook, 2025-2035
- 11.1 Market Size and Analysis
- 11.1.1 Revenue (Market Measurement: 2025: USD 14.39 billion → 2035: USD 22.87 billion)
- 11.1.2 Market Volume and Quantity Sold
- 11.1.3 Historical Market Size, 2018-2025
- 11.1.4 Base-Year Market Size, 2025
- 11.2 Market Forecast, 2025-2035
- 11.2.1 Revenue Forecast to 2035
- 11.2.2 Volume Forecast to 2035
- 11.2.3 CAGR and Year-on-Year Growth
- 11.2.4 Incremental Revenue Opportunity
- 11.3 Forecast Assumptions and Scenario Analysis
- 11.3.1 Base-Case Forecast
- 11.3.2 Optimistic and Conservative Scenarios
- 11.3.3 Technology, Pricing and Policy Sensitivities
- 11.4 Market Attractiveness and Growth Outlook
Chapter 12 Indonesia Textile Market Segmentation and Outlook
- 12.1 Segmentation Summary and Market Shares, 2025
- 12.2 Largest and Fastest-Growing Segments
- 12.3 By Product Type - Market Size and Forecast, 2025-2035
- 12.3.1 Segment Definition and Scope
- 12.3.2 Historical Market Size, 2018-2025
- 12.3.3 Revenue Forecast, 2025-2035
- 12.3.4 Volume Forecast, 2025-2035
- 12.3.5 Base-Year Market Share, 2025
- 12.3.6 Segment CAGR and Growth Drivers
- 12.3.7 Subsegment Market Size and Forecast
- 12.3.7.1 Cotton-based Textiles
- 12.3.7.2 Man-made Fiber Textiles
- 12.3.7.3 Blended Textiles
- 12.3.7.4 Nonwoven & Technical Textiles
- 12.3.8 Subsegment Pricing and Adoption Trends
- 12.3.9 Leading Suppliers and Competition
- 12.3.10 Regional Demand and Opportunities
- 12.4 By End-Use Industry - Market Size and Forecast, 2025-2035
- 12.4.1 Segment Definition and Scope
- 12.4.2 Historical Market Size, 2018-2025
- 12.4.3 Revenue Forecast, 2025-2035
- 12.4.4 Volume Forecast, 2025-2035
- 12.4.5 Base-Year Market Share, 2025
- 12.4.6 Segment CAGR and Growth Drivers
- 12.4.7 Subsegment Market Size and Forecast
- 12.4.7.1 Apparel & Fashion Manufacturing
- 12.4.7.2 Home Furnishing & Interior Textiles
- 12.4.7.3 Automotive & Transportation
- 12.4.7.4 Healthcare & Protective Products
- 12.4.8 Subsegment Pricing and Adoption Trends
- 12.4.9 Leading Suppliers and Competition
- 12.4.10 Regional Demand and Opportunities
- 12.5 By Technology - Market Size and Forecast, 2025-2035
- 12.5.1 Segment Definition and Scope
- 12.5.2 Historical Market Size, 2018-2025
- 12.5.3 Revenue Forecast, 2025-2035
- 12.5.4 Volume Forecast, 2025-2035
- 12.5.5 Base-Year Market Share, 2025
- 12.5.6 Segment CAGR and Growth Drivers
- 12.5.7 Subsegment Market Size and Forecast
- 12.5.7.1 Ring & Compact Spinning
- 12.5.7.2 Air-Jet & Rapier Weaving
- 12.5.7.3 Circular & Warp Knitting
- 12.5.7.4 Digital Dyeing, Printing & Finishing
- 12.5.8 Subsegment Pricing and Adoption Trends
- 12.5.9 Leading Suppliers and Competition
- 12.5.10 Regional Demand and Opportunities
- 12.6 Segment Growth Comparison
- 12.7 Segment Attractiveness and Priority Matrix
Chapter 13 Indonesia Textile End-Use and Application Market Outlook
- 13.1 End-Use Industry and Customer Demand Structure
- 13.2 Leading Applications and Customer Groups
- 13.3 End-Use Market Size, Share and Forecast
- 13.4 Major End-Use Industry Deep Dives
- 13.4.1 Customer Requirements and Use Cases
- 13.4.2 Demand and Replacement Cycles
- 13.4.3 Technical and Regulatory Considerations
- 13.4.4 Purchasing and Procurement Models
- 13.4.5 Leading Vendors and Distribution Channels
- 13.4.6 Forecast and Commercial Opportunities
- 13.5 Emerging Applications and Cross-Segment Demand
- 13.6 End-Use Industry Investment Priorities
Chapter 14 Indonesia Textile Geographic Market Outlook, 2025-2035
- 14.1 Domestic Market Distribution and Demand Clusters
- 14.2 State- or Province-Wise Market Size and Forecast, 2025-2035
- 14.3 City and Metropolitan Market Outlook
- 14.4 Industrial, Manufacturing and Commercial Clusters
- 14.5 Geographic Concentration of Key End Users
- 14.6 Local Pricing and Purchasing Differences
- 14.7 Domestic Production Facilities and Capacity Map
- 14.8 Local Infrastructure and Project Pipeline
- 14.9 State-Level Policy and Incentive Differences
- 14.10 Subnational Investment Hotspots and Opportunities
- 14.11 Distribution and Logistics Networks
- 14.12 Domestic Competitive Footprint
Chapter 15 Indonesia Textile Technology, Innovation and Sustainability Outlook
- 15.1 Technology Landscape and Maturity
- 15.2 Product, Process and Service Innovation
- 15.3 AI, Automation and Digital Tools in the Industry
- 15.4 Technology Adoption and Performance Benchmarking
- 15.5 Innovation Pipeline and R&D Investment
- 15.6 Patent and Intellectual Property Trends
- 15.7 Energy Efficiency and Resource Management
- 15.8 Sustainability, Recycling and Circularity
- 15.9 Technology Roadmap, 2025-2035
- 15.10 Risks of Obsolescence and Technology Substitution
Chapter 16 Indonesia Textile Market Key Strategic Imperatives
- 16.1 Growth and Market Entry Priorities
- 16.2 High-Return Products and Segments
- 16.3 Pricing, Profitability and Cost Optimization
- 16.4 Technology Investment and Product Differentiation
- 16.5 Supply Chain Localization and Resilience
- 16.6 Distribution and Customer Acquisition
- 16.7 Partnership, Acquisition and Capacity Strategy
- 16.8 Regional Expansion Priorities
- 16.9 Short-, Medium- and Long-Term Actions
Chapter 17 Competition Outlook
- 17.1 Industry Competition Characteristics
- 17.2 Market Structure and Concentration
- 17.3 Market Share and Competitive Positioning, 2025
- 17.4 Company-Wise Revenue and Product Benchmarking
- 17.5 Production and Service Capacity Benchmarking
- 17.6 Technology, Pricing and Differentiation
- 17.7 Regional Footprint and Distribution Strength
- 17.8 Mergers, Acquisitions and Strategic Alliances
- 17.9 New Entrants and Competitive Threats
- 17.10 Porter's Five Forces and Industry Attractiveness
- 17.11 Competitive Outlook, 2025-2035
Chapter 18 Company Profiles
- 18.1 Company Coverage and Selection Criteria
- 18.2 PT Kahatex
- 18.2.1 Business Description
- 18.2.2 Company Ownership and Geographic Presence
- 18.2.3 Product and Service Portfolio
- 18.2.4 Manufacturing and Operating Footprint
- 18.2.5 Production Capacity and Expansion Plans
- 18.2.6 Financial Performance and Investment
- 18.2.7 Market Share and Competitive Position
- 18.2.8 Technology and Innovation Capabilities
- 18.2.9 Strategic Alliances or Partnerships
- 18.2.10 Recent Developments
- 18.2.11 Growth Strategy and Outlook
- 18.3 Duniatex Group
- 18.4 PT Indorama Synthetics Tbk
- 18.5 PT Asia Pacific Fibers Tbk
- 18.6 PT Indonesia Toray Synthetics
- 18.7 PT Tifico Fiber Indonesia Tbk
- 18.8 PT Dan Liris
- 18.9 PT Trisula Textile Industries Tbk
- 18.10 PT Ever Shine Tex Tbk
- 18.11 PT Indonesia Synthetic Textile Mills
- 18.12 Other Relevant Market Participants
Note: Every listed company is profiled on the structure shown under the first company. The company list is preliminary and may change based on research findings, market developments, data availability and client requirements.
Chapter 19 Disclaimer
- 19.1 Research and Forecast Disclaimer
- 19.2 Data Source and Estimation Limitations
Note: The depth of individual sections depends on data availability for this market. Volume, capacity, trade and other unit-based metrics are included where applicable.

