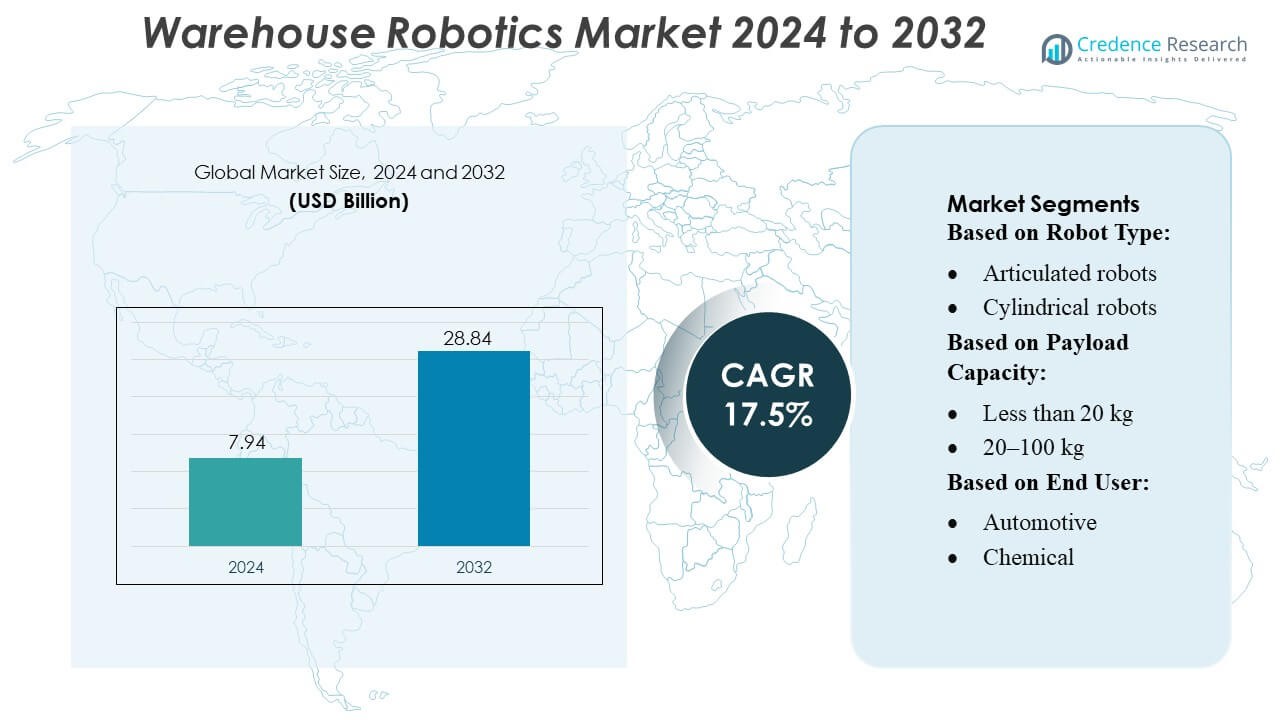
Warehouse Robotics Market By Price Range (Low, Medium, High)-Growth, Future Prospects & Competitive Analysis, 2016 – 2030

Price: $4999

Published: | Report ID: 21077 | Report Format : PDF

Market Insights

  • The worldwide warehouse robotics marketplace is projected to attain USD 15,614.36 million by 2030, with a CAGR of 18.06% from 2023-2030.
  • In 2022, North America accounted for approximately 25% of the market proportion, indicating the region’s significant presence in adopting warehouse robotics.
  • Mobile robots dominated the marketplace in 2022, holding the best market percentage. These flexible robots can navigate dynamic warehouse environments, making them perfect for various applications.
  • Pick and place operations held over 30% share in 2022, highlighting the importance of efficient and accurate product dealing in warehouse operations.
  • The e-commerce section occupied over 25% in 2022, driven with the aid of the exponential growth of online retail and the need for short-order success to meet customer expectations.
  • Warehouse robots weighing beneath 10 kg accounted for the best revenue share in 2022, reflecting their suitability for an extensive range of tasks even as being cost-effective and smooth to install.

Warehouse-Robotics-Market

Executive Summary

Market Definition

The international warehouse robotics market is witnessing significant growth, driven by growing exertions costs, e-commerce, advancements in robotics generation, and the need for improved warehouse performance and accuracy.

However, the market faces challenges related to high implementation costs, resistance to change, and integration complexities. Despite those restraints, opportunities lie in developing collaborative robotics systems, integrating IoT and cloud computing, and expanding warehouse automation in emerging markets. Adopting robotics-as-a-service models and using robotics for stock tracking, predictive maintenance, and data analytics further open avenues for market growth.

Warehouse Robotics Market

Market Overview

The warehouse robotics marketplace is experiencing a substantial growth as companies across industries understand the benefits of automation in warehouse operations. Warehouse robots can carry out various obligations, such as material handling, sorting, order selecting, packaging, and inventory management, with higher accuracy and more efficiently than manual labor.

The marketplace is witnessing a surge in demand, especially in areas like North America, driven by the need to optimize warehouse space, enhance productiveness, and meet the developing demands of the e-commerce sector.

Design Element 2

Access crucial information at unmatched prices!

Request your free sample report today & start making informed decisions powered by Credence Research!

Download Free Sample
CTA Design Element 3

Key Highlights of the Report

The worldwide warehouse robotics marketplace is projected to attain USD 15,614.36 million by 2030, with a CAGR of 18.06% from 2023-2030. In 2022, North America accounted for approximately 25% of the market proportion, indicating the region’s significant presence in adopting warehouse robotics.

Mobile robots dominated the marketplace in 2022, holding the best market percentage. These flexible robots can navigate dynamic warehouse environments, making them perfect for various applications. Pick and place operations held over 30% share in 2022, highlighting the importance of efficient and accurate product dealing in warehouse operations.

The e-commerce section occupied over 25% in 2022, driven with the aid of the exponential growth of online retail and the need for short-order success to meet customer expectations. Warehouse robots weighing beneath 10 kg accounted for the best revenue share in 2022, reflecting their suitability for an extensive range of tasks even as being cost-effective and smooth to install.

What Are the Main Drivers of the Warehouse Robotics Market?

The main drivers of the Warehouse Robotics Market include the increasing labor costs and the need for higher productivity, and efficiency in warehouses, the growth of e-commerce, and the need for quick order fulfillment, advancements in robotics technology, inclusive of artificial intelligence, machine learning, and computer vision, focus on reducing errors and improving accuracy in warehouse operations, optimization of warehouse space and inventory management, and rising demand for automation solutions in emerging economies.

What Are The Major Challenges Faced By the Warehouse Robotics Market?

The major challenges faced by the Warehouse Robotics Market include the high implementation and maintenance costs of robotic systems, concerns over job displacement and resistance to change, complex integration and interoperability challenges with existing warehouse systems, lack of skilled workforce to operate and maintain robotic systems, and regulatory and safety compliance challenges.

What Are The Growth Opportunities In the Warehouse Robotics Market?

The growth opportunities in the Warehouse Robotics Market include the development of collaborative robotics systems that work alongside human workers, integration of Internet of Things (IoT) and cloud computing technologies with warehouse robotics, expansion of warehouse automation in emerging markets, adoption of robotics-as-a-service (RaaS) models, allowing smaller businesses to access robotics solutions, and the use of robotics for inventory tracking, predictive maintenance, and data analytics.

Increasing Labor Costs and the Need for Higher Productivity and Efficiency in Warehouses

With growing labor costs, companies seek to reduce manual labor and improve warehouse productiveness. Warehouse robotics provides the benefit of faster and more accurate operations, permitting companies to fulfill growing order volumes effectively.

By automating repetitive and demanding obligations, warehouse robots free up human workers to focus on more complicated and value added activities, improving productivity and reducing operational costs.

Growth of E-trade and the Need for Quick Order Fulfillment

The speedy growth of the e-commerce sector has created a demand for efficient order success procedures. Warehouse robots permit quick and accurate selection, sorting, and packaging of orders and supporting agencies to meet tight transport deadlines.

These robots can navigate through crowded warehouse environments, find products effectively, and optimize order success, resulting in improved customer satisfaction and increased competitiveness in the e-commerce marketplace.

Advancements in Robotics Technology, inclusive of Artificial Intelligence, Machine Learning, and Computer Vision

Technological improvements have notably improved the capabilities of warehouse robotics. Artificial intelligence (AI), machine learning (ML), and computer vision permit robots to perceive their environment, make knowledgeable selections, and adapt to dynamic environments.

AI-powered robots can study past experiences, optimize their routes, and improve performance. Integrating these advanced technologies with warehouse robotics results in more intelligent and autonomous operations, enhancing performance and accuracy.

Focus on Reducing Errors and Improving Accuracy in Warehouse Operations

Manual handling of warehouse goods can result in mistakes, such as misplaced items, inaccurate picking, and erroneous inventory management. Warehouse robots provide better precision and accuracy, minimizing mistakes and improving operational performance.

By leveraging computer vision and barcode scanning technologies, robots can pick out and locate items accurately, lowering the threat of mistakes and optimizing order accuracy. This accuracy translates into enhanced client satisfaction and reduced expenses associated with returns and replacements.

Optimization of Warehouse Space and Inventory Management

Efficient warehouse space utilization and effective stock management are crucial for companies to streamline operations and maximize profitability. Warehouse robots can operate in slender aisles and use vertical areas, increasing space utilization.

These robots also can automate stock monitoring and management, offering real-time visibility into stock levels and reducing the threat of stockouts or extra inventory. Businesses can improve operational performance and reduce costs by optimizing space and inventory.

Rising Demand for Automation Solutions in Emerging Economies

Emerging economies, including China, India, Brazil, and South Africa, are witnessing speedy industrialization and improved adoption of automation solutions in diverse sectors. The growing e-commerce market and the need for efficient logistics operations drive the demand for warehouse robotics in these regions.

Furthermore, supplying a skilled group of workers and favorable government initiatives to promote automation facilitate the adoption of warehouse robots, developing extensive growth opportunities.

High Initial Implementation and Maintenance Costs of Robotics Systems

One of the main challenges in adopting warehouse robotics is the high preliminary funding required for system implementation. The cost of buying robots, integrating them into existing warehouse infrastructure, and educating staff can be tremendous.

Additionally, ongoing maintenance costs and the need for technical support add to the overall costs. These excessive costs pose a big barrier for small and medium-sized firms (SMEs) and restrict the widespread adoption of robotics in warehouses.

Concerns over Job Displacement and Resistance to Change

Automating warehouse operations increases issues about job displacement and the impact on the workforce. While robots can take care of repetitive and physically demanding obligations, there’s a fear of job losses for manual laborers.

Resistance to change and the need to upskill or reskill the present workforce to operate and maintain robotics systems similarly obstruct the adoption of warehouse robots. Companies need to deal with these fears by offering education programs and focusing on the collaboration between people and robots, emphasizing the augmentation of human skills in preference to a complete alternative.

Complex Integration and Interoperability Challenges with Existing Warehouse Systems

Many warehouses already have installed structures and infrastructure in place, making the integration of robotics technology complicated. Compatibility issues, loss of standardization, and the need for interoperability with current warehouse management systems pose challenges in deploying robotics solutions.

Companies need to make seamless integration among robots and other warehouse systems to leverage the overall potential of automation. Collaboration with system integrators and robotics manufacturers will become critical to overcome these integration challenges.

Lack of Skilled Workforce to Operate and Maintain Robotics Systems

Successfully implementing and operating warehouse robots require a skilled group of workers capable of coping with robotics systems and addressing technical troubles. However, skilled personnel who understand robotics technology, AI, and machine learning are in short supply.

Training the existing staff or recruiting new talent with the desired talent sets can be time-consuming and resource-extensive. This shortage of skilled employees hinders the adoption of robotics solutions, particularly in regions with limited access to specialized education programs.

Regulatory and Safety Compliance Challenges

The use of warehouse robots necessitates compliance with safety rules to ensure the well-being of workers and the seamless integration of robots into warehouse environments. Compliance with safety requirements and guidelines and ISO 10218 and ANSI/RIA R15.06 may be complicated and require additional safety measures and equipment investments.

Companies must ensure their robotics systems meet safety necessities and set protocols for secure human-robotic collaboration. Compliance with regulatory frameworks is critical for warehouse robotics’s widespread recognition and adoption.

Development of Collaborative Robotics Systems that Work Alongside Human Workers

Collaborative robots, also known as cobots, offer significant possibilities for enhancing warehouse operations by working alongside human employees. These robots are designed to collaborate with human beings, combining their strengths to optimize productivity and safety.

Cobots can manage repetitive duties, assist in heavy lifting, and perform difficult operations under human supervision. Developing and deploying collaborative robotics structures open new avenues for efficient and secure human-robot collaboration, improving warehouse productivity and employee satisfaction.

Integration of Internet of Things (IoT) and Cloud Computing Technologies with Warehouse Robotics

Integrating IoT and cloud computing technologies with warehouse robotics gives huge opportunities for enhancing operational performance and data-driven decision-making. IoT enables real-time connectivity between robots, sensors, and different devices, allowing seamless communication and data exchange.

This connectivity allows predictive maintenance, remote monitoring, and enhanced robotic coordination. Cloud computing allows data storage, analysis, and scalability, allowing companies to leverage big data analytics to optimize warehouse operations. Integrating those technologies unlocks the capability for smart and interconnected warehouse ecosystems, driving operational excellence.

Expansion of Warehouse Automation in Emerging Markets

With their swiftly developing industrial sectors and growing awareness of automation, emerging markets present considerable opportunities for the warehouse robotics marketplace. Adopting warehouse robots in these markets can assist in overcoming labor shortages, enhance operational efficiency, and meet the growing demands of e-commerce.

The availability of a skilled workforce, government initiatives to promote automation, and large manufacturing and logistics hubs make emerging markets appealing for warehouse robotics companies. By capitalizing on those opportunities, companies can enlarge their presence and benefit competitively in these evolving markets.

Adoption of Robotics-as-a-Service (RaaS) Models, Allowing Smaller Businesses to Access Robotics Solutions

Adopting robotics-as-a-provider (RaaS) models allows smaller businesses to access robotics solutions without sizeable upfront investments. RaaS lets corporations lease robots and related software, buying them on a subscription or usage-based version.

This model reduces the financial burden on smaller enterprises and allows them to use automation technology. RaaS additionally gives flexibility in scaling operations, as businesses can easily alter their robotic fleet in keeping with their changing requirements. Adopting RaaS models broadens warehouse robotics companies’ client base and contributes to marketplace growth.

Use of Robotics for Inventory Tracking, Predictive Maintenance, and Data Analytics

Warehouse robots can contribute beyond conventional material handling tasks by enabling inventory monitoring, predictive maintenance, and data analytics. Robots can track inventory in real time via integrating sensors and RFID technology, providing accurate visibility into stock levels, locations, and conditions.

Predictive maintenance algorithms can be employed to display the health of robot structures, enabling proactive maintenance and minimizing downtime. Furthermore, robots generate huge amounts of data during their operations, which can be analyzed to derive treasured insights for procedure optimization, demand forecasting, and decision-making.

Using robotics for these extra features enhances operational performance, cost-effectiveness, and warehouse strategic planning.

Competitive Landscape

The global warehouse robotics market is notably competitive, with numerous established players and a developing number of startups coming into the market. Key players in the enterprise consist of KUKA AG, ABB Ltd., Fanuc Corporation, Yaskawa Electric Corporation, and Amazon Robotics.

These companies are focused on continuous innovation, product improvement, and strategic collaborations to preserve their market position and gain a competitive advantage. Partnerships with systems integrators, software program companies, and end-users are common strategies market players adopt to enhance their offerings and expand their consumer base.

The market’s competitive landscape is characterized by intense rivalry, technological advancements, and focus on delivering complete solutions that cater to specific industry requirements.

Key Players

The Warehouse Robotics market is highly competitive, with several key players. Some of the major players in the market and their market share are as follows:

  • Amazon Robotics
  • KUKA AG
  • Fetch Robotics
  • Daifuku Co., Ltd.
  • Honeywell Intelligrated
  • Fanuc Corporation
  • GreyOrange

These are only some examples of the key players within the warehouse robotics marketplace. Other notable corporations include ABB, Yaskawa Electric Corporation, SSI SCHAEFER, and Swisslog. The market is characterized by ongoing innovation, strategic partnerships, and mergers and acquisitions as businesses attempt to extend their product portfolios and stay ahead of the competition.

Summary of Key Findings

  • The global warehouse robotics marketplace is projected to attain USD 15,614.36 million by 2030, with a CAGR of 18.06% from 2023-2030.
  • Mobile robots dominated the marketplace in 2022, accounting for the best market share, even as pick and place operations held over 30% share.
  • E-commerce emerged as a significant segment, occupying over 25% proportion in 2022, driven by the growth of online retail and the need for quick order fulfillment.
  • Warehouse robots weighing below 10 kg generated the highest sales proportion in 2022, highlighting their suitability for numerous applications.
  • The marketplace faces challenges, including high initial implementation costs, concerns over job displacement, integration complexities, lack of skilled workers, and regulatory compliance.
  • Opportunities lie in developing collaborative robotics, integrating IoT and cloud computing, expanding in emerging markets, adopting RaaS models, and utilizing robotics for inventory tracking, predictive maintenance, and data analytics.

Shape Your Report to Specific Countries or Regions & Enjoy 30% Off!

Future Outlook

  • The future of the warehouse robotics market seems promising, with a large growth anticipated within the coming years.
  • The growing adoption of automation solutions, advancements in robotics technology, and the need for operational efficiency will drive market growth.
  • However, companies need to deal with the challenges associated with cost, workforce, integration, and safety to unlock the complete potential of warehouse robotics.
  • Strategic partnerships, investments in research and development, and a focus on providing complete solutions tailored to specific industry needs will be important for organizations to thrive in this competitive landscape.
  • With the fast pace of technological advancements and the continuous evolution of warehouse operations, the marketplace is poised for exciting trends, reshaping how warehouses function and optimizing supply chain management.

Segmentation

By Price Range

  • Low
  • Medium
  • High

By Region

North America

  • US.
  • Canada
  • Mexico

Europe

  • Germany
  • France
  • U.K.
  • Italy
  • Spain
  • Rest of Europe

Asia Pacific

  • China
  • Japan
  • India
  • South Korea
  • South-east Asia
  • Rest of Asia Pacific

Latin America

  • Brazil
  • Argentina
  • Rest of Latin America

Middle East & Africa

  • GCC Countries
  • South Africa
  • Rest of Middle East and Africa

CHAPTER NO. 1 : INTRODUCTION 21

1.1. Report Description 21

1.1.1. Purpose of the Report 21

1.1.2. USP & Key Offerings 21

1.2. Key Benefits for Stakeholders 21

1.3. Target Audience 22

1.4. Report Scope 22


CHAPTER NO. 2 : EXECUTIVE SUMMARY 26

2.1. Warehouse Robotics Market Snapshot 26

2.2. Global Warehouse Robotics Market, 2017 – 2030 (K Units) (USD Million) 28

2.1. Insights from Primary Respondents 28


CHAPTER NO. 3 : COVID 19 IMPACT ANALYSIS 29

3.1. Impact Assessment of COVID-19 Pandemic, By Region 29


CHAPTER NO. 4 : WAREHOUSE ROBOTICS MARKET – INDUSTRY ANALYSIS 30

4.1. Introduction 30

4.2. Market Drivers 31

4.2.1. High initial implementation and maintenance costs of robotics systems 31

4.2.2. Growth of e-commerce and the need for quick order fulfillment 32

4.3. Market Restraints 32

4.3.1. Restraining Factor Analysis 32

4.4. Market Opportunities 33

4.4.1. Market Opportunity Analysis 33

4.5. Porter’s Five Forces Analysis 33

4.6. Value Chain Analysis 34


CHAPTER NO. 5 : KEY INVESTMENT POCKETS ANALYSIS 35

5.1. Top Investment Pockets 35

5.1.1.1. Warehouse Robotics Market Attractiveness Analysis, By Type 35

5.1.1.2. Warehouse Robotics Market Attractiveness Analysis, By Application 35

5.1.1.3. Warehouse Robotics Market Attractiveness Analysis, By End-user 36

5.1.1.4. Warehouse Robotics Market Attractiveness Analysis, By Payload Capacity 36

5.2. Product Life Cycle Analysis 37

5.3. Incremental Revenue Growth Opportunity, 2023 – 2030 38

5.3.1. Type 38

5.3.2. Application 38

5.3.3. End-user 39

5.3.4. Payload Capacity 39


CHAPTER NO. 6 : IMPORT EXPORT ANALYSIS 40

6.1. Import Analysis by Region 40

6.1.1. Global Warehouse Robotics Market Import Volume, By Region, 2017 – 2022 (K Units) 40

6.2. Export Analysis by Region 40

6.2.1. Global Warehouse Robotics Market Export Volume, By Region, 2017 – 2022 (K Units) 40


CHAPTER NO. 7 : DEMAND SUPPLY ANALYSIS 41

7.1. Demand Analysis by Region 41

7.1.1. Global Warehouse Robotics Market Demand Volume, By Region, 2017 – 2022 (K Units) 41

7.2. Supply Analysis by Region 41

7.2.1. Global Warehouse Robotics Market Supply Volume, By Region, 2017 – 2022 (K Units) 41


CHAPTER NO. 8 : MARKET POSITIONING OF KEY PLAYERS 42

8.1. Company Market Share Analysis –2020 and 2022 42

8.1.1. Global Warehouse Robotics Market: Company Market Share, 2022 42

8.1.2. Global Warehouse Robotics Market: Company Market Share, 2022 42

8.1. Global Warehouse Robotics Market Company Volume Market Share, 2022 43

8.2. Global Warehouse Robotics Market Company Revenue Market Share, 2022 44

8.3. Market Position of Key Players 2022 45

8.3.1. Market Position of Key Players, 2022 45

8.4. Strategic Developments 46

8.4.1. Acquisitions & Mergers 46

8.4.2. New Product Launch 46

8.4.3. Regional Expansion 46


CHAPTER NO. 9 : WAREHOUSE ROBOTICS MARKET – BY TYPE SEGMENT ANALYSIS 47

9.1. Warehouse Robotics Market Overview, by Type Segment 47

9.1.1. Global Warehouse Robotics Market Volume Share, By Type, 2022 & 2030 48

9.1.2. Global Warehouse Robotics Market Revenue Share, By Type, 2022 & 2030 48

9.2. Fixed Robots 49

9.2.1. Global Fixed Robots Warehouse Robotics Market Volume, By Region, 2017 – 2022 (K Units) 49

9.2.2. Global Fixed Robots Warehouse Robotics Market Revenue, By Region, 2017 – 2022 (USD Million) 50

9.3. Mobile Robots 51

9.3.1. Global Mobile Robots Warehouse Robotics Market Volume, By Region, 2017 – 2022 (K Units) 51

9.3.2. Global Fixed Robots Warehouse Robotics Market Revenue, By Region, 2017 – 2022 (USD Million) 52

9.4. Articulated Robots 53

9.4.1. Global Articulated Robots Warehouse Robotics Market Volume, By Region, 2017 – 2022 (K Units) 53

9.4.2. Global Articulated Robots Warehouse Robotics Market Revenue, By Region, 2017 – 2022 (USD Million) 54

9.5. Cartesian Robots 55

9.5.1. Global Cartesian Robots Warehouse Robotics Market Volume, By Region, 2017 – 2022 (K Units) 55

9.5.2. Global Cartesian Robots Warehouse Robotics Market Revenue, By Region, 2017 – 2022 (USD Million) 56

9.6. Others 57

9.6.1. Global Others Warehouse Robotics Market Volume, By Region, 2017 – 2022 (K Units) 57

9.6.2. Global Others Warehouse Robotics Market Revenue, By Region, 2017 – 2022 (USD Million) 58


CHAPTER NO. 10 : WAREHOUSE ROBOTICS MARKET – BY APPLICATION SEGMENT ANALYSIS 59

10.1. Warehouse Robotics Market Overview, by Application Segment 59

10.1.1. Global Warehouse Robotics Market Volume Share, By Application, 2022 & 2030 60

10.1.2. Global Warehouse Robotics Market Revenue Share, By Application, 2022 & 2030 60

10.2. Pick & Place 61

10.2.1. Global Warehouse Robotics for Pick & Place Market Volume, By Region, 2017 – 2022 (K Units) 61

10.2.2. Global Warehouse Robotics for Pick & Place Market Revenue, By Region, 2017 – 2022 (USD Million) 62

10.3. Palletizing & Depalletizing 63

10.3.1. Global Warehouse Robotics for Palletizing & Depalletizing Market Volume, By Region, 2017 – 2022 (K Units) 63

10.3.2. Global Warehouse Robotics for Palletizing & Depalletizing Market Revenue, By Region, 2017 – 2022 (USD Million) 64

10.4. Transportation 65

10.4.1. Global Warehouse Robotics for Transportation Market Volume, By Region, 2017 – 2022 (K Units) 65

10.4.2. Global Warehouse Robotics for Transportation Market Revenue, By Region, 2017 – 2022 (USD Million) 66

10.5. Packaging 67

10.5.1. Global Warehouse Robotics for Packaging Market Volume, By Region, 2017 – 2022 (K Units) 67

10.5.2. Global Warehouse Robotics for Packaging Market Revenue, By Region, 2017 – 2022 (USD Million) 68

10.6. Others (Sorting, Assembly, etc.) 69

10.6.1. Global Warehouse Robotics for Others (Sorting, Assembly, etc.) Market Volume, By Region, 2017 – 2022 (K Units) 69

10.6.2. Global Warehouse Robotics for Others (Sorting, Assembly, etc.) Market Revenue, By Region, 2017 – 2022 (USD Million) 70


CHAPTER NO. 11 : WAREHOUSE ROBOTICS MARKET – BY END-USER SEGMENT ANALYSIS 71

11.1. Warehouse Robotics Market Overview, by End-user Segment 71

11.1.1. Global Warehouse Robotics Market Volume Share, By End-user, 2022 & 2030 72

11.1.2. Global Warehouse Robotics Market Revenue Share, By End-user, 2022 & 2030 72

11.2. E-commerce 73

11.2.1. Global E-commerce Warehouse Robotics Market Volume, By Region, 2017 – 2022 (K Units) 73

11.2.2. Global E-commerce Warehouse Robotics Market Revenue, By Region, 2017 – 2022 (USD Million) 74

11.3. Automotive 75

11.3.1. Global Automotive Warehouse Robotics Market Volume, By Region, 2017 – 2022 (K Units) 75

11.3.2. Global Automotive Warehouse Robotics Market Revenue, By Region, 2017 – 2022 (USD Million) 76

11.4. Food & Beverages 77

11.4.1. Global Food & Beverages Warehouse Robotics Market Volume, By Region, 2017 – 2022 (K Units) 77

11.4.2. Global Food & Beverages Warehouse Robotics Market Revenue, By Region, 2017 – 2022 (USD Million) 78

11.5. Pharmaceutical 79

11.5.1. Global Pharmaceutical Warehouse Robotics Market Volume, By Region, 2017 – 2022 (K Units) 79

11.5.2. Global Pharmaceutical Warehouse Robotics Market Revenue, By Region, 2017 – 2022 (USD Million) 80

11.6. Others (Retail, Electronics, etc.) 81

11.6.1. Global Others (Retail, Electronics, etc.) Warehouse Robotics Market Volume, By Region, 2017 – 2022 (K Units) 81

11.6.2. Global Others (Retail, Electronics, etc.) Warehouse Robotics Market Revenue, By Region, 2017 – 2022 (USD Million) 82


CHAPTER NO. 12 : WAREHOUSE ROBOTICS MARKET – BY PAYLOAD CAPACITY SEGMENT ANALYSIS 83

12.1. Warehouse Robotics Market Overview, by Payload Capacity Segment 83

12.1.1. Global Warehouse Robotics Market Revenue Share, By Payload Capacity, 2022 & 2030 84

12.1.2. Global Warehouse Robotics Market Revenue Share, By Payload Capacity, 2022 & 2030 84

12.2. Below 10 kg 85

12.2.1. Global Below 10 kg Warehouse Robotics Market Volume, By Region, 2017 – 2022 (K Units) 85

12.2.2. Global Below 10 kg Warehouse Robotics Market Revenue, By Region, 2017 – 2022 (USD Million) 86

12.3. 11 kg to 80 kg 87

12.3.1. Global 11 kg to 80 kg Warehouse Robotics Market Volume, By Region, 2017 – 2022 (K Units) 87

12.3.2. Global 11 kg to 80 kg Warehouse Robotics Market Revenue, By Region, 2017 – 2022 (USD Million) 88

12.4. 81 kg to 400 kg 89

12.4.1. Global 81 kg to 400 kg Warehouse Robotics Market Volume, By Region, 2017 – 2022 (K Units) 89

12.4.2. Global 81 kg to 400 kg Warehouse Robotics Market Revenue, By Region, 2017 – 2022 (USD Million) 90

12.5. 401 kg to 900 kg 91

12.5.1. Global 401 kg to 900 kg Warehouse Robotics Market Volume, By Region, 2017 – 2022 (K Units) 91

12.5.2. Global 401 kg to 900 kg Warehouse Robotics Market Revenue, By Region, 2017 – 2022 (USD Million) 92

12.6. Above 900 kg 93

12.6.1. Global Above 900 kg Warehouse Robotics Market Volume, By Region, 2017 – 2022 (K Units) 93

12.6.2. Global Above 900 kg Warehouse Robotics Market Revenue, By Region, 2017 – 2022 (USD Million) 94


CHAPTER NO. 13 : WAREHOUSE ROBOTICS MARKET – REGIONAL ANALYSIS 95

13.1. Warehouse Robotics Market Overview, by Region Segment 95

13.1.1. Global Warehouse Robotics Market Volume Share, By Region, 2022 & 2030 96

13.1.2. Global Warehouse Robotics Market Revenue Share, By Region, 2022 & 2030 96

13.1.3. Global Warehouse Robotics Market Volume, By Region, 2017 – 2022 (K Units) 97

13.1.4. Global Warehouse Robotics Market Revenue, By Region, 2017 – 2022 (USD Million) 98

13.1.5. Global Warehouse Robotics Market Volume, By Type, 2017 – 2022 (K Units) 99

13.1.6. Global Warehouse Robotics Market Revenue, By Type, 2017 – 2022 (USD Million) 100

13.1.7. Global Warehouse Robotics Market Volume, By Application, 2017 – 2022 (K Units) 101

13.1.8. Global Warehouse Robotics Market Revenue, By Application, 2017 – 2022 (USD Million) 102

13.1.9. Global Warehouse Robotics Market Volume, By End-user, 2017 – 2022 (K Units) 103

13.1.10. Global Warehouse Robotics Market Revenue, By End-user, 2017 – 2022 (USD Million) 104

13.1.11. Global Warehouse Robotics Market Volume, By Payload Capacity, 2017 – 2022 (K Units) 105

13.1.12. Global Warehouse Robotics Market Revenue, By Payload Capacity, 2017 – 2022 (USD Million) 106

13.2. North America 107

13.2.1. North America Warehouse Robotics Market Volume, By Country, 2017 – 2022 (K Units) 108

13.2.2. North America Warehouse Robotics Market Revenue, By Country, 2017 – 2022 (USD Million) 108

13.2.2.1. North America Warehouse Robotics Market Volume, By Type, 2017 – 2022 (K Units) 109

13.2.3. North America Warehouse Robotics Market Revenue, By Type, 2017 – 2022 (USD Million) 110

13.2.4. North America Warehouse Robotics Market Volume, By Application, 2017 – 2022 (K Units) 111

13.2.5. North America Warehouse Robotics Market Revenue, By Application, 2017 – 2022 (USD Million) 112

13.2.6. North America Warehouse Robotics Market Volume, By End-user, 2017 – 2022 (K Units) 113

13.2.7. North America Warehouse Robotics Market Revenue, By End-user, 2017 – 2022 (USD Million) 114

13.2.8. North America Warehouse Robotics Market Volume, By Payload Capacity, 2017 – 2022 (K Units) 115

13.2.9. North America Warehouse Robotics Market Revenue, By Payload Capacity, 2017 – 2022 (USD Million) 116

13.2.10. U.S. 117

13.2.11. Canada 117

13.2.12. Mexico 117

13.3. Europe 118

13.3.1. Europe Warehouse Robotics Market Volume, By Country, 2017 – 2022 (K Units) 119

13.3.2. Europe Warehouse Robotics Market Revenue, By Country, 2017 – 2022 (USD Million) 120

13.3.3. Europe Warehouse Robotics Market Volume, By Type, 2017 – 2022 (K Units) 121

13.3.4. Europe Warehouse Robotics Market Revenue, By Type, 2017 – 2022 (USD Million) 122

13.3.5. Europe Warehouse Robotics Market Volume, By Application, 2017 – 2022 (K Units) 123

13.3.6. Europe Warehouse Robotics Market Revenue, By Application, 2017 – 2022 (USD Million) 124

13.3.7. Europe Warehouse Robotics Market Volume, By End-user, 2017 – 2022 (K Units) 125

13.3.8. Europe Warehouse Robotics Market Revenue, By End-user, 2017 – 2022 (USD Million) 126

13.3.9. Europe Warehouse Robotics Market Volume, By Payload Capacity, 2017 – 2022 (K Units) 127

13.3.10. Europe Warehouse Robotics Market Revenue, By Payload Capacity, 2017 – 2022 (USD Million) 128

13.3.11. UK 129

13.3.12. France 129

13.3.13. Germany 129

13.3.14. Italy 129

13.3.15. Spain 129

13.3.16. Russia 129

13.3.17. BENELUX 129

13.3.18. Sweden 129

13.3.19. Denmark 129

13.3.20. Poland 129

13.3.21. Austria 129

13.3.22. Rest of Europe 129

13.4. Asia Pacific 130

13.4.1. Asia Pacific Warehouse Robotics Market Volume, By Country, 2017 – 2022 (K Units) 131

13.4.2. Asia Pacific Warehouse Robotics Market Revenue, By Country, 2017 – 2022 (USD Million) 132

13.4.3. Asia Pacific Warehouse Robotics Market Volume, By Type, 2017 – 2022 (K Units) 133

13.4.4. Asia Pacific Warehouse Robotics Market Revenue, By Type, 2017 – 2022 (USD Million) 134

13.4.5. Asia Pacific Warehouse Robotics Market Volume, By Application, 2017 – 2022 (K Units) 135

13.4.6. Asia Pacific Warehouse Robotics Market Revenue, By Application, 2017 – 2022 (USD Million) 136

13.4.7. Asia Pacific Warehouse Robotics Market Volume, By End-user, 2017 – 2022 (K Units) 137

13.4.8. Asia Pacific Warehouse Robotics Market Revenue, By End-user, 2017 – 2022 (USD Million) 138

13.4.9. Asia Pacific Warehouse Robotics Market Volume, By Payload Capacity, 2017 – 2022 (K Units) 139

13.4.10. Asia Pacific Warehouse Robotics Market Revenue, By Payload Capacity, 2017 – 2022 (USD Million) 140

13.4.11. China 141

13.4.12. Japan 141

13.4.13. South Korea 141

13.4.14. India 141

13.4.15. Thailand 141

13.4.16. Indonesia 141

13.4.17. Vietnam 141

13.4.18. Malaysia 141

13.4.19. Philippines 141

13.4.20. Taiwan 141

13.4.21. Rest of Asia Pacific 141

13.5. Latin America 142

13.5.1. Latin America Warehouse Robotics Market Volume, By Country, 2017 – 2022 (K Units) 143

13.5.2. Latin America Warehouse Robotics Market Revenue, By Country, 2017 – 2022 (USD Million) 144

13.5.3. Latin America Warehouse Robotics Market Volume, By Type, 2017 – 2022 (K Units) 145

13.5.4. Latin America Warehouse Robotics Market Revenue, By Type, 2017 – 2022 (USD Million) 146

13.5.5. Latin America Warehouse Robotics Market Volume, By Application, 2017 – 2022 (K Units) 147

13.5.6. Latin America Warehouse Robotics Market Revenue, By Application, 2017 – 2022 (USD Million) 148

13.5.7. Latin America Warehouse Robotics Market Volume, By End-user, 2017 – 2022 (K Units) 149

13.5.8. Latin America Warehouse Robotics Market Revenue, By End-user, 2017 – 2022 (USD Million) 150

13.5.9. Latin America Warehouse Robotics Market Volume, By Payload Capacity, 2017 – 2022 (K Units) 151

13.5.10. Latin America Warehouse Robotics Market Revenue, By Payload Capacity, 2017 – 2022 (USD Million) 152

13.5.11. Brazil 153

13.5.12. Argentina 153

13.5.13. Colombia 153

13.5.14. Chile 153

13.5.15. Peru 153

13.5.16. Rest of Latin America 153

13.6. The Middle-East 154

13.6.1. Middle East Warehouse Robotics Market Volume, By Country, 2017 – 2022 (K Units) 155

13.6.2. Middle East Warehouse Robotics Market Revenue, By Country, 2017 – 2022 (USD Million) 156

13.6.3. Middle East Warehouse Robotics Market Volume, By Type, 2017 – 2022 (K Units) 157

13.6.4. Middle East Warehouse Robotics Market Revenue, By Type, 2017 – 2022 (USD Million) 158

13.6.5. Middle East Warehouse Robotics Market Volume, By Application, 2017 – 2022 (K Units) 159

13.6.6. Middle East Warehouse Robotics Market Revenue, By Application, 2017 – 2022 (USD Million) 160

13.6.7. Middle East Warehouse Robotics Market Volume, By End-user, 2017 – 2022 (K Units) 161

13.6.8. Middle East Warehouse Robotics Market Revenue, By End-user, 2017 – 2022 (USD Million) 162

13.6.9. Middle East Warehouse Robotics Market Volume, By Payload Capacity, 2017 – 2022 (K Units) 163

13.6.10. Middle East Warehouse Robotics Market Revenue, By Payload Capacity, 2017 – 2022 (USD Million) 164

13.6.11. GCC Countries 165

13.6.12. Israel 165

13.6.13. Turkey 165

13.6.14. Iran 165

13.6.15. Rest of Middle East & Africa 165

13.7. Africa 166

13.7.1. Africa Warehouse Robotics Market Volume, By Country, 2017 – 2022 (K Units) 167

13.7.2. Africa Warehouse Robotics Market Revenue, By Country, 2017 – 2022 (USD Million) 168

13.7.3. Africa Warehouse Robotics Market Volume, By Type, 2017 – 2022 (K Units) 169

13.7.4. Africa Warehouse Robotics Market Revenue, By Type, 2017 – 2022 (USD Million) 170

13.7.5. Africa Warehouse Robotics Market Volume, By Application, 2017 – 2022 (K Units) 171

13.7.6. Africa Warehouse Robotics Market Revenue, By Application, 2017 – 2022 (USD Million) 172

13.7.7. Africa Warehouse Robotics Market Volume, By End-user, 2017 – 2022 (K Units) 173

13.7.8. Africa Warehouse Robotics Market Revenue, By End-user, 2017 – 2022 (USD Million) 174

13.7.9. Africa Warehouse Robotics Market Volume, By Payload Capacity, 2017 – 2022 (K Units) 175

13.7.10. Africa Warehouse Robotics Market Revenue, By Payload Capacity, 2017 – 2022 (USD Million) 176

13.7.11. South Africa 177

13.7.12. Egypt 177

13.7.13. Nigeria 177

13.7.14. Algeria 177

13.7.15. Morocco 177

13.7.16. Rest of Africa 177


CHAPTER NO. 14 : COMPANY PROFILES 178

14.1. ABB Ltd. 178

14.1.1. Company Overview 178

14.1.2. Product Portfolio 178

14.1.3. Financial Overview 178

14.2. Fanuc Corporation 179

14.3. KUKA AG 179

14.4. Yaskawa Electric Corporation 179

14.5. Amazon Robotics LLC 179

14.6. Honeywell International Inc. 179

14.7. Siemens AG 179

14.8. Toshiba Corporation 179

14.9. Daifuku Co., Ltd. 179

14.10. KNAPP AG 179

14.11. Dematic GmbH 179

14.12. SSI SCHAEFER AG 179

14.13. Swisslog Holding AG 179

14.14. Omron Corporation 179

CHAPTER NO. 15 : RESEARCH METHODOLOGY 180

15.1. Research Methodology 180

15.2. Phase I – Secondary Research 181

15.3. Phase II – Data Modeling 181

15.3.1. Company Share Analysis Model 182

15.3.2. Revenue Based Modeling 182

15.4. Phase III – Primary Research 183

15.5. Research Limitations 184

15.5.1. Assumptions 184

List of Figures

FIG NO. 1. Global Warehouse Robotics Market Volume & Revenue, 2017 – 2030 (K Units) (USD Million) 28

FIG NO. 2. Porter’s Five Forces Analysis for Global Warehouse Robotics Market 33

FIG NO. 3. Value Chain Analysis for Global Warehouse Robotics Market 34

FIG NO. 4. Market Attractiveness Analysis, By Type 35

FIG NO. 5. Market Attractiveness Analysis, By Application 35

FIG NO. 6. Market Attractiveness Analysis, By End-user 36

FIG NO. 7. Market Attractiveness Analysis, By Payload Capacity 36

FIG NO. 8. Product Life Cycle Analysis 37

FIG NO. 9. Incremental Revenue Growth Opportunity by Type 38

FIG NO. 10. Incremental Revenue Growth Opportunity by Application 38

FIG NO. 11. Incremental Revenue Growth Opportunity by End-user 39

FIG NO. 12. Incremental Revenue Growth Opportunity by Payload Capacity 39

FIG NO. 13. Company Share Analysis, 2020 42

FIG NO. 14. Company Share Analysis, 2022 42

FIG NO. 15. Warehouse Robotics Market – Company Volume  Market Share, 2022 43

FIG NO. 16. Warehouse Robotics Market – Company Revenue Market Share, 2022 44

FIG NO. 17. Market Position of Key Players, 2022 45

FIG NO. 18. Global Warehouse Robotics Market Volume Share, By Type, 2022 & 2030 48

FIG NO. 19. Global Warehouse Robotics Market Revenue Share, By Type, 2022 & 2030 48

FIG NO. 20. Global Warehouse Robotics Market for Fixed Robots, Volume & Revenue (K Units) (USD Million) 2017 – 2030 49

FIG NO. 21. Global Warehouse Robotics Market for Mobile Robots, Volume & Revenue (K Units) (USD Million) 2017 – 2030 51

FIG NO. 22. Global Warehouse Robotics Market for Articulated Robots, Volume & Revenue (K Units) (USD Million) 2017 – 2030 53

FIG NO. 23. Global Warehouse Robotics Market for Cartesian Robots, Volume & Revenue (K Units) (USD Million) 2017 – 2030 55

FIG NO. 24. Global Warehouse Robotics Market for Others, Volume & Revenue (K Units) (USD Million) 2017 – 2030 57

FIG NO. 25. Global Warehouse Robotics Market Volume Share, By Application, 2022 & 2030 60

FIG NO. 26. Global Warehouse Robotics Market Revenue Share, By Application, 2022 & 2030 60

FIG NO. 27. Global Warehouse Robotics Market for Pick & Place, Volume & Revenue (K Units) (USD Million) 2017 – 2030 61

FIG NO. 28. Global Warehouse Robotics Market for Palletizing & Depalletizing, Volume & Revenue (K Units) (USD Million) 2017 – 2030 63

FIG NO. 29. Global Warehouse Robotics Market for Transportation, Volume & Revenue (K Units) (USD Million) 2017 – 2030 65

FIG NO. 30. Global Warehouse Robotics Market for Packaging, Volume & Revenue (K Units) (USD Million) 2017 – 2030 67

FIG NO. 31. Global Warehouse Robotics Market for Others (Sorting, Assembly, etc.), Volume & Revenue (K Units) (USD Million) 2017 – 2030 69

FIG NO. 32. Global Warehouse Robotics Market Volume Share, By End-user, 2022 & 2030 72

FIG NO. 33. Global Warehouse Robotics Market Revenue Share, By End-user, 2022 & 2030 72

FIG NO. 34. Global Warehouse Robotics Market for E-commerce, Volume & Revenue (K Units) (USD Million) 2017 – 2030 73

FIG NO. 35. Global Warehouse Robotics Market for Automotive, Volume & Revenue (K Units) (USD Million) 2017 – 2030 75

FIG NO. 36. Global Warehouse Robotics Market for Food & Beverages, Volume & Revenue (K Units) (USD Million) 2017 – 2030 77

FIG NO. 37. Global Warehouse Robotics Market for Pharmaceutical, Volume & Revenue (K Units) (USD Million) 2017 – 2030 79

FIG NO. 38. Global Warehouse Robotics Market for Others (Retail, Electronics, etc.), Volume & Revenue (K Units) (USD Million) 2017 – 2030 81

FIG NO. 39. Global Warehouse Robotics Market Revenue Share, By Payload Capacity, 2022 & 2030 84

FIG NO. 40. Global Warehouse Robotics Market Revenue Share, By Payload Capacity, 2022 & 2030 84

FIG NO. 41. Global Warehouse Robotics Market for Below 10 kg, Volume & Revenue (K Units) (USD Million) 2017 – 2030 85

FIG NO. 42. Global Warehouse Robotics Market for 11 kg to 80 kg, Volume & Revenue (K Units) (USD Million) 2017 – 2030 87

FIG NO. 43. Global Warehouse Robotics Market for 81 kg to 400 kg, Volume & Revenue (K Units) (USD Million) 2017 – 2030 89

FIG NO. 44. Global Warehouse Robotics Market for 401 kg to 900 kg, Volume & Revenue (K Units) (USD Million) 2017 – 2030 91

FIG NO. 45. Global Warehouse Robotics Market for Above 900 kg, Volume & Revenue (K Units) (USD Million) 2017 – 2030 93

FIG NO. 46. Global Warehouse Robotics Market Volume Share, By Region, 2022 & 2030 96

FIG NO. 47. Global Warehouse Robotics Market Revenue Share, By Region, 2022 & 2030 96

FIG NO. 48. North America Warehouse Robotics Market Volume & Revenue, 2017 – 2022 (K Units) (USD Million) 107

FIG NO. 49. Europe Warehouse Robotics Market Volume & Revenue, 2017 – 2022 (K Units) (USD Million) 118

FIG NO. 50. Asia Pacific Warehouse Robotics Market Volume & Revenue, 2017 – 2022 (K Units) (USD Million) 130

FIG NO. 51. Latin America Warehouse Robotics Market Volume & Revenue, 2017 – 2022 (K Units) (USD Million) 142

FIG NO. 52. The Middle-East Warehouse Robotics Market Volume & Revenue, 2017 – 2022 (K Units) (USD Million) 154

FIG NO. 53. Africa Warehouse Robotics Market Volume & Revenue, 2017 – 2022 (K Units) (USD Million) 166

FIG NO. 54. Research Methodology – Detailed View 180

FIG NO. 55. Research Methodology 181


List of Tables

TABLE NO. 1. : Global Warehouse Robotics Market: Snapshot 26

TABLE NO. 2. : Drivers for the Warehouse Robotics Market: Impact Analysis 31

TABLE NO. 3. : Restraints for the Warehouse Robotics Market: Impact Analysis 32

TABLE NO. 4. : Global Warehouse Robotics Market Import Volume, By End-user, 2017 – 2022 (K Units) 40

TABLE NO. 5. : Global Warehouse Robotics Market Export Volume, By End-user, 2017 – 2022 (K Units) 40

TABLE NO. 6. : Global Warehouse Robotics Market Demand Volume, By End-user, 2017 – 2022 (K Units) 41

TABLE NO. 7. : Global Warehouse Robotics Market Supply Volume, By End-user, 2017 – 2022 (K Units) 41

TABLE NO. 8. : Global Fixed Robots Warehouse Robotics Market Volume, By Region, 2017 – 2022 (K Units) 49

TABLE NO. 9. : Global Fixed Robots Warehouse Robotics Market Volume, By Region, 2023– 2030 (K Units) 49

TABLE NO. 10. : Global Fixed Robots Warehouse Robotics Market Revenue, By Region, 2017 – 2022 (USD Million) 50

TABLE NO. 11. : Global Fixed Robots Warehouse Robotics Market Revenue, By Region, 2023– 2030 (USD Million) 50

TABLE NO. 12. : Global Mobile Robots Warehouse Robotics Market Volume, By Region, 2017 – 2022 (K Units) 51

TABLE NO. 13. : Global Mobile Robots Warehouse Robotics Market Volume, By Region, 2023– 2030 (K Units) 51

TABLE NO. 14. : Global Fixed Robots Warehouse Robotics Market Revenue, By Region, 2017 – 2022 (USD Million) 52

TABLE NO. 15. : Global Fixed Robots Warehouse Robotics Market Revenue, By Region, 2023– 2030 (USD Million) 52

TABLE NO. 16. : Global Articulated Robots Warehouse Robotics Market Volume, By Region, 2017 – 2022 (K Units) 53

TABLE NO. 17. : Global Articulated Robots Warehouse Robotics Market Volume, By Region, 2023– 2030 (K Units) 53

TABLE NO. 18. : Global Articulated Robots Warehouse Robotics Market Revenue, By Region, 2017 – 2022 (USD Million) 54

TABLE NO. 19. : Global Articulated Robots Warehouse Robotics Market Revenue, By Region, 2023– 2030 (USD Million) 54

TABLE NO. 20. : Global Cartesian Robots Warehouse Robotics Market Revenue, By Region, 2017 – 2022 (USD Million) 55

TABLE NO. 21. : Global Cartesian Robots Warehouse Robotics Market Volume, By Region, 2023– 2030 (K Units) 55

TABLE NO. 22. : Global Cartesian Robots Warehouse Robotics Market Revenue, By Region, 2017 – 2022 (USD Million) 56

TABLE NO. 23. : Global Cartesian Robots Warehouse Robotics Market Revenue, By Region, 2023– 2030 (USD Million) 56

TABLE NO. 24. : Global Others Warehouse Robotics Market Volume, By Region, 2017 – 2022 (K Units) 57

TABLE NO. 25. : Global Others Warehouse Robotics Market Volume, By Region, 2023– 2030 (K Units) 57

TABLE NO. 26. : Global Others Warehouse Robotics Market Revenue, By Region, 2017 – 2022 (USD Million) 58

TABLE NO. 27. : Global Others Warehouse Robotics Market Revenue, By Region, 2023– 2030 (USD Million) 58

TABLE NO. 28. : Global Warehouse Robotics for Pick & Place Market Volume, By Region, 2017 – 2022 (K Units) 61

TABLE NO. 29. : Global Warehouse Robotics for Pick & Place Market Volume, By Region, 2023– 2030 (K Units) 61

TABLE NO. 30. : Global Warehouse Robotics for Pick & Place Market Revenue, By Region, 2017 – 2022 (USD Million) 62

TABLE NO. 31. : Global Warehouse Robotics for Pick & Place Market Revenue, By Region, 2023– 2030 (USD Million) 62

TABLE NO. 32. : Global Warehouse Robotics for Palletizing & Depalletizing Market Volume, By Region, 2017 – 2022 (K Units) 63

TABLE NO. 33. : Global Warehouse Robotics for Palletizing & Depalletizing Market Volume, By Region, 2023– 2030 (K Units) 63

TABLE NO. 34. : Global Warehouse Robotics for Palletizing & Depalletizing Market Revenue, By Region, 2017 – 2022 (USD Million) 64

TABLE NO. 35. : Global Warehouse Robotics for Palletizing & Depalletizing Market Revenue, By Region, 2023– 2030 (USD Million) 64

TABLE NO. 36. : Global Warehouse Robotics for Transportation Market Volume, By Region, 2017 – 2022 (K Units) 65

TABLE NO. 37. : Global Warehouse Robotics for Transportation Market Volume, By Region, 2023– 2030 (K Units) 65

TABLE NO. 38. : Global Warehouse Robotics for Transportation Market Revenue, By Region, 2017 – 2022 (USD Million) 66

TABLE NO. 39. : Global Warehouse Robotics for Transportation Market Revenue, By Region, 2023– 2030 (USD Million) 66

TABLE NO. 40. : Global Warehouse Robotics for Packaging Market Volume, By Region, 2017 – 2022 (K Units) 67

TABLE NO. 41. : Global Warehouse Robotics for Packaging Market Volume, By Region, 2023– 2030 (K Units) 67

TABLE NO. 42. : Global Warehouse Robotics for Packaging Market Revenue, By Region, 2017 – 2022 (USD Million) 68

TABLE NO. 43. : Global Warehouse Robotics for Packaging Market Revenue, By Region, 2023– 2030 (USD Million) 68

TABLE NO. 44. : Global Warehouse Robotics for Others (Sorting, Assembly, etc.) Market Volume, By Region, 2017 – 2022 (K Units) 69

TABLE NO. 45. : Global Warehouse Robotics for Others (Sorting, Assembly, etc.) Market Volume, By Region, 2023– 2030 (K Units) 69

TABLE NO. 46. : Global Warehouse Robotics for Others (Sorting, Assembly, etc.) Market Revenue, By Region, 2017 – 2022 (USD Million) 70

TABLE NO. 47. : Global Warehouse Robotics for Others (Sorting, Assembly, etc.) Market Revenue, By Region, 2023– 2030 (USD Million) 70

TABLE NO. 48. : Global E-commerce Warehouse Robotics Market Volume, By Region, 2017 – 2022 (K Units) 73

TABLE NO. 49. : Global E-commerce Warehouse Robotics Market Volume, By Region, 2023– 2030 (K Units) 73

TABLE NO. 50. : Global E-commerce Warehouse Robotics Market Revenue, By Region, 2017 – 2022 (USD Million) 74

TABLE NO. 51. : Global E-commerce Warehouse Robotics Market Revenue, By Region, 2023– 2030 (USD Million) 74

TABLE NO. 52. : Global Automotive Warehouse Robotics Market Volume, By Region, 2017 – 2022 (K Units) 75

TABLE NO. 53. : Global Automotive Warehouse Robotics Market Volume, By Region, 2023– 2030 (K Units) 75

TABLE NO. 54. : Global Automotive Warehouse Robotics Market Revenue, By Region, 2017 – 2022 (USD Million) 76

TABLE NO. 55. : Global Automotive Warehouse Robotics Market Revenue, By Region, 2023– 2030 (USD Million) 76

TABLE NO. 56. : Global Food & Beverages Warehouse Robotics Market Volume, By Region, 2017 – 2022 (K Units) 77

TABLE NO. 57. : Global Food & Beverages Warehouse Robotics Market Volume, By Region, 2023– 2030 (K Units) 77

TABLE NO. 58. : Global Food & Beverages Warehouse Robotics Market Revenue, By Region, 2017 – 2022 (USD Million) 78

TABLE NO. 59. : Global Food & Beverages Warehouse Robotics Market Revenue, By Region, 2023– 2030 (USD Million) 78

TABLE NO. 60. : Global Pharmaceutical Warehouse Robotics Market Volume, By Region, 2017 – 2022 (K Units) 79

TABLE NO. 61. : Global Pharmaceutical Warehouse Robotics Market Volume, By Region, 2023– 2030 (K Units) 79

TABLE NO. 62. : Global Pharmaceutical Warehouse Robotics Market Revenue, By Region, 2017 – 2022 (USD Million) 80

TABLE NO. 63. : Global Pharmaceutical Warehouse Robotics Market Revenue, By Region, 2023– 2030 (USD Million) 80

TABLE NO. 64. : Global Others (Retail, Electronics, etc.) Warehouse Robotics Market Volume, By Region, 2017 – 2022 (K Units) 81

TABLE NO. 65. : Global Others (Retail, Electronics, etc.) Warehouse Robotics Market Volume, By Region, 2023– 2030 (K Units) 81

TABLE NO. 66. : Global Others (Retail, Electronics, etc.) Warehouse Robotics Market Revenue, By Region, 2017 – 2022 (USD Million) 82

TABLE NO. 67. : Global Others (Retail, Electronics, etc.) Warehouse Robotics Market Revenue, By Region, 2023– 2030 (USD Million) 82

TABLE NO. 68. : Global Below 10 kg Warehouse Robotics Market Volume, By Region, 2017 – 2022 (K Units) 85

TABLE NO. 69. : Global Below 10 kg Warehouse Robotics Market Volume, By Region, 2023– 2030 (K Units) 85

TABLE NO. 70. : Global Below 10 kg Warehouse Robotics Market Revenue, By Region, 2017 – 2022 (USD Million) 86

TABLE NO. 71. : Global Below 10 kg Warehouse Robotics Market Revenue, By Region, 2023– 2030 (USD Million) 86

TABLE NO. 72. : Global 11 kg to 80 kg Warehouse Robotics Market Volume, By Region, 2017 – 2022 (K Units) 87

TABLE NO. 73. : Global 11 kg to 80 kg Warehouse Robotics Market Volume, By Region, 2023– 2030 (K Units) 87

TABLE NO. 74. : Global 11 kg to 80 kg Warehouse Robotics Market Revenue, By Region, 2017 – 2022 (USD Million) 88

TABLE NO. 75. : Global 11 kg to 80 kg Warehouse Robotics Market Revenue, By Region, 2023– 2030 (USD Million) 88

TABLE NO. 76. : Global 81 kg to 400 kg Warehouse Robotics Market Volume, By Region, 2017 – 2022 (K Units) 89

TABLE NO. 77. : Global 81 kg to 400 kg Warehouse Robotics Market Volume, By Region, 2023– 2030 (K Units) 89

TABLE NO. 78. : Global 81 kg to 400 kg Warehouse Robotics Market Revenue, By Region, 2017 – 2022 (USD Million) 90

TABLE NO. 79. : Global 81 kg to 400 kg Warehouse Robotics Market Revenue, By Region, 2023– 2030 (USD Million) 90

TABLE NO. 80. : Global 401 kg to 900 kg Warehouse Robotics Market Volume, By Region, 2017 – 2022 (K Units) 91

TABLE NO. 81. : Global 401 kg to 900 kg Warehouse Robotics Market Volume, By Region, 2023– 2030 (K Units) 91

TABLE NO. 82. : Global 401 kg to 900 kg Warehouse Robotics Market Revenue, By Region, 2017 – 2022 (USD Million) 92

TABLE NO. 83. : Global 401 kg to 900 kg Warehouse Robotics Market Revenue, By Region, 2023– 2030 (USD Million) 92

TABLE NO. 84. : Global Above 900 kg Warehouse Robotics Market Volume, By Region, 2017 – 2022 (K Units) 93

TABLE NO. 85. : Global Above 900 kg Warehouse Robotics Market Volume, By Region, 2023– 2030 (K Units) 93

TABLE NO. 86. : Global Above 900 kg Warehouse Robotics Market Revenue, By Region, 2017 – 2022 (USD Million) 94

TABLE NO. 87. : Global Above 900 kg Warehouse Robotics Market Revenue, By Region, 2023– 2030 (USD Million) 94

TABLE NO. 88. : Global Warehouse Robotics Market Volume, By Region, 2017 – 2022 (K Units) 97

TABLE NO. 89. : Global Warehouse Robotics Market Volume, By Region, 2023– 2030 (K Units) 97

TABLE NO. 90. : Global Warehouse Robotics Market Revenue, By Region, 2017 – 2022 (USD Million) 98

TABLE NO. 91. : Global Warehouse Robotics Market Revenue, By Region, 2023– 2030 (USD Million) 98

TABLE NO. 92. : Global Warehouse Robotics Market Volume, By Type, 2017 – 2022 (K Units) 99

TABLE NO. 93. : Global Warehouse Robotics Market Volume, By Type, 2023– 2030 (K Units) 99

TABLE NO. 94. : Global Warehouse Robotics Market Revenue, By Type, 2017 – 2022 (USD Million) 100

TABLE NO. 95. : Global Warehouse Robotics Market Revenue, By Type, 2023– 2030 (USD Million) 100

TABLE NO. 96. : Global Warehouse Robotics Market Volume, By Application, 2017 – 2022 (K Units) 101

TABLE NO. 97. : Global Warehouse Robotics Market Volume, By Application, 2023– 2030 (K Units) 101

TABLE NO. 98. : Global Warehouse Robotics Market Revenue, By Application, 2017 – 2022 (USD Million) 102

TABLE NO. 99. : Global Warehouse Robotics Market Revenue, By Application, 2023– 2030 (USD Million) 102

TABLE NO. 100. :Global Warehouse Robotics Market Volume, By End-user, 2017 – 2022 (K Units) 103

TABLE NO. 101. :Global Warehouse Robotics Market Volume, By End-user, 2023– 2030 (K Units) 103

TABLE NO. 102. :Global Warehouse Robotics Market Revenue, By End-user, 2017 – 2022 (USD Million) 104

TABLE NO. 103. :Global Warehouse Robotics Market Revenue, By End-user, 2023– 2030 (USD Million) 104

TABLE NO. 104. :Global Warehouse Robotics Market Volume, By Payload Capacity, 2017 – 2022 (K Units) 105

TABLE NO. 105. :Global Warehouse Robotics Market Volume, By Payload Capacity, 2023– 2030 (K Units) 105

TABLE NO. 106. :Global Warehouse Robotics Market Revenue, By Payload Capacity, 2017 – 2022 (USD Million) 106

TABLE NO. 107. :Global Warehouse Robotics Market Revenue, By Payload Capacity, 2023– 2030 (USD Million) 106

TABLE NO. 108. :North America Warehouse Robotics Market Volume, By Country, 2017 – 2022 (K Units) 108

TABLE NO. 109. :North America Warehouse Robotics Market Volume, By Country, 2023– 2030 (K Units) 108

TABLE NO. 110. :North America Warehouse Robotics Market Revenue, By Country, 2017 – 2022 (USD Million) 108

TABLE NO. 111. : North America Warehouse Robotics Market Revenue, By Country, 2023– 2030 (USD Million) 108

TABLE NO. 112. :North America Warehouse Robotics Market Volume, By Type, 2017 – 2022 (K Units) 109

TABLE NO. 113. :North America Warehouse Robotics Market Volume, By Type, 2023– 2030 (K Units) 109

TABLE NO. 114. :North America Warehouse Robotics Market Revenue, By Type, 2017 – 2022 (USD Million) 110

TABLE NO. 115. :North America Warehouse Robotics Market Revenue, By Type, 2023– 2030 (USD Million) 110

TABLE NO. 116. :North America Warehouse Robotics Market Volume, By Application, 2017 – 2022 (K Units) 111

TABLE NO. 117. :North America Warehouse Robotics Market Volume, By Application, 2023– 2030 (K Units) 111

TABLE NO. 118. :North America Warehouse Robotics Market Revenue, By Application, 2017 – 2022 (USD Million) 112

TABLE NO. 119. :North America Warehouse Robotics Market Revenue, By Application, 2023– 2030 (USD Million) 112

TABLE NO. 120. :North America Warehouse Robotics Market Volume, By End-user, 2017 – 2022 (K Units) 113

TABLE NO. 121. :North America Warehouse Robotics Market Volume, By End-user, 2023– 2030 (K Units) 113

TABLE NO. 122. :North America Warehouse Robotics Market Revenue, By End-user, 2017 – 2022 (USD Million) 114

TABLE NO. 123. :North America Warehouse Robotics Market Revenue, By End-user, 2023– 2030 (USD Million) 114

TABLE NO. 124. :North America Warehouse Robotics Market Volume, By Payload Capacity, 2017 – 2022 (K Units) 115

TABLE NO. 125. :North America Warehouse Robotics Market Volume, By Payload Capacity, 2023– 2030 (K Units) 115

TABLE NO. 126. :North America Warehouse Robotics Market Revenue, By Payload Capacity, 2017 – 2022 (USD Million) 116

TABLE NO. 127. :North America Warehouse Robotics Market Revenue, By Payload Capacity, 2023– 2030 (USD Million) 116

TABLE NO. 128. :Europe Warehouse Robotics Market Volume, By Country, 2017 – 2022 (K Units) 119

TABLE NO. 129. :Europe Warehouse Robotics Market Volume, By Country, 2023– 2030 (K Units) 119

TABLE NO. 130. :Europe Warehouse Robotics Market Revenue, By Country, 2017 – 2022 (USD Million) 120

TABLE NO. 131. :Europe Warehouse Robotics Market Revenue, By Country, 2023– 2030 (USD Million) 120

TABLE NO. 132. :Europe Warehouse Robotics Market Volume, By Type, 2017 – 2022 (K Units) 121

TABLE NO. 133. :Europe Warehouse Robotics Market Volume, By Type, 2023– 2030 (K Units) 121

TABLE NO. 134. :Europe Warehouse Robotics Market Revenue, By Type, 2017 – 2022 (USD Million) 122

TABLE NO. 135. :Europe Warehouse Robotics Market Revenue, By Type, 2023– 2030 (USD Million) 122

TABLE NO. 136. :Europe Warehouse Robotics Market Volume, By Application, 2017 – 2022 (K Units) 123

TABLE NO. 137. :Europe Warehouse Robotics Market Volume, By Application, 2023– 2030 (K Units) 123

TABLE NO. 138. :Europe Warehouse Robotics Market Revenue, By Application, 2017 – 2022 (USD Million) 124

TABLE NO. 139. :Europe Warehouse Robotics Market Revenue, By Application, 2023– 2030 (USD Million) 124

TABLE NO. 140. :Europe Warehouse Robotics Market Volume, By End-user, 2017 – 2022 (K Units) 125

TABLE NO. 141. :Europe Warehouse Robotics Market Volume, By End-user, 2023– 2030 (K Units) 125

TABLE NO. 142. :Europe Warehouse Robotics Market Revenue, By End-user, 2017 – 2022 (USD Million) 126

TABLE NO. 143. :Europe Warehouse Robotics Market Revenue, By End-user, 2023– 2030 (USD Million) 126

TABLE NO. 144. :Europe Warehouse Robotics Market Volume, By Payload Capacity, 2017 – 2022 (K Units) 127

TABLE NO. 145. :Europe Warehouse Robotics Market Volume, By Payload Capacity, 2023– 2030 (K Units) 127

TABLE NO. 146. :Europe Warehouse Robotics Market Revenue, By Payload Capacity, 2017 – 2022 (USD Million) 128

TABLE NO. 147. :Europe Warehouse Robotics Market Revenue, By Payload Capacity, 2023– 2030 (USD Million) 128

TABLE NO. 148. :Asia Pacific Warehouse Robotics Market Volume, By Country, 2017 – 2022 (K Units) 131

TABLE NO. 149. :Asia Pacific Warehouse Robotics Market Volume, By Country, 2023– 2030 (K Units) 131

TABLE NO. 150. :Asia Pacific Warehouse Robotics Market Revenue, By Country, 2017 – 2022 (USD Million) 132

TABLE NO. 151. :Asia Pacific Warehouse Robotics Market Revenue, By Country, 2023– 2030 (USD Million) 132

TABLE NO. 152. :Asia Pacific Warehouse Robotics Market Volume, By Type, 2017 – 2022 (K Units) 133

TABLE NO. 153. :Asia Pacific Warehouse Robotics Market Volume, By Type, 2023– 2030 (K Units) 133

TABLE NO. 154. :Asia Pacific Warehouse Robotics Market Revenue, By Type, 2017 – 2022 (USD Million) 134

TABLE NO. 155. :Asia Pacific Warehouse Robotics Market Revenue, By Type, 2023– 2030 (USD Million) 134

TABLE NO. 156. :Asia Pacific Warehouse Robotics Market Volume, By Application, 2017 – 2022 (K Units) 135

TABLE NO. 157. :Asia Pacific Warehouse Robotics Market Volume, By Application, 2023– 2030 (K Units) 135

TABLE NO. 158. :Asia Pacific Warehouse Robotics Market Revenue, By Application, 2017 – 2022 (USD Million) 136

TABLE NO. 159. :Asia Pacific Warehouse Robotics Market Revenue, By Application, 2023– 2030 (USD Million) 136

TABLE NO. 160. :Asia Pacific Warehouse Robotics Market Volume, By End-user, 2017 – 2022 (K Units) 137

TABLE NO. 161. :Asia Pacific Warehouse Robotics Market Volume, By End-user, 2023– 2030 (K Units) 137

TABLE NO. 162. :Asia Pacific Warehouse Robotics Market Revenue, By End-user, 2017 – 2022 (USD Million) 138

TABLE NO. 163. :Asia Pacific Warehouse Robotics Market Revenue, By End-user, 2023– 2030 (USD Million) 138

TABLE NO. 164. :Asia Pacific Warehouse Robotics Market Volume, By Payload Capacity, 2017 – 2022 (K Units) 139

TABLE NO. 165. :Asia Pacific Warehouse Robotics Market Volume, By Payload Capacity, 2023– 2030 (K Units) 139

TABLE NO. 166. :Asia Pacific Warehouse Robotics Market Revenue, By Payload Capacity, 2017 – 2022 (USD Million) 140

TABLE NO. 167. :Asia Pacific Warehouse Robotics Market Revenue, By Payload Capacity, 2023– 2030 (USD Million) 140

TABLE NO. 168. :Latin America Warehouse Robotics Market Volume, By Country, 2017 – 2022 (K Units) 143

TABLE NO. 169. :Latin America Warehouse Robotics Market Volume, By Country, 2023– 2030 (K Units) 143

TABLE NO. 170. :Latin America Warehouse Robotics Market Revenue, By Country, 2017 – 2022 (USD Million) 144

TABLE NO. 171. :Latin America Warehouse Robotics Market Revenue, By Country, 2023– 2030 (USD Million) 144

TABLE NO. 172. :Latin America Warehouse Robotics Market Volume, By Type, 2017 – 2022 (K Units) 145

TABLE NO. 173. :Latin America Warehouse Robotics Market Volume, By Type, 2023– 2030 (K Units) 145

TABLE NO. 174. :Latin America Warehouse Robotics Market Revenue, By Type, 2017 – 2022 (USD Million) 146

TABLE NO. 175. :Latin America Warehouse Robotics Market Revenue, By Type, 2023– 2030 (USD Million) 146

TABLE NO. 176. :Latin America Warehouse Robotics Market Volume, By Application, 2017 – 2022 (K Units) 147

TABLE NO. 177. :Latin America Warehouse Robotics Market Volume, By Application, 2023– 2030 (K Units) 147

TABLE NO. 178. :Latin America Warehouse Robotics Market Revenue, By Application, 2017 – 2022 (USD Million) 148

TABLE NO. 179. :Latin America Warehouse Robotics Market Revenue, By Application, 2023– 2030 (USD Million) 148

TABLE NO. 180. :Latin America Warehouse Robotics Market Volume, By End-user, 2017 – 2022 (K Units) 149

TABLE NO. 181. :Latin America Warehouse Robotics Market Volume, By End-user, 2023– 2030 (K Units) 149

TABLE NO. 182. :Latin America Warehouse Robotics Market Revenue, By End-user, 2017 – 2022 (USD Million) 150

TABLE NO. 183. :Latin America Warehouse Robotics Market Revenue, By End-user, 2023– 2030 (USD Million) 150

TABLE NO. 184. :Latin America Warehouse Robotics Market Volume, By Payload Capacity, 2017 – 2022 (K Units) 151

TABLE NO. 185. :Latin America Warehouse Robotics Market Volume, By Payload Capacity, 2023– 2030 (K Units) 151

TABLE NO. 186. :Latin America Warehouse Robotics Market Revenue, By Payload Capacity, 2017 – 2022 (USD Million) 152

TABLE NO. 187. :Latin America Warehouse Robotics Market Revenue, By Payload Capacity, 2023– 2030 (USD Million) 152

TABLE NO. 188. :Middle East Warehouse Robotics Market Volume, By Country, 2017 – 2022 (K Units) 155

TABLE NO. 189. :Middle East Warehouse Robotics Market Volume, By Country, 2023– 2030 (K Units) 155

TABLE NO. 190. :Middle East Warehouse Robotics Market Revenue, By Country, 2017 – 2022 (USD Million) 156

TABLE NO. 191. :Middle East Warehouse Robotics Market Revenue, By Country, 2023– 2030 (USD Million) 156

TABLE NO. 192. :Middle East Warehouse Robotics Market Volume, By Type, 2017 – 2022 (K Units) 157

TABLE NO. 193. :Middle East Warehouse Robotics Market Volume, By Type, 2023– 2030 (K Units) 157

TABLE NO. 194. :Middle East Warehouse Robotics Market Revenue, By Type, 2017 – 2022 (USD Million) 158

TABLE NO. 195. :Middle East Warehouse Robotics Market Revenue, By Type, 2023– 2030 (USD Million) 158

TABLE NO. 196. :Middle East Warehouse Robotics Market Volume, By Application, 2017 – 2022 (K Units) 159

TABLE NO. 197. :Middle East Warehouse Robotics Market Volume, By Application, 2023– 2030 (K Units) 159

TABLE NO. 198. :Middle East Warehouse Robotics Market Revenue, By Application, 2017 – 2022 (USD Million) 160

TABLE NO. 199. :Middle East Warehouse Robotics Market Revenue, By Application, 2023– 2030 (USD Million) 160

TABLE NO. 200. :Middle East Warehouse Robotics Market Volume, By End-user, 2017 – 2022 (K Units) 161

TABLE NO. 201. :Middle East Warehouse Robotics Market Volume, By End-user, 2023– 2030 (K Units) 161

TABLE NO. 202. :Middle East Warehouse Robotics Market Revenue, By End-user, 2017 – 2022 (USD Million) 162

TABLE NO. 203. :Middle East Warehouse Robotics Market Revenue, By End-user, 2023– 2030 (USD Million) 162

TABLE NO. 204. :Middle East Warehouse Robotics Market Volume, By Payload Capacity, 2017 – 2022 (K Units) 163

TABLE NO. 205. :Middle East Warehouse Robotics Market Volume, By Payload Capacity, 2023– 2030 (K Units) 163

TABLE NO. 206. :Middle East Warehouse Robotics Market Revenue, By Payload Capacity, 2017 – 2022 (USD Million) 164

TABLE NO. 207. :Middle East Warehouse Robotics Market Revenue, By Payload Capacity, 2023– 2030 (USD Million) 164

TABLE NO. 208. :Africa Warehouse Robotics Market Volume, By Country, 2017 – 2022 (K Units) 167

TABLE NO. 209. :Africa Warehouse Robotics Market Volume, By Country, 2023– 2030 (K Units) 167

TABLE NO. 210. :Africa Warehouse Robotics Market Revenue, By Country, 2017 – 2022 (USD Million) 168

TABLE NO. 211. :Africa Warehouse Robotics Market Revenue, By Country, 2023– 2030 (USD Million) 168

TABLE NO. 212. :Africa Warehouse Robotics Market Volume, By Type, 2017 – 2022 (K Units) 169

TABLE NO. 213. :Africa Warehouse Robotics Market Volume, By Type, 2023– 2030 (K Units) 169

TABLE NO. 214. :Africa Warehouse Robotics Market Revenue, By Type, 2017 – 2022 (USD Million) 170

TABLE NO. 215. :Africa Warehouse Robotics Market Revenue, By Type, 2023– 2030 (USD Million) 170

TABLE NO. 216. :Africa Warehouse Robotics Market Volume, By Application, 2017 – 2022 (K Units) 171

TABLE NO. 217. :Africa Warehouse Robotics Market Volume, By Application, 2023– 2030 (K Units) 171

TABLE NO. 218. :Africa Warehouse Robotics Market Revenue, By Application, 2017 – 2022 (USD Million) 172

TABLE NO. 219. :Africa Warehouse Robotics Market Revenue, By Application, 2023– 2030 (USD Million) 172

TABLE NO. 220. :Africa Warehouse Robotics Market Volume, By End-user, 2017 – 2022 (K Units) 173

TABLE NO. 221. :Africa Warehouse Robotics Market Volume, By End-user, 2023– 2030 (K Units) 173

TABLE NO. 222. :Africa Warehouse Robotics Market Revenue, By End-user, 2017 – 2022 (USD Million) 174

TABLE NO. 223. :Africa Warehouse Robotics Market Revenue, By End-user, 2023– 2030 (USD Million) 174

TABLE NO. 224. :Africa Warehouse Robotics Market Volume, By Payload Capacity, 2017 – 2022 (K Units) 175

TABLE NO. 225. :Africa Warehouse Robotics Market Volume, By Payload Capacity, 2023– 2030 (K Units) 175

TABLE NO. 226. :Africa Warehouse Robotics Market Revenue, By Payload Capacity, 2017 – 2022 (USD Million) 176

TABLE NO. 227. :Africa Warehouse Robotics Market Revenue, By Payload Capacity, 2023– 2030 (USD Million) 176

What is warehouse robotics?

Warehouse robotics refers to using automatic machines and robots to carry out diverse tasks in a warehouse environment. These robots are designed to deal with responsibilities including picking, packing, sorting, and transporting goods, thereby increasing efficiency and lowering manual labor requirements.

What are the important benefits of implementing warehouse robotics?

Implementing warehouse robotics offers several advantages, including improved productivity, advanced accuracy, greater security, reduced labor costs, optimized space utilization, and faster order fulfillment. These robots can perform constantly without any breaks, increasing performance and output.

What types of robots are used in warehouse automation?

Various sorts of robots are used in warehouse automation, which includes autonomous mobile robots (AMRs), robotic arms, automatic guided vehicles (AGVs), shuttle systems, and robot picking systems. These robots are designed to carry out unique obligations based on the requirements of the warehouse operation.

How do warehouse robotics contribute to inventory management?

Warehouse robotics is essential in inventory management by offering real-time data on inventory levels, locations, and movement. Robots can appropriately monitor and track inventory, decreasing errors and improving stock accuracy. They can also optimize inventory storage and retrieval processes, ensuring efficient space utilization.

What factors are driving the growth of the warehouse robotics marketplace?

Several elements are driving the growth of the warehouse robotics marketplace. These include growing e-commerce activities, increasing labor costs, rising demand for automation to enhance operational efficiency, advancements in artificial intelligence and machine learning technology, and the need to deal with warehouse labor shortages and safety issues.

Are warehouse robotics systems expensive to implement?

While the preliminary investment for warehouse robotics systems can be expensive, the long term benefits frequently outweigh the costs. The cost of implementing robotics depends on factors that include the scale of the warehouse, the complexity of operations, the type and quantity of robots required, and the extent of integration with existing structures. Over time, the return on investment may be achieved through improved productivity, reduced labor costs, and extended operational efficiency.

What challenges are associated with enforcing warehouse robotics?

Implementing warehouse robotics may additionally present challenges, which include remodeling warehouse layouts, integrating robots with present systems, retraining personnel for new roles, and coping with potential job displacement concerns. Ensuring compatibility and interoperability of various robotics structures can also be difficult.

Are there any safety concerns related to warehouse robotics?

Safety is a vital consideration when enforcing warehouse robotics. Establishing the right safety protocols, including enforcing sensors and safety systems, is important to save collisions and ensure human-robot collaboration. Training employees to operate accurately along robots and follow established guidelines is essential to mitigating potential risks.

How does warehouse robotics affect the workforce?

Warehouse robotics can affect the workforce by automating repetitive and physically demanding duties, mainly leading a shift in their job roles. While some manual positions may be replaced, the implementation of robotics also can create new roles related to robotic monitoring, maintenance, and programming. Workforce transition applications and upskilling initiatives can help employees adapt to these adjustments.

What is the future outlook for the warehouse robotics marketplace?

The future outlook for the warehouse robotics marketplace is notably promising. With the continued growth of e-commerce, the need for efficient warehousing and order fulfillment methods will drive the demand for robotics. Advancements in technology, including the integration of artificial intelligence, machine learning, and the Internet of Things (IoT), will enhance the capabilities of warehouse robotics systems, leading to expanded adoption and marketplace growth.

Supervisory Control and Data Acquisition (SCADA) Market

Published:
Report ID: 10131

India CCTV Camera Market

Published:
Report ID: 37170

Simulation Software Market

Published:
Report ID: 36908

Bioinformatics Market

Published:
Report ID: 14530

Fish Hook Sensor Market

Published:
Report ID: 36774

Big Data Services Market

Published:
Report ID: 3020

Saudi Arabia Managed Security Services Market

Published:
Report ID: 36393

Microwave Oven Market

Published:
Report ID: 36314

Inkjet Coders Market

Published:
Report ID: 6669

Rich Communication Services Market

Published:
Report ID: 35774

Middle East and Africa Real-Time Payments Market

Published:
Report ID: 35770

Vietnam Managed Security Services (MSS) Market

Published:
Report ID: 35766

Purchase Options

$2999
Delivery Format: Excel.
$4999
Designed for the individual purchaser.
$6999
Users located at a single corporate site or regional office.
$7999
Allowed for unlimited sharing globally within one company.
Smallform of Sample request

Have a question?

User Profile

Don’t settle for less – trust Mitul to help you find the best solution.

Report delivery within 24 to 48 hours

– Other Info –

What people say?-

User Review

I am very impressed with the information in this report. The author clearly did their research when they came up with this product and it has already given me a lot of ideas.

Jana Schmidt
CEDAR CX Technologies

– Connect with us –

Phone

+91 6232 49 3207


support

24/7 Research Support


sales@credenceresearch.com

– Research Methodology –

Going beyond the basics: advanced techniques in research methodology

– Trusted By –

Pepshi, LG, Nestle
Motorola, Honeywell, Johnson and johnson
LG Chem, SIEMENS, Pfizer
Unilever, Samsonite, QIAGEN