Biologics pipelines and licensing money widen regional work
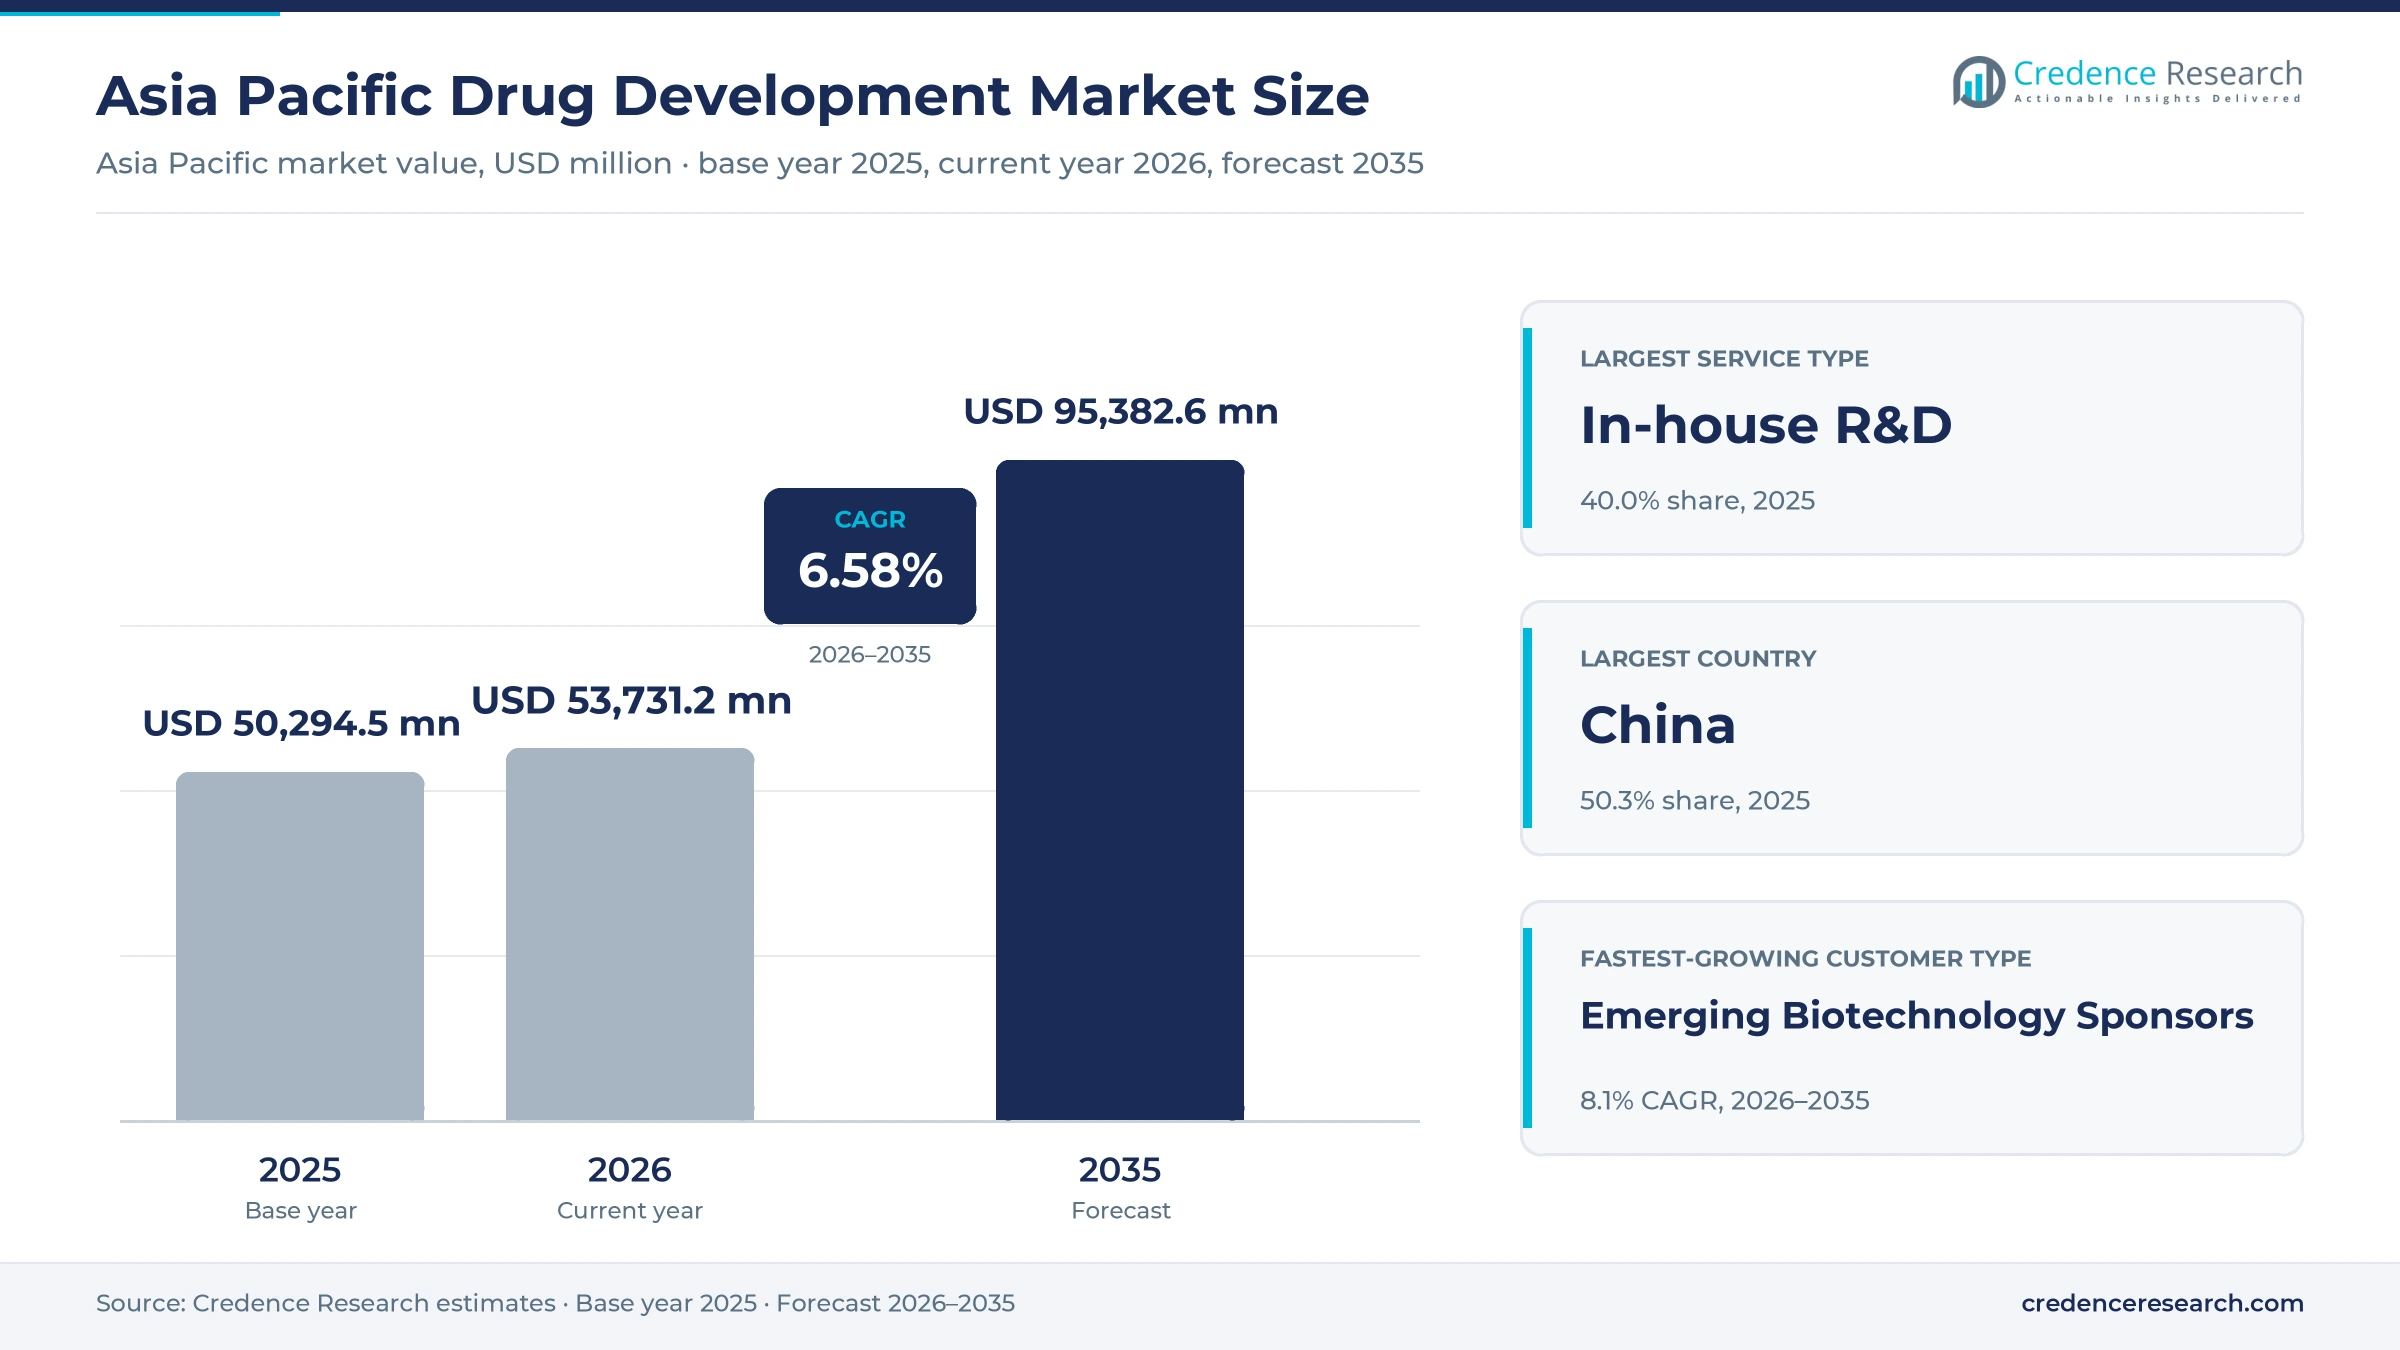
The Asia Pacific drug development market was valued at USD 50.29 billion in 2025 and is projected to increase from USD 53.73 billion in 2026 to USD 95.38 billion by 2035, registering a CAGR of 6.58% during 2026–2035. Demand comes from innovator drugmakers, venture-backed biotech companies, generic and biosimilar firms and public research bodies that pay for discovery, trials and process work, or fund it internally. China held the largest country share, 50.3% in 2025, because its domestic innovators and contract platforms run a large share of the region's new molecules from discovery to filing. India is the fastest-growing country at 8.5% a year, as faster trial licensing and state co-funding widen early-stage work. Trial start-up times are also shortening, as China, Japan and India each remove review steps before a first patient is dosed. Sponsors now choose development partners on speed to first patient, modality skills and exposure to U.S. security rules as much as on price.
Discovery, trials and process work paid for or performed in house
The market counts what drug sponsors in Asia Pacific spend to take a candidate from discovery to approval, whether they buy the work from contract research and development organizations or run it in their own laboratories. It covers preclinical research and drug discovery, clinical trial services, process development and internal R&D budgets, paid as fees for service, dedicated capacity fees, milestone and licensing receipts or internal cost allocations.
The count excludes commercial manufacturing of approved products, sales and marketing, post-launch pharmacovigilance and general laboratory equipment purchases. Value flows from sponsors to contract platforms, trial sites and process laboratories, while licensing receipts move money from Western drugmakers back to Asian originators that own the assets.
Asia Pacific Drug Development Market Insights
- The market rises from USD 50.29 billion in 2025 to USD 95.38 billion by 2035, a 6.58% CAGR, as funded biologics pipelines and regional trials add development work.
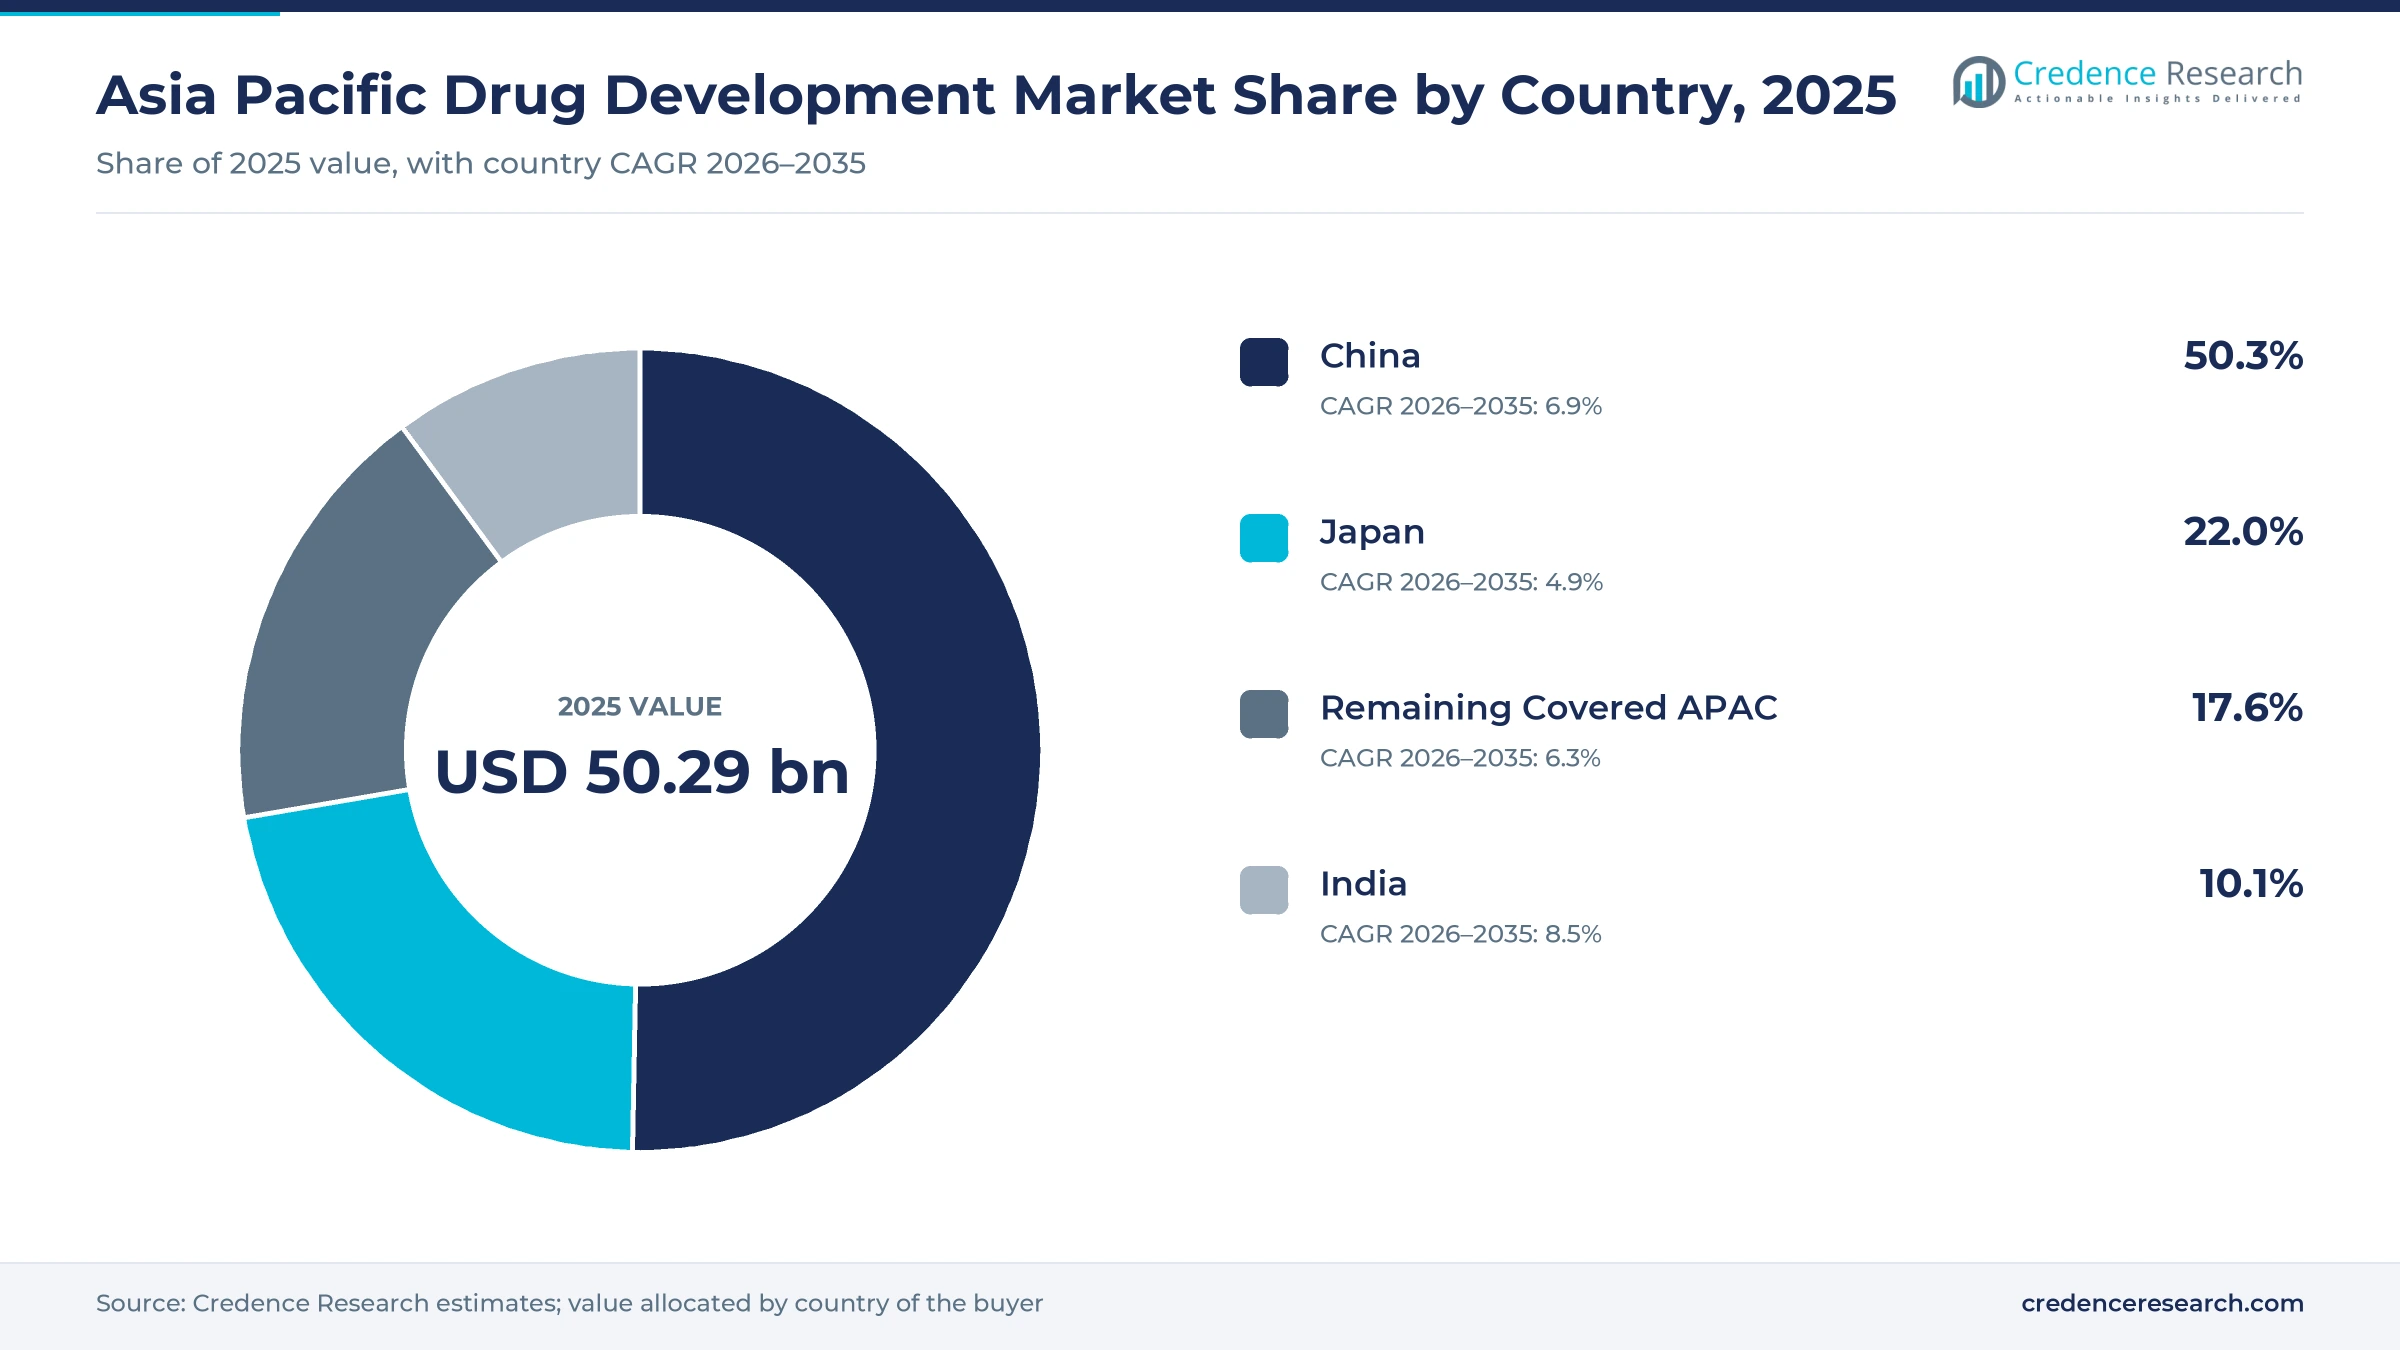
- China held 50.3% of 2025 value because domestic innovators and contract platforms run a large share of regional discovery, trials and process work.
- In-house R&D led with 40.0% of 2025 value, since China's medicine manufacturers alone spent 114.56 billion yuan on R&D in 2024.
- Chinese drugmakers signed 157 cross-border licensing deals worth USD 135.7 billion in 2025, up from USD 51.9 billion in 2024, Caixin reported.
- India is the fastest-growing country at 8.5% a year during 2026–2035, helped by a draft rule that halves test licence processing to 45 days.
In-house R&D leads while process work grows fastest
Why does in-house R&D still hold the largest share?
Based on service type, the market is categorized into preclinical research and drug discovery, clinical trial services, process development and in-house R&D. In-house R&D led with 40.0% of 2025 value because large sponsors still fund most work internally, and China's industrial medicine manufacturers spent 114.56 billion yuan on R&D in 2024, according to the National Bureau of Statistics. Process development grows fastest at 7.8% a year as biologics move toward filing, and WuXi Biologics made 156 IND filings for clients in 2025, the company said in March 2026. Buyers of preclinical contract research increasingly bundle it with process work.
Which sponsors pay for most development work?
Based on customer type, the market is categorized into innovator pharmaceutical sponsors, emerging biotechnology sponsors, generic and biosimilar sponsors, and academic and public research sponsors. Innovator Pharmaceutical Sponsors led with 46.0% of 2025 value because established drugmakers pay for the costly late stages, and WuXi AppTec counted 91 Phase III and 83 commercial molecules in its small molecule pipeline at the end of 2025. Emerging biotechnology sponsors grow fastest at 8.1% a year as licensing money funds their programs, with 157 Chinese cross-border deals in 2025 against 94 a year earlier, Caixin reported.
Oncology leads while cardiometabolic work grows fastest
Based on application, the market is categorized into oncology development, cardiovascular and metabolic development, CNS and neurology development, and remaining therapeutic development. Oncology Development led with 38.0% of 2025 value because cancer dominates regional pipelines, and Chinese researchers gave one-third of the oral presentations at ASCO 2025, Shanghai East Hospital oncologist Zhou Caicun told China Daily. Sponsors running oncology clinical trials also lean on Japanese cancer hospitals. Cardiovascular and metabolic development grows fastest at 8.0% a year as obesity programs scale, and China approved Innovent's mazdutide for chronic weight management in June 2025, BioSpectrum Asia reported.
How much development work is outsourced?
Based on operating model, the market is categorized into in-house development, outsourced development and hybrid development. In-house Development led with 45.0% of 2025 value because leading Asian originators keep core programs inside their own teams, and Innovent took its thyroid eye disease drug from trial filing to approval in about three years and three months, China Daily reported in January 2026. Outsourced Development grows fastest at 7.5% a year as sponsors place more molecules with contract platforms, and WuXi AppTec added 839 new molecules in 2025, lifting its pipeline to 3,452.
| Segment Group | Leading Sub-segment | Share, 2025 | Fastest-growing Sub-segment | CAGR, 2026–2035 |
|---|---|---|---|---|
| By Service Type | In-house R&D | 40.0% | Process Development | 7.8% |
| By Customer Type | Innovator Pharmaceutical Sponsors | 46.0% | Emerging Biotechnology Sponsors | 8.1% |
| By Application | Oncology Development | 38.0% | Cardiovascular & Metabolic Development | 8.0% |
| By Operating Model | In-house Development | 45.0% | Outsourced Development | 7.5% |
Low trial costs meet rising licensing upfronts
Development work in the region is priced per patient, per study, per batch or through upfront and milestone payments, and the gap between service fees and licensing receipts is wide. Direct Phase III costs per lung cancer patient in China are roughly a third of U.S. levels, which draws global sponsors to Chinese sites. Australian sponsors cut their net cost through the tax refund. Licensing upfronts now reach hundreds of millions of dollars for strong assets. Contract platforms earn steady fees, while originators capture most of the upside from milestones and royalties.
| Offer or segment | Typical price or fee | Basis |
|---|---|---|
| Phase III direct cost per patient, non-small cell lung cancer, China | About USD 25,000, against about USD 69,000 in the U.S. | Pharmaceutical Executive, citing a DIA analysis |
| Eligible R&D spend performed in Australia | Refund of up to 43.5% of eligible spend | Clinical Leader, August 2025 |
| India PRIP co-funding for industry-academia projects | Up to Rs 125 crore or 35% of project cost | Department of Pharmaceuticals, PRIP scheme page |
| Out-licensing upfront, 3SBio to Pfizer | USD 1.25 billion upfront | Caixin, January 2026 |
| Out-licensing upfront, Hengrui to GSK | USD 500 million upfront | Caixin, January 2026 |
Request a Free Sample
Fill in your details and we'll send you a free sample report.
- Sample data tables & charts
- Research methodology
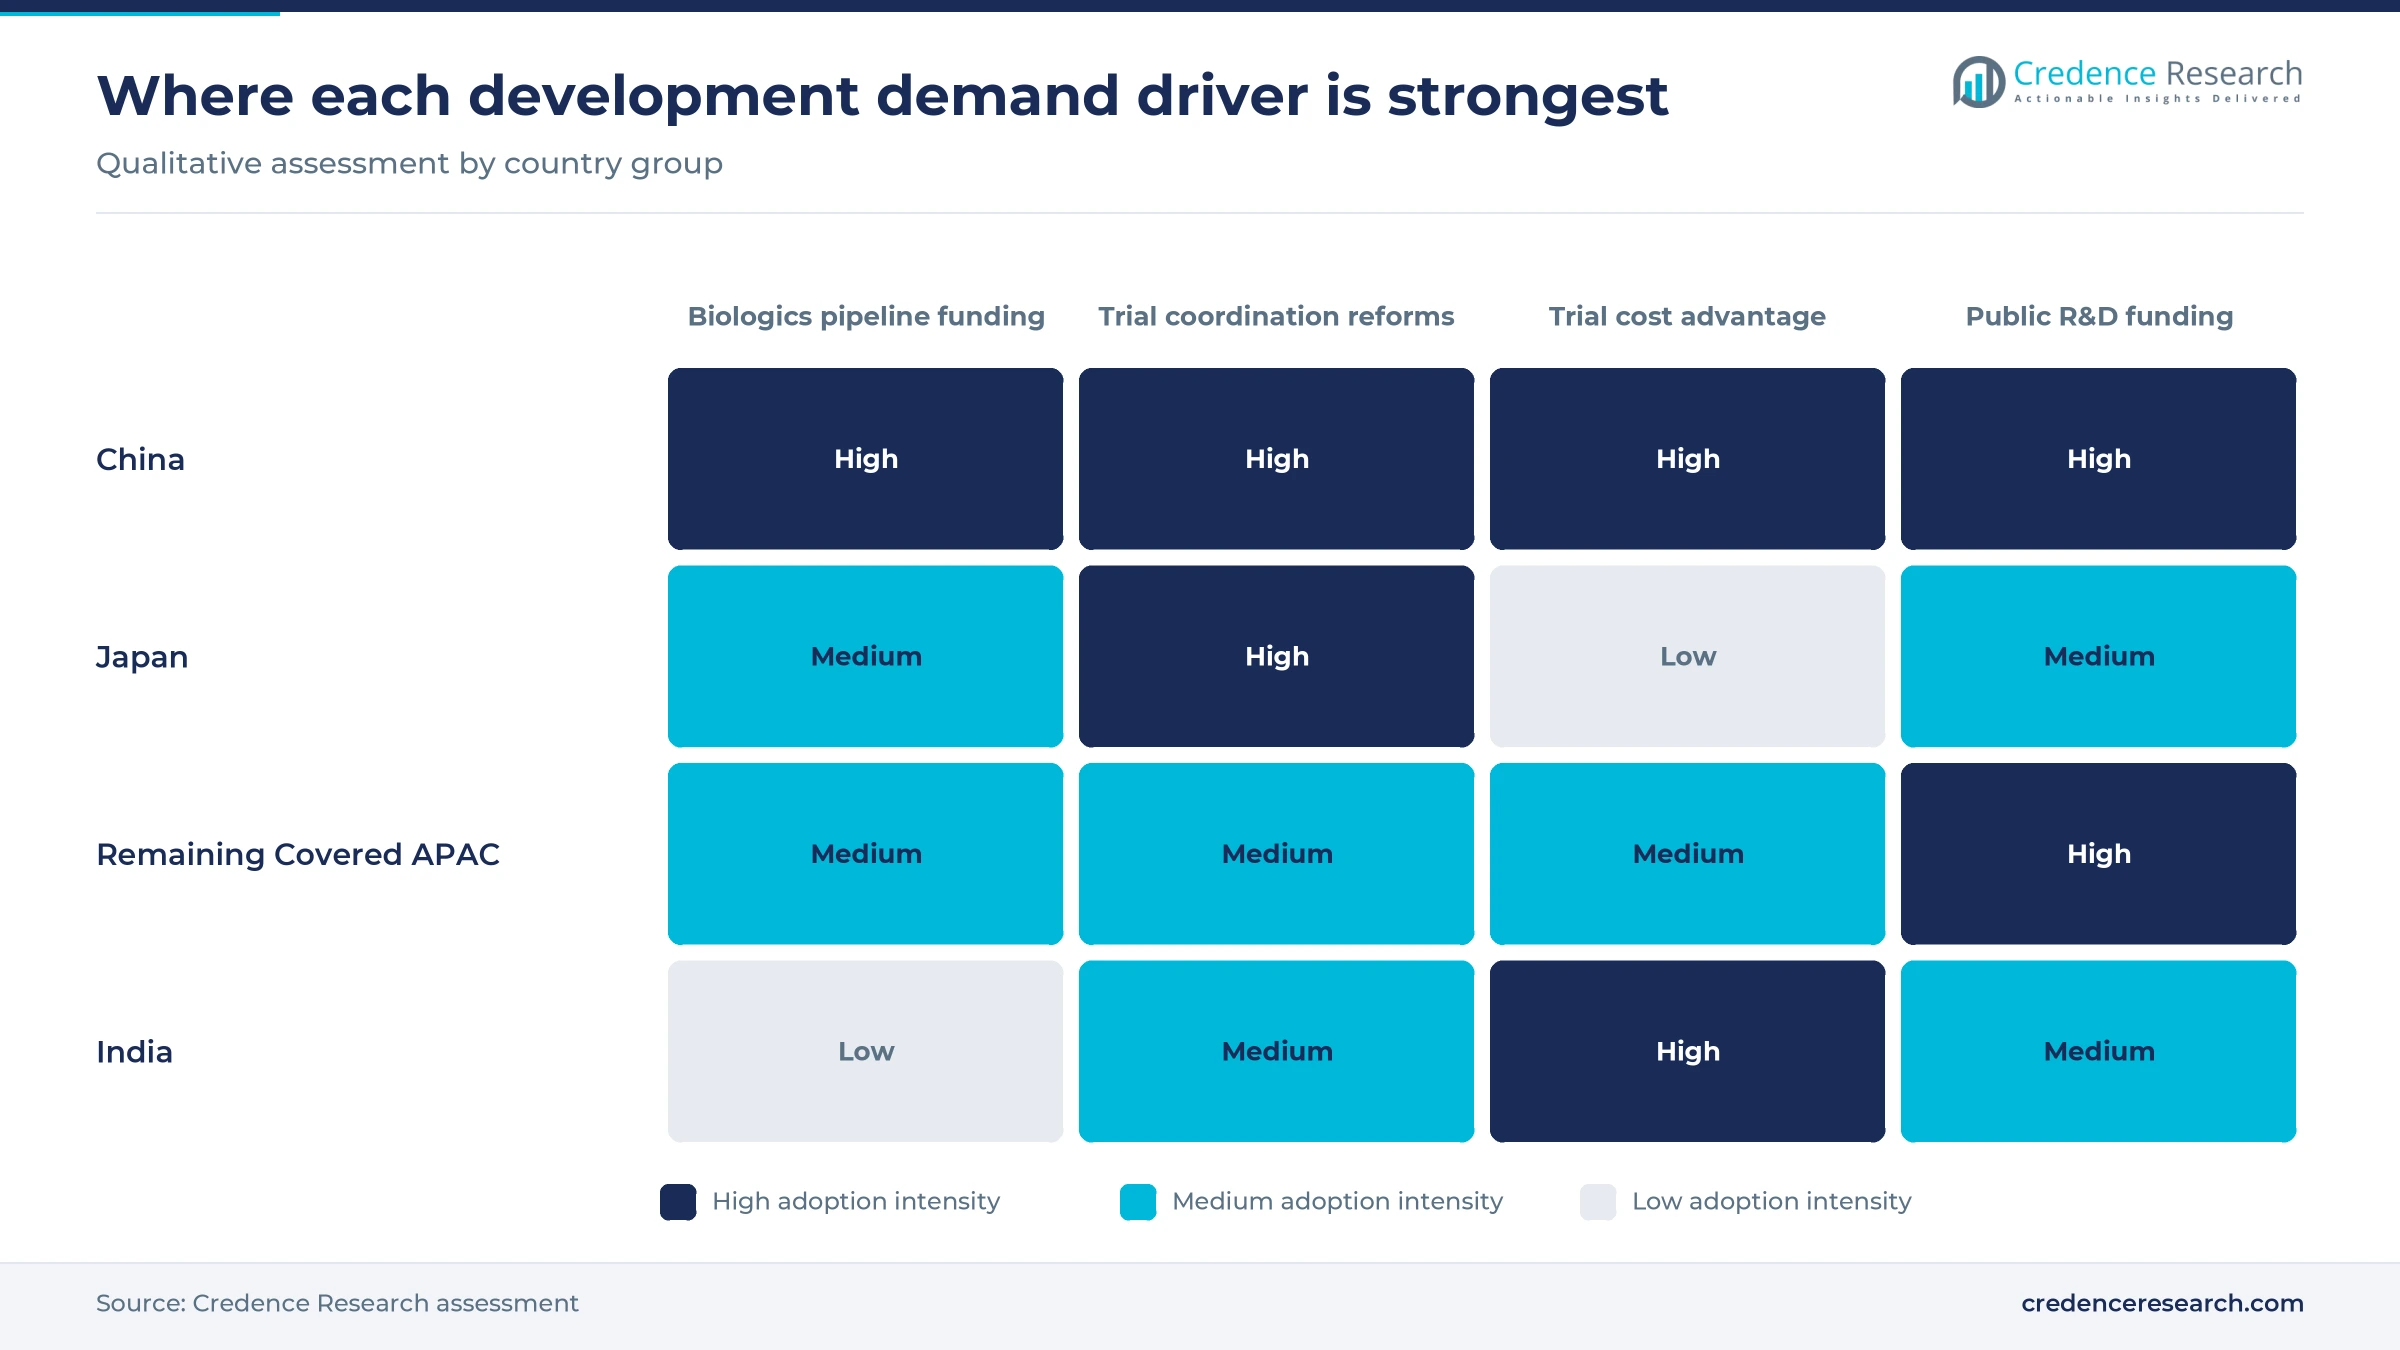
Funded pipelines and faster trial rules drive demand
Funded biologics pipelines expand development workloads
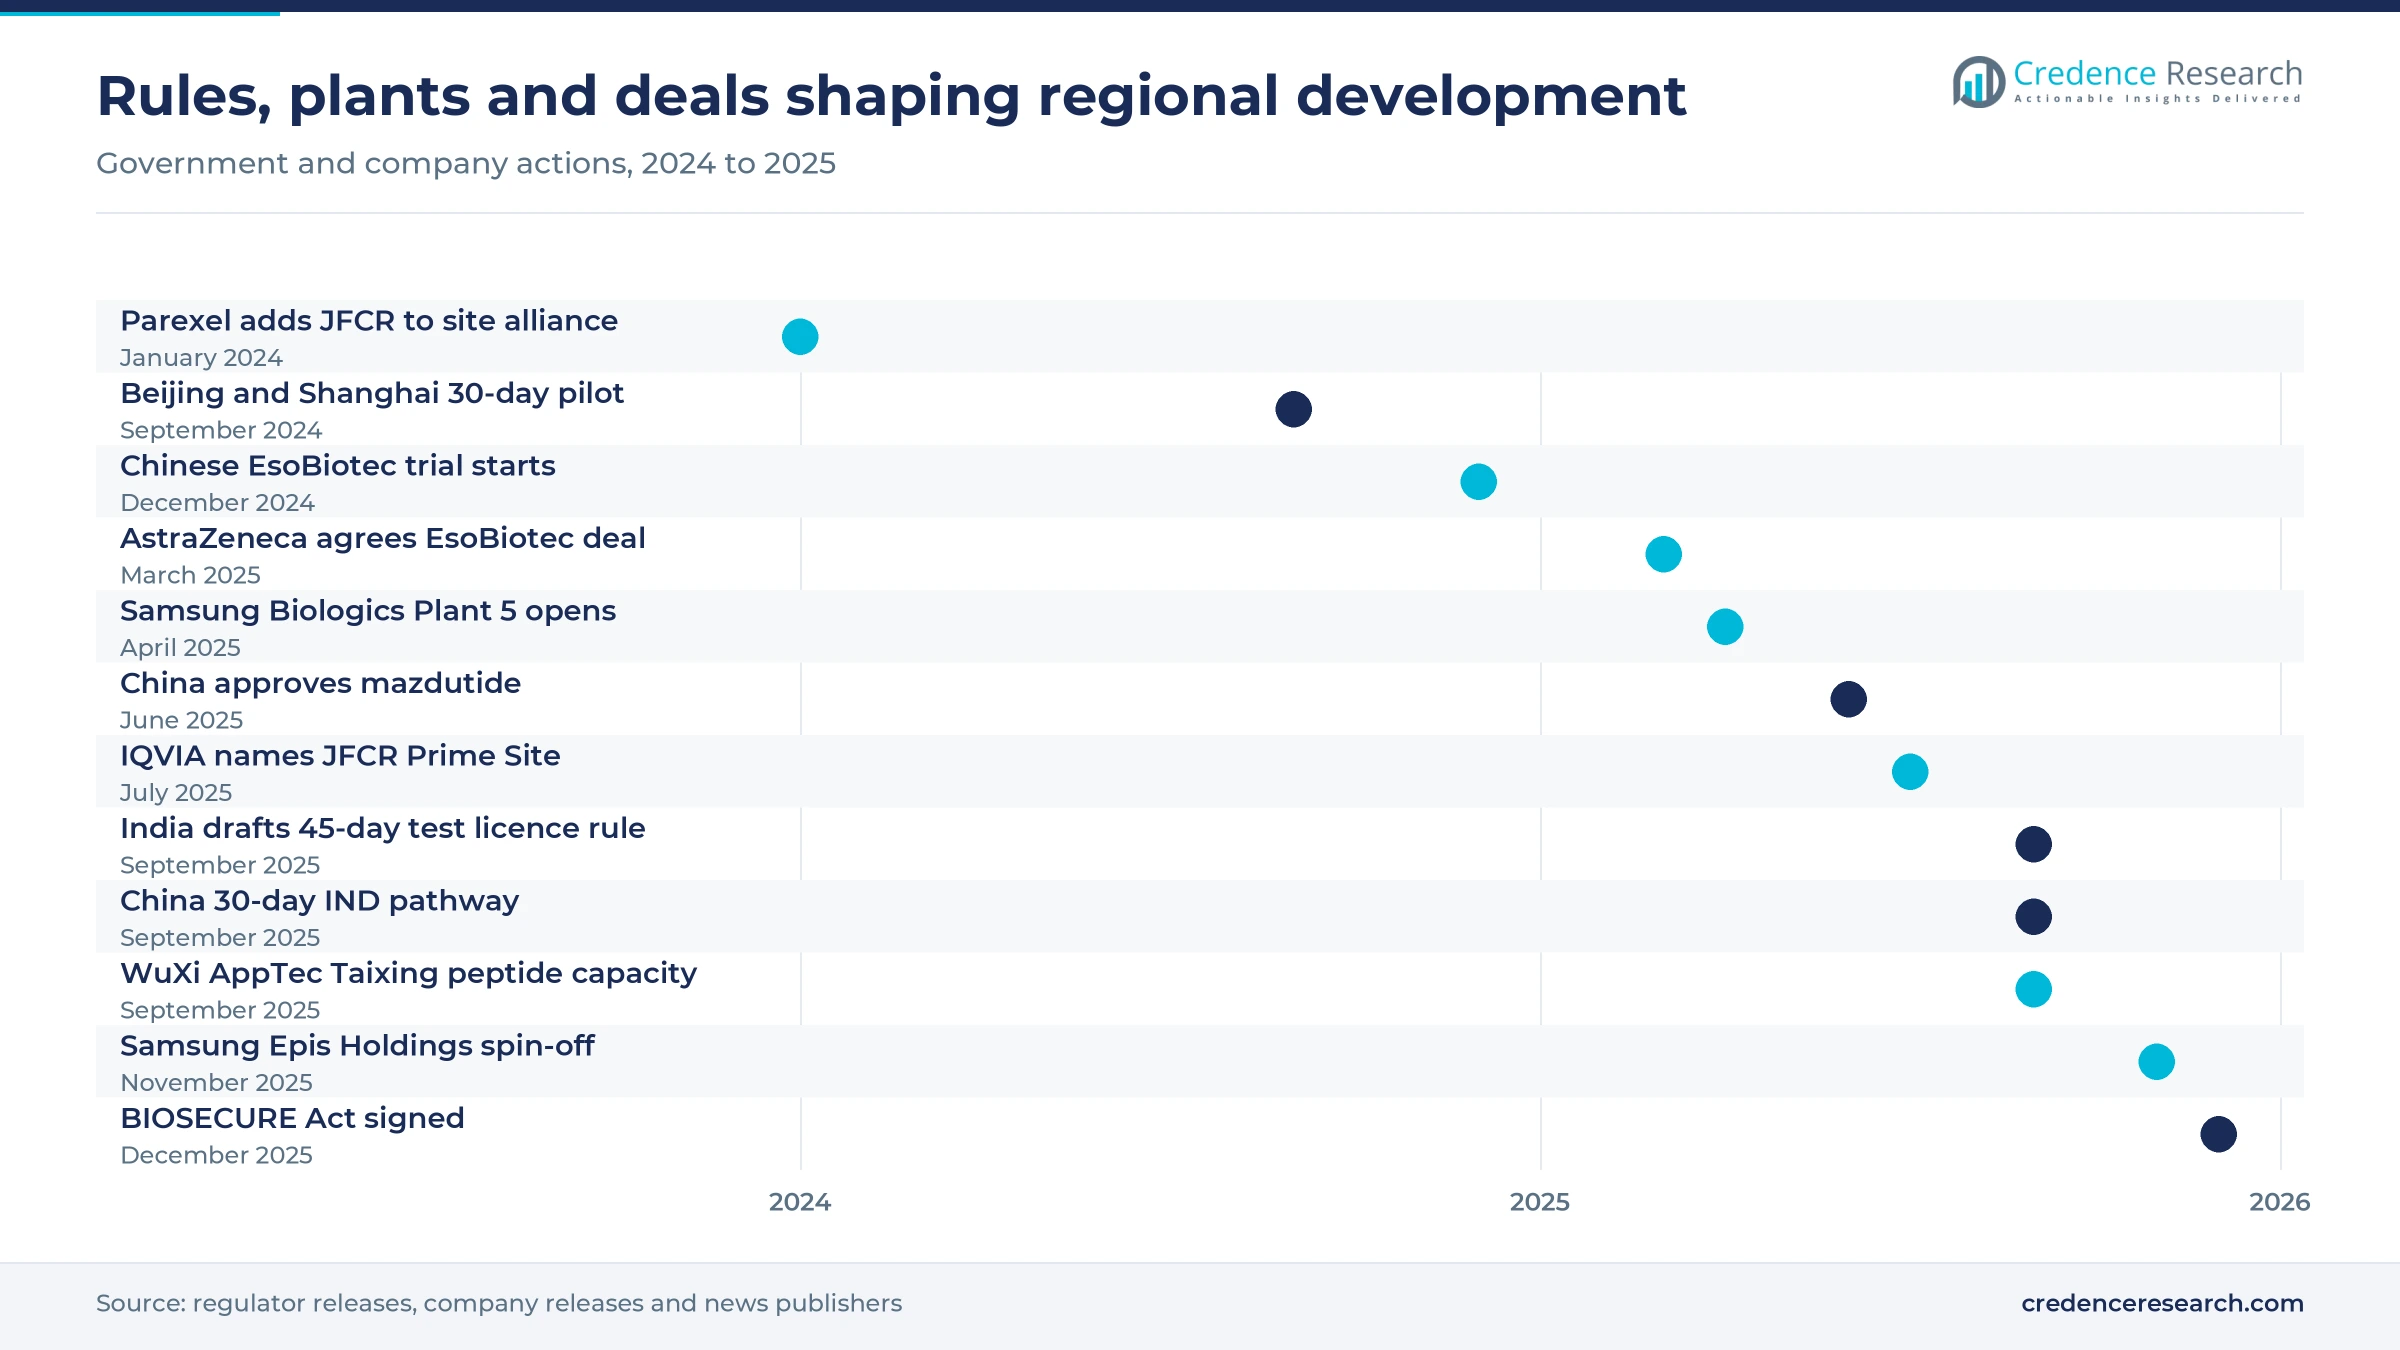
Licensing payments and venture money now reach Asian biologics earlier, which keeps more of them in active, fee-paying programs. Chinese drugmakers struck 157 cross-border licensing deals worth USD 135.7 billion in 2025, up from USD 51.9 billion across 94 deals in 2024, Caixin reported. WuXi Biologics added a record 209 integrated projects in 2025, and about half of the new projects came from U.S. clients. Samsung Biologics opened Plant 5 in April 2025, the company said, adding 180,000 liters of biologics capacity for client programs. Each funded biologic needs cell line, process and clinical supply work for years, so contract platforms fill new suites quickly.
Regional trial coordination supports international programs
Regulators in the region now accept local sites inside global studies rather than demanding separate domestic trials. China's drug regulator said on Sept. 9, 2025 that eligible innovative drug trial applications will be reviewed within 30 working days, including Phase III multiregional trials led by domestic investigators. IQVIA made the Cancer Institute Hospital of JFCR its first Japanese Prime Site on July 24, 2025, to speed cancer trials and address drug loss. Korea ranked fourth in the world for clinical trials in 2023, and its national trial agency KoNECT attracted 14 multiregional trials in 2024, BioSpectrum Asia reported. Faster coordination lets sponsors add Asian patients to pivotal studies without extending timelines.
Development productivity enables more pipeline work
Faster enrollment and shorter reviews let the same budget move more candidates through each stage. Enrollment in China can run two to three times faster than in other markets, Pharmaceutical Executive reported, citing a DIA analysis. WuXi AppTec moved 310 molecules from its discovery arm into development in 2025, the company said in March 2026. Beijing and Shanghai drug regulators ran a pilot from September 2024 that cut innovative trial reviews from 60 to 30 business days, Covington noted. AstraZeneca agreed in March 2025 to buy EsoBiotec for up to USD 1 billion after a Chinese investigator-initiated trial began in December 2024 and dosed its first patient in January 2025, showing how quickly early data now turns into value.
Public R&D funding widens the sponsor base
Public R&D funding widens the sponsor base, because governments in the region are paying part of the cost of new molecules and the laboratories that test them. China's National Bureau of Statistics reported that medicine manufacturers spent 114.56 billion yuan on R&D in 2024, an intensity of 4.53% of business revenue, second among industrial sectors. India's Department of Pharmaceuticals runs the Rs 5,000 crore PRIP scheme, which co-funds industry projects up to Rs 125 crore or 35% of cost. Australia's R&D tax incentive refunds up to 43.5% of eligible spend on work performed in the country, Clinical Leader reported in August 2025. State co-funding lowers the hurdle for mid-sized generic firms and biotechs that are starting their first innovative programs.
China assets go global as CDMOs specialize by modality
Rise of China as a source of first-in-class assets
Regional spending is moving from fast-follower work toward costlier novel programs as Chinese originators produce first-in-class assets. China approved a record 76 innovative drugs in 2025, up from 48 in 2024, and more than 90% of the biological drugs came from domestic companies, according to NMPA data cited by China Daily. The record licensing values discussed above show that Western buyers now pay for these assets before they reach Phase III. 3SBio received a USD 1.25 billion upfront payment from Pfizer, a record for Chinese out-licensing, Caixin reported. Novel programs need more preclinical packages, global trial designs and process validation, so spending per molecule climbs across the region.
Shift toward pure-play CDMOs and modality specialists
Sponsors increasingly want development partners that sell no competing drugs and run dedicated suites for one modality. Samsung Biologics completed its spin-off of Samsung Epis Holdings on Nov. 1, 2025, leaving a pure-play contract development and manufacturing business, Asia Economy reported. Bispecifics and ADCs made up about two-thirds of WuXi Biologics' new projects in 2025. WuXi AppTec completed new peptide capacity at Taixing in September 2025, and its count of peptide and oligonucleotide molecules grew 45% in the year. Sponsors comparing contract manufacturing organizations now ask for modality depth first, which rewards platforms that invest in specialist suites.
Opportunity in cardiometabolic and obesity programs
Asian originators hold incretin assets that global buyers are now willing to fund at scale. Kailera licensed rights outside Greater China to several Hengrui obesity candidates for more than USD 100 million in upfront and near-term payments, with milestones near USD 6 billion, BioPharma Dive reported. Hengrui's HRS9531 reached about 18% weight loss at 48 weeks in a Chinese Phase 3 study of 567 adults, with results announced on July 15, 2025. Kailera launched with USD 400 million in funding to take the assets into global trials. Together with the mazdutide approval noted above, these programs create large multiregional trials and peptide process work for regional providers.
Opportunity in faster early-phase work in India
Licensing reform could bring home early-phase studies that Indian sponsors now run abroad. The Health Ministry proposed on Sept. 3, 2025 to cut statutory processing of test licences from 90 to 45 days and to replace many approvals with notifications, Business Standard reported. The ministry expects test licence applications to fall by about 50%, freeing CDSCO staff for complex reviews. India holds about 8% of global clinical trials, the same report said. The Department of Pharmaceuticals lists new chemical entities, biosimilars, orphan drugs and AMR drugs as priority areas for PRIP funding. Providers with Indian early-phase units can capture first-in-human and bioequivalence work as rules ease.
U.S. security rules and Japan price cuts weigh on sponsors
BIOSECURE rules raise supplier risk for U.S. programs
BIOSECURE rules raise supplier risk for sponsors with U.S. federal funding. The act was signed into law on Dec. 18, 2025, as part of the FY2026 defense authorization, and the OMB must publish its list of biotechnology companies of concern within a year, Ropes & Gray noted. Contracts signed before a designation are grandfathered for five years after the procurement rules change. Sponsors therefore keep second-source plans for Chinese providers and pay extra qualification costs even where no company is yet named.
Japanese price cuts slow new program launches
Sponsors weigh the return on each Japanese study against list prices that the government now cuts every year. Japan carried out its FY2025 off-year drug price revision despite strong industry opposition, GR Japan noted in March 2025. As of March 2023, 86 drugs approved abroad were not being developed for Japan, the British Chamber of Commerce in Japan reported. Smaller overseas biotechs often skip Japan, so local trial demand stays below what the country's patient base could support.
Fast review tracks come with tight start conditions
Few Chinese sites can meet the start conditions attached to the new 30-day review. China's 30-day pathway requires sponsors to start ethics review in parallel and commit to beginning the trial within 12 weeks of approval, and complex files fall back to a 60-day review. The earlier pilot ran only through the Beijing and Shanghai regulators. Sponsors without strong lead hospitals lose the time advantage, so demand concentrates on a small group of top sites and their staff.
Uneven research budgets cap demand outside hubs
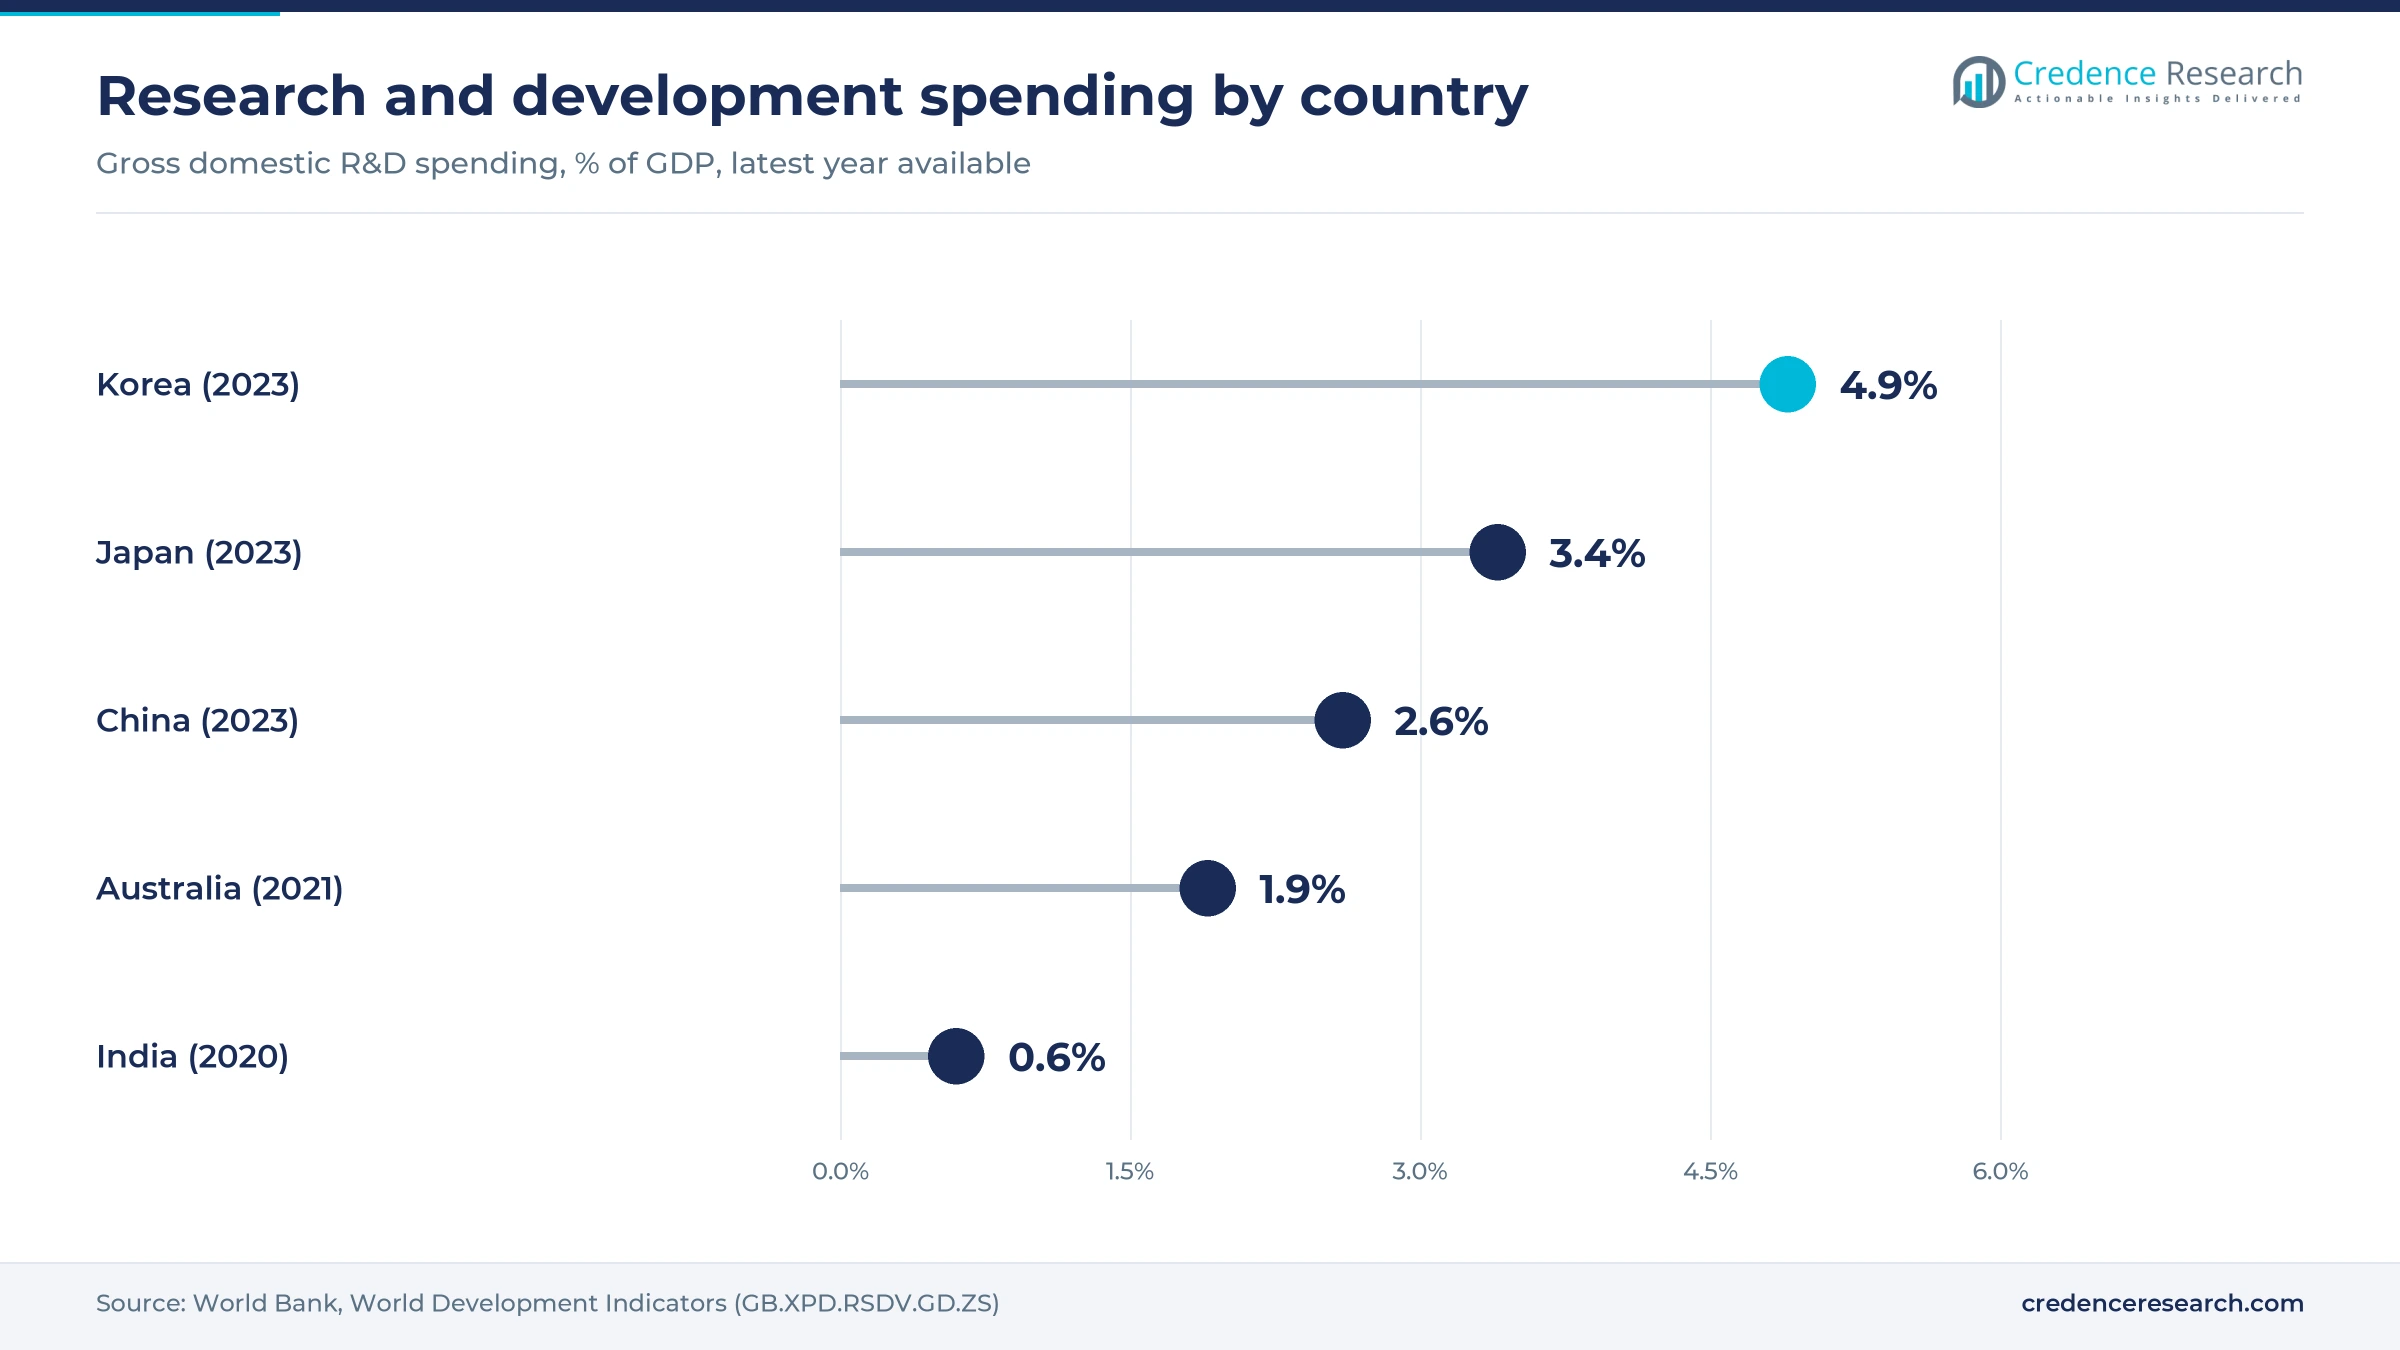
Outside China, Japan and Korea, thin research budgets limit how many domestic programs reach the clinic. India spent 0.6% of GDP on R&D in 2020, against 4.9% for Korea and 3.4% for Japan in 2023, World Bank data show. Lower public and private budgets mean fewer domestic innovative programs and thinner academic sponsorship. Providers in lower-spending countries rely on foreign sponsors and generic work, which leaves their revenue exposed to export cycles and currency moves.
China holds half the spend as India grows fastest
| Country | Value, 2025 (USD billion) | Share, 2025 | CAGR, 2026–2035 |
|---|---|---|---|
| China | 25.30 | 50.3% | 6.9% |
| Japan | 11.06 | 22.0% | 4.9% |
| Remaining Covered APAC | 8.85 | 17.6% | 6.3% |
| India | 5.08 | 10.1% | 8.5% |
China leads on innovator scale and contract platforms
China held 50.3% of 2025 value and grows at 6.9% a year because its innovators, biotechs and contract platforms cover the full path from discovery to filing. WuXi AppTec, WuXi Biologics, Pharmaron and Tigermed serve both domestic and foreign sponsors from Chinese sites. The record approvals and licensing deals noted above keep pipelines funded. Growth stays close to the regional pace because U.S. security rules make some Western sponsors spread work across other countries.
Japan rebuilds trial demand after drug loss reforms
Japan held 22.0% of 2025 value, ranking second in the region behind China. It grows at 4.9% a year, the slowest pace, because price cuts and drug loss have kept many overseas biotechs away. Business R&D in the medicines industry alone reached 1.66 trillion yen in fiscal 2024, up 7.9%, according to the Statistics Bureau of Japan. Regulators answered in December 2023, when guidance said an extra Japanese Phase 1 study is in principle not needed before joining multiregional trials. Parexel added the Japanese Foundation for Cancer Research to its Global Site Alliance in January 2024. Large domestic drugmakers still fund most local work in house.
Korea, Australia and Singapore anchor the remaining group
Remaining Covered APAC held 17.6% of 2025 value and grows at 6.3% a year, led by Korea, Australia and Singapore. Korea has the highest research intensity in the region, and Samsung Biologics supplies process development and manufacturing from Songdo. Australia draws early-phase work through ethics approvals in about 30 days and an exchange rate that gives sponsors a 30% to 40% cost advantage, Clinical Leader reported. Novotech runs regional trials from its Australian base across these markets.
India grows fastest on licensing reform and co-funding
India held 10.1% of 2025 value and is the fastest-growing country at 8.5% a year, as licensing reform and state co-funding widen early-stage work. The proposed cut in test licence timelines and the PRIP scheme, both noted above, lower the cost of starting innovative programs at home. Syngene International serves foreign and domestic sponsors from Bengaluru with discovery, development and manufacturing services. Generic and biosimilar sponsors still dominate demand, so spending per program stays below Chinese levels.
Plants, trial rules and spin-offs marked 2025
| Development | Status and market relevance |
|---|---|
| In April 2025, Samsung Biologics opened Plant 5 at Bio Campus II in Songdo with 180,000 liters of capacity. | Operating, giving biologics sponsors more process and clinical supply capacity in Korea. |
| In July 2025, IQVIA named the Cancer Institute Hospital of JFCR its first Japanese Prime Site. | Active, aimed at faster cancer trials and less drug loss in Japan. |
| In September 2025, China's drug regulator opened a 30-working-day review track for eligible innovative drug trials. | In force, shortening study start for Class I drugs and domestic-led global trials. |
| In November 2025, Samsung Biologics completed the spin-off of Samsung Epis Holdings. | Completed, leaving Samsung Biologics as a pure-play contract development and manufacturing firm. |
| In December 2025, the BIOSECURE Act became U.S. law as part of the FY2026 defense authorization. | Enacted, with the federal list of companies of concern due by December 2026. |
Bispecifics, ADCs and peptides change development work
Four technologies change what sponsors buy from development partners in Asia Pacific, and each already shapes the mix of new projects that contract platforms accept. Providers that master these methods win longer contracts, because the same team usually carries a molecule from process design to clinical supply.
- Bispecific antibodies need complex cell line and purification work, so process development hours per program are higher than for standard monoclonal antibodies.
- Antibody-drug conjugates combine biologics, linker chemistry and payload handling, so sponsors favor providers with integrated suites.
- Peptide synthesis at scale supports incretin obesity drugs, which need large solid-phase reactors well before launch.
- Single-use bioreactor trains let process laboratories switch between client projects quickly, which cuts idle time between batches.
Need a Custom Version of This Report?
Tailor the scope, geography, or segments to your exact requirements.
- Custom geography or segment scope
- Direct access to our analyst team
Integrated Chinese platforms compete with global CROs
Competition in Asia Pacific drug development is decided by speed to the clinic, modality depth and regulatory track record. WuXi AppTec and Pharmaron compete for discovery and small molecule work, while WuXi Biologics and Samsung Biologics compete for biologics process development and clinical supply. IQVIA and Parexel lead multiregional trials for global sponsors, and Tigermed and Novotech compete on regional site networks and lower trial costs. Syngene International offers Indian discovery and development capacity to foreign sponsors. Spending on healthcare contract research outsourcing follows the same pattern, since sponsors place trial work where enrollment is fastest. Western sponsors with U.S. federal exposure now weigh BIOSECURE risk alongside price and quality. Switching costs are high once a process is validated with one provider, so early project wins tend to carry into later stages and commercial supply.
Integrated Chinese platforms and global CROs split the work
Supply in Asia Pacific drug development is organized in three main layers. Integrated Chinese platforms such as WuXi AppTec, WuXi Biologics and Pharmaron cover discovery, process development and clinical supply under one contract, and their scale lowers cost per molecule. Global clinical research organizations such as IQVIA and Parexel, together with regional specialists Tigermed and Novotech, run multiregional trials and site networks. Biologics process and manufacturing capacity is concentrated in a few large owners, led by Samsung Biologics and WuXi Biologics. Entry barriers are highest in biologics process work, where regulatory track records and large bioreactor plants take years to build and margins are richest.
Companies profiled and their roles in this market
| Company | Type | Role in the market |
|---|---|---|
| WuXi AppTec Co., Ltd. | Integrated research and development platform | Runs discovery, small molecule and peptide development for global sponsors from China |
| WuXi Biologics (Cayman) Inc. | Biologics development and manufacturing provider | Develops cell lines, processes and clinical supply for bispecifics and ADCs |
| Samsung Biologics Co., Ltd. | Biologics development and manufacturing provider | Supplies process development and large-scale biologics capacity from Songdo, Korea |
| IQVIA Holdings Inc. | Global clinical research organization | Runs multiregional trials with Prime Sites, including a cancer hospital in Tokyo |
| Parexel International | Global clinical research organization | Runs clinical trials across Asia Pacific with a Japanese oncology site alliance |
| Hangzhou Tigermed Consulting Co., Ltd. | Regional clinical research organization | Provides preclinical, clinical trial, data and regulatory services from China |
| Pharmaron Beijing Co., Ltd. | Integrated research and development platform | Offers discovery chemistry, preclinical, process development and clinical services from China |
| Novotech | Regional clinical research organization | Runs biotech clinical trials across Australia and Asia Pacific countries |
| Syngene International Ltd. | Research, development and manufacturing provider | Provides discovery, development and clinical supply services from Bengaluru, India |
Licensing money will decide who funds Asian pipelines
Credence Research's view is that licensing money, not domestic budgets alone, will decide how fast Asia Pacific drug development spending grows through 2035. Western buyers now pay for Chinese assets at early stages, which funds the trials and process work that follow. China will keep about half of regional value, while India gains from cheaper early-phase work and Japan recovers slowly from drug loss. BIOSECURE remains the main swing factor for Chinese contract platforms serving U.S. sponsors. Sponsors should qualify second sources early and lock modality capacity for bispecifics, ADCs and peptides before demand tightens.
Model values rest on official, filing and deal evidence
The report uses 2025 as the base year and 2026 to 2035 as the forecast period. Market values come from the Credence Research model, and country, service type, customer type, application and operating model splits are Credence Research estimates informed by public data. Sources include national statistics, regulator releases, government scheme pages, company releases and filings, World Bank indicators and named news publishers. No interviews or surveys were used to build these estimates.
Biotech sponsors and late-stage trials set the pace to 2035
Credence Research expects Asia Pacific drug development spending to reach USD 95.38 billion by 2035 as funded biologics pipelines move into late-stage trials and filings. India should keep the fastest pace, while China remains the largest source of value because of its innovator base and contract platforms. Process development, the fastest-growing service type at 7.8% a year, will gain share as more licensed biologics approach filing. Emerging biotechnology sponsors, growing at 8.1% a year, will add the most new demand for outsourced work. Cardiometabolic programs will take a larger share of trial budgets. U.S. security rules remain the main risk, because a broad designation would push work to slower and costlier sites.
Licensing flows and U.S. rules set the range to 2035
The range of outcomes depends mainly on whether Western buyers keep paying for Asian assets and on how strictly U.S. security rules are applied to contract providers. Steady licensing money funds more trials and process work, while a broad designation of Chinese providers would push sponsors to slower, costlier sites. Japanese pricing policy and Indian licensing reform shift the balance among countries. A sharp fall in biotech funding would hit emerging sponsors first.
| Scenario | CAGR, 2026–2035 | Value, 2035 | What has to hold |
|---|---|---|---|
| Downside | 5.0% | USD 83.21 billion | Licensing deals slow, U.S. designations reach major Chinese providers and biotech funding tightens across the region |
| Base | 6.58% | USD 95.38 billion | Licensing continues near current levels and trial reforms in China, Japan and India proceed as planned |
| Upside | 7.8% | USD 105.46 billion | Asian assets keep winning global deals and multiregional trials add regional sites at a faster pace |
Frequently Asked Questions
How big is the Asia Pacific drug development market?
Which country leads the market?
Which country is growing fastest?
Which service type holds the largest share?
Why do licensing deals matter for development spending?
What holds the market back?
How is development work priced in the region?
Who are the main companies in this market?
Table of Content
Chapter 1 Market Segmentation
- 1.1 Segmentation Framework
- 1.1.1 Product and Service Classification
- 1.1.2 Application and End-Use Classification
- 1.1.3 Technology and Solution Classification
- 1.1.4 Customer and Distribution Channel Classification
- 1.1.5 Geographic Segmentation
- 1.1.6 Market Segment Definitions and Boundaries
- 1.2 By Service Type
- 1.2.1 In-house R&D
- 1.2.2 Clinical Trial Services
- 1.2.3 Preclinical Research & Drug Discovery
- 1.2.4 Process Development
- 1.3 By Customer Type
- 1.3.1 Innovator Pharmaceutical Sponsors
- 1.3.2 Emerging Biotechnology Sponsors
- 1.3.3 Generic & Biosimilar Sponsors
- 1.3.4 Academic & Public Research Sponsors
- 1.4 By Application
- 1.4.1 Oncology Development
- 1.4.2 Cardiovascular & Metabolic Development
- 1.4.3 CNS & Neurology Development
- 1.4.4 Remaining Therapeutic Development
- 1.5 By Operating Model
- 1.5.1 In-house Development
- 1.5.2 Outsourced Development
- 1.5.3 Hybrid Development
- 1.6 By Country
- 1.6.1 China
- 1.6.2 Japan
- 1.6.3 Remaining Covered APAC
- 1.6.4 India
Chapter 2 Introduction
- 2.1 Report Objectives and Scope
- 2.2 Product Definition and Industry Terminology
- 2.3 Market Inclusions and Exclusions
- 2.4 Research Process
- 2.4.1 Primary Research and Expert Interviews
- 2.4.2 Secondary Research and Source Review
- 2.4.3 Top-Down and Bottom-Up Estimation
- 2.4.4 Data Triangulation and Verification
- 2.5 Market Size Measurement Basis
- 2.5.1 2025: USD 50.29 billion → 2035: USD 95.38 billion
- 2.6 Historical and Forecast Reference Periods
- 2.6.1 Historical Period: 2018-2025
- 2.6.2 Base Year: 2025
- 2.6.3 Forecast Period: 2025-2035
- 2.7 Research Assumptions and Limitations
Chapter 3 Executive Summary
- 3.1 Market Snapshot and Key Findings
- 3.2 Base-Year Market Size, 2025
- 3.3 Forecast Market Size, 2035
- 3.4 Revenue and Volume Growth Outlook
- 3.5 Key Demand and Supply Indicators
- 3.6 Leading Market Segments
- 3.7 Fastest-Growing Market Opportunities
- 3.8 Regional Performance Highlights
- 3.9 Technology and Industry Transformation
- 3.10 Competitive Landscape Summary
- 3.11 Analyst View and Strategic Implications
Chapter 4 Asia Pacific Drug Development Market Trends and Developments
- 4.1 Historical Industry Development, 2018-2025
- 4.2 Recent Market Trends and Developments
- 4.3 Demand and Customer Behavior Trends
- 4.4 Technology and Product Innovation
- 4.5 Artificial Intelligence, Automation and Digitalization
- 4.6 Local Manufacturing and Supply Chain Realignment
- 4.7 Industry Partnerships, Mergers and Acquisitions
- 4.8 Sustainability and Circular Economy Developments
- 4.9 Government and Private Sector Investment Trends
- 4.10 Emerging Business Models and Commercialization
- 4.11 Industry Developments and Announcements
Chapter 5 Asia Pacific Drug Development Market Production, Supply and Demand Analysis
- 5.1 Demand Trend and Consumption Analysis, 2018-2025
- 5.2 Demand Forecast, 2025-2035
- 5.3 Production and Output Trend, 2018-2025
- 5.4 Production and Output Forecast, 2025-2035
- 5.5 Installed Capacity and Capacity Utilization
- 5.6 Company-Wise Production Plants and Statistics
- 5.6.1 Installed Production Capacity
- 5.6.2 Actual Production
- 5.6.3 Planned Capacity and Expansion Targets
- 5.7 Supply Chain Structure and Procurement Trends
- 5.8 Supply-Demand Gap and Bottlenecks
- 5.9 Import Dependence and Sourcing Structure
- 5.10 Contract Manufacturing and Outsourcing
- 5.11 Regional Supply and Demand Concentration
Chapter 6 Asia Pacific Drug Development Market Pricing Analysis
- 6.1 Pricing Structure and Measurement
- 6.2 Historical Pricing Trends, 2018-2025
- 6.3 Pricing Outlook, 2025-2035
- 6.4 Average Selling Price and Unit Economics
- 6.5 Pricing by Product and Market Segment
- 6.6 Geographic Pricing Differences
- 6.7 Key Input, Energy, Labor and Logistics Costs
- 6.8 Contract Pricing and Purchasing Models
- 6.9 Pricing Sensitivity and Competitive Positioning
- 6.10 Price, Margin and Profitability Implications
Chapter 7 Asia Pacific Drug Development Market Dynamics
- 7.1 Market Growth Drivers
- 7.1.1 Demand-Side Drivers
- 7.1.2 Technology and Innovation Drivers
- 7.1.3 Infrastructure and Investment Drivers
- 7.1.4 Regulatory and Policy Drivers
- 7.2 Market Restraints
- 7.2.1 Cost and Affordability Constraints
- 7.2.2 Technology and Adoption Barriers
- 7.2.3 Supply Chain and Operational Constraints
- 7.3 Market Challenges
- 7.3.1 Competitive Pressure and Margin Erosion
- 7.3.2 Skills, Infrastructure and Implementation Gaps
- 7.4 Emerging Market Opportunities
- 7.5 Market Dynamics Impact and Time-Horizon Assessment
Chapter 8 Asia Pacific Drug Development Value Chain Analysis
- 8.1 Industry Value Chain Overview
- 8.2 Upstream Suppliers and Critical Inputs
- 8.3 Technology and Component Providers
- 8.4 Manufacturing or Service Delivery
- 8.5 Distribution, Channel Partners and Integrators
- 8.6 Downstream Applications and End Users
- 8.7 Value Addition and Profit Pools
- 8.8 Vertical Integration and Outsourcing
- 8.9 Supplier Concentration and Risk
- 8.10 Supply Chain Localization and Resilience
Chapter 9 Asia Pacific Drug Development Market Regulations and Policies
- 9.1 Relevant Laws, Standards and Compliance Frameworks
- 9.2 Product, Service, Safety and Quality Requirements
- 9.3 Government Policies, Incentives and Subsidies
- 9.4 Imports, Exports and Trade Barriers
- 9.5 Public Procurement and Local Content Requirements
- 9.6 Environmental and Sustainability Compliance
- 9.7 Upcoming Policy Changes and Market Implications
Chapter 10 Asia Pacific Drug Development Market Hotspots and Opportunities
- 10.1 Market Opportunity Mapping and Growth Hotspots
- 10.2 High-Growth Applications and Customer Groups
- 10.3 Underserved Markets and White-Space Opportunities
- 10.4 Emerging Technology and Product Opportunities
- 10.5 New Capacity and Investment Hotspots
- 10.6 Market Entry and Expansion Opportunities
- 10.7 Distribution and Partnership Opportunities
- 10.8 Near-Term and Long-Term Commercial Potential
- 10.9 Opportunity Attractiveness and Execution Risks
Chapter 11 Asia Pacific Drug Development Market Outlook, 2025-2035
- 11.1 Market Size and Analysis
- 11.1.1 Revenue (Market Measurement: 2025: USD 50.29 billion → 2035: USD 95.38 billion)
- 11.1.2 Market Volume and Quantity Sold
- 11.1.3 Historical Market Size, 2018-2025
- 11.1.4 Base-Year Market Size, 2025
- 11.2 Market Forecast, 2025-2035
- 11.2.1 Revenue Forecast to 2035
- 11.2.2 Volume Forecast to 2035
- 11.2.3 CAGR and Year-on-Year Growth
- 11.2.4 Incremental Revenue Opportunity
- 11.3 Forecast Assumptions and Scenario Analysis
- 11.3.1 Base-Case Forecast
- 11.3.2 Optimistic and Conservative Scenarios
- 11.3.3 Technology, Pricing and Policy Sensitivities
- 11.4 Market Attractiveness and Growth Outlook
Chapter 12 Asia Pacific Drug Development Market Segmentation and Outlook
- 12.1 Segmentation Summary and Market Shares, 2025
- 12.2 Largest and Fastest-Growing Segments
- 12.3 By Service Type - Market Size and Forecast, 2025-2035
- 12.3.1 Segment Definition and Scope
- 12.3.2 Historical Market Size, 2018-2025
- 12.3.3 Revenue Forecast, 2025-2035
- 12.3.4 Volume Forecast, 2025-2035
- 12.3.5 Base-Year Market Share, 2025
- 12.3.6 Segment CAGR and Growth Drivers
- 12.3.7 Subsegment Market Size and Forecast
- 12.3.7.1 In-house R&D
- 12.3.7.2 Clinical Trial Services
- 12.3.7.3 Preclinical Research & Drug Discovery
- 12.3.7.4 Process Development
- 12.3.8 Subsegment Pricing and Adoption Trends
- 12.3.9 Leading Suppliers and Competition
- 12.3.10 Regional Demand and Opportunities
- 12.4 By Customer Type - Market Size and Forecast, 2025-2035
- 12.4.1 Segment Definition and Scope
- 12.4.2 Historical Market Size, 2018-2025
- 12.4.3 Revenue Forecast, 2025-2035
- 12.4.4 Volume Forecast, 2025-2035
- 12.4.5 Base-Year Market Share, 2025
- 12.4.6 Segment CAGR and Growth Drivers
- 12.4.7 Subsegment Market Size and Forecast
- 12.4.7.1 Innovator Pharmaceutical Sponsors
- 12.4.7.2 Emerging Biotechnology Sponsors
- 12.4.7.3 Generic & Biosimilar Sponsors
- 12.4.7.4 Academic & Public Research Sponsors
- 12.4.8 Subsegment Pricing and Adoption Trends
- 12.4.9 Leading Suppliers and Competition
- 12.4.10 Regional Demand and Opportunities
- 12.5 By Application - Market Size and Forecast, 2025-2035
- 12.5.1 Segment Definition and Scope
- 12.5.2 Historical Market Size, 2018-2025
- 12.5.3 Revenue Forecast, 2025-2035
- 12.5.4 Volume Forecast, 2025-2035
- 12.5.5 Base-Year Market Share, 2025
- 12.5.6 Segment CAGR and Growth Drivers
- 12.5.7 Subsegment Market Size and Forecast
- 12.5.7.1 Oncology Development
- 12.5.7.2 Cardiovascular & Metabolic Development
- 12.5.7.3 CNS & Neurology Development
- 12.5.7.4 Remaining Therapeutic Development
- 12.5.8 Subsegment Pricing and Adoption Trends
- 12.5.9 Leading Suppliers and Competition
- 12.5.10 Regional Demand and Opportunities
- 12.6 By Operating Model - Market Size and Forecast, 2025-2035
- 12.6.1 Segment Definition and Scope
- 12.6.2 Historical Market Size, 2018-2025
- 12.6.3 Revenue Forecast, 2025-2035
- 12.6.4 Volume Forecast, 2025-2035
- 12.6.5 Base-Year Market Share, 2025
- 12.6.6 Segment CAGR and Growth Drivers
- 12.6.7 Subsegment Market Size and Forecast
- 12.6.7.1 In-house Development
- 12.6.7.2 Outsourced Development
- 12.6.7.3 Hybrid Development
- 12.6.8 Subsegment Pricing and Adoption Trends
- 12.6.9 Leading Suppliers and Competition
- 12.6.10 Regional Demand and Opportunities
- 12.7 By Country - Market Size and Forecast, 2025-2035
- 12.7.1 Segment Definition and Scope
- 12.7.2 Historical Market Size, 2018-2025
- 12.7.3 Revenue Forecast, 2025-2035
- 12.7.4 Volume Forecast, 2025-2035
- 12.7.5 Base-Year Market Share, 2025
- 12.7.6 Segment CAGR and Growth Drivers
- 12.7.7 Subsegment Market Size and Forecast
- 12.7.7.1 China
- 12.7.7.2 Japan
- 12.7.7.3 Remaining Covered APAC
- 12.7.7.4 India
- 12.7.8 Subsegment Pricing and Adoption Trends
- 12.7.9 Leading Suppliers and Competition
- 12.7.10 Regional Demand and Opportunities
- 12.8 Segment Growth Comparison
- 12.9 Segment Attractiveness and Priority Matrix
Chapter 13 Asia Pacific Drug Development End-Use and Application Market Outlook
- 13.1 End-Use Industry and Customer Demand Structure
- 13.2 Leading Applications and Customer Groups
- 13.3 End-Use Market Size, Share and Forecast
- 13.4 Major End-Use Industry Deep Dives
- 13.4.1 Customer Requirements and Use Cases
- 13.4.2 Demand and Replacement Cycles
- 13.4.3 Technical and Regulatory Considerations
- 13.4.4 Purchasing and Procurement Models
- 13.4.5 Leading Vendors and Distribution Channels
- 13.4.6 Forecast and Commercial Opportunities
- 13.5 Emerging Applications and Cross-Segment Demand
- 13.6 End-Use Industry Investment Priorities
Chapter 14 Asia Pacific Drug Development Geographic Market Outlook, 2025-2035
- 14.1 Regional Market Size and Country-Level Shares, 2025
- 14.2 Country Market Size Comparison, 2025
- 14.3 Country Market Forecasts, 2025-2035
- 14.4 Subregional Industrial and Demand Clusters
- 14.5 Intra-Regional Pricing and Cost Differences
- 14.6 Cross-Border Trade and Supply Networks
- 14.7 Regional Supply and Demand Balances
- 14.8 Country Opportunity Comparison and Prioritization
Note: Every listed country is covered on the structure shown under the first country.
Chapter 15 Asia Pacific Drug Development Technology, Innovation and Sustainability Outlook
- 15.1 Technology Landscape and Maturity
- 15.2 Product, Process and Service Innovation
- 15.3 AI, Automation and Digital Tools in the Industry
- 15.4 Technology Adoption and Performance Benchmarking
- 15.5 Innovation Pipeline and R&D Investment
- 15.6 Patent and Intellectual Property Trends
- 15.7 Energy Efficiency and Resource Management
- 15.8 Sustainability, Recycling and Circularity
- 15.9 Technology Roadmap, 2025-2035
- 15.10 Risks of Obsolescence and Technology Substitution
Chapter 16 Asia Pacific Drug Development Market Key Strategic Imperatives
- 16.1 Growth and Market Entry Priorities
- 16.2 High-Return Products and Segments
- 16.3 Pricing, Profitability and Cost Optimization
- 16.4 Technology Investment and Product Differentiation
- 16.5 Supply Chain Localization and Resilience
- 16.6 Distribution and Customer Acquisition
- 16.7 Partnership, Acquisition and Capacity Strategy
- 16.8 Regional Expansion Priorities
- 16.9 Short-, Medium- and Long-Term Actions
Chapter 17 Competition Outlook
- 17.1 Industry Competition Characteristics
- 17.2 Market Structure and Concentration
- 17.3 Market Share and Competitive Positioning, 2025
- 17.4 Company-Wise Revenue and Product Benchmarking
- 17.5 Production and Service Capacity Benchmarking
- 17.6 Technology, Pricing and Differentiation
- 17.7 Regional Footprint and Distribution Strength
- 17.8 Mergers, Acquisitions and Strategic Alliances
- 17.9 New Entrants and Competitive Threats
- 17.10 Porter's Five Forces and Industry Attractiveness
- 17.11 Competitive Outlook, 2025-2035
Chapter 18 Company Profiles
- 18.1 Company Coverage and Selection Criteria
- 18.2 WuXi AppTec Co., Ltd.
- 18.2.1 Business Description
- 18.2.2 Company Ownership and Geographic Presence
- 18.2.3 Product and Service Portfolio
- 18.2.4 Manufacturing and Operating Footprint
- 18.2.5 Production Capacity and Expansion Plans
- 18.2.6 Financial Performance and Investment
- 18.2.7 Market Share and Competitive Position
- 18.2.8 Technology and Innovation Capabilities
- 18.2.9 Strategic Alliances or Partnerships
- 18.2.10 Recent Developments
- 18.2.11 Growth Strategy and Outlook
- 18.3 WuXi Biologics (Cayman) Inc.
- 18.4 Samsung Biologics Co., Ltd.
- 18.5 IQVIA Holdings Inc.
- 18.6 Parexel International
- 18.7 Hangzhou Tigermed Consulting Co., Ltd.
- 18.8 Pharmaron Beijing Co., Ltd.
- 18.9 Novotech
- 18.10 Syngene International Ltd.
- 18.11 Other Relevant Market Participants
Note: Every listed company is profiled on the structure shown under the first company. The company list is preliminary and may change based on research findings, market developments, data availability and client requirements.
Chapter 19 Disclaimer
- 19.1 Research and Forecast Disclaimer
- 19.2 Data Source and Estimation Limitations
Note: The depth of individual sections depends on data availability for this market. Volume, capacity, trade and other unit-based metrics are included where applicable.