
Market Overview
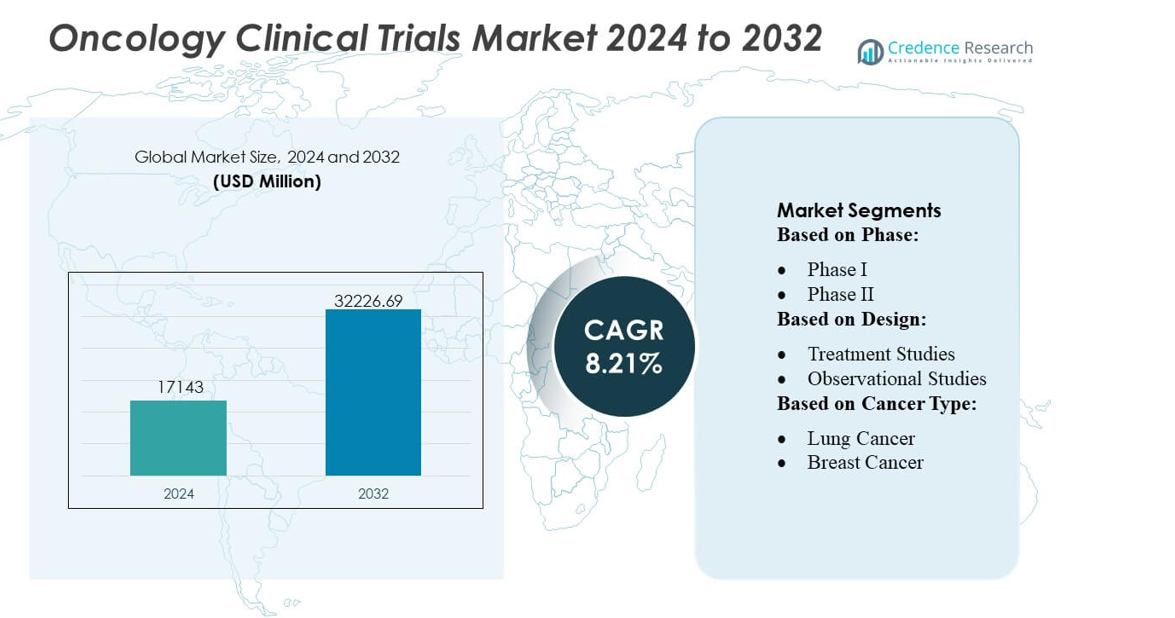
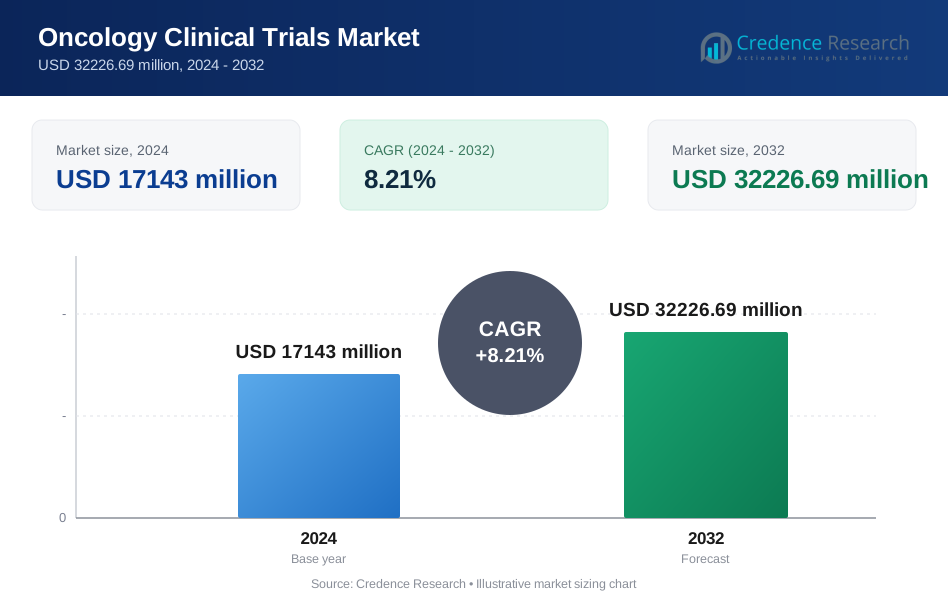
Oncology Clinical Trials Market size was valued USD 17143 million in 2024 and is anticipated to reach USD 32226.69 million by 2032, at a CAGR of 8.21% during the forecast period.
| REPORT ATTRIBUTE | DETAILS |
|---|---|
| Historical Period | 2020-2023 |
| Base Year | 2024 |
| Forecast Period | 2025-2032 |
| Oncology Clinical Trials Market Size 2024 | USD 17143 million |
| Oncology Clinical Trials Market, CAGR | 8.21% |
| Oncology Clinical Trials Market Size 2032 | USD 32226.69 million |
The Oncology Clinical Trials Market is shaped by a mix of global biopharmaceutical innovators and specialized CROs that continue to expand capabilities in precision oncology, biomarker-driven designs, and decentralized trial execution. Companies strengthen competitiveness through advanced data-management platforms, AI-enabled recruitment systems, and multi-regional oncology site networks that support rapid enrollment across complex therapeutic areas. North America leads the global market with an exact 43% share, supported by strong R&D investment, extensive cancer-research infrastructure, and early adoption of adaptive and genomically guided trial models. The region’s integrated ecosystem positions it as the primary hub for large-scale oncology clinical development.
Market Insights
- Oncology Clinical Trials Market size reached USD 17143 million in 2024 and will rise to USD 32226.69 million by 2032 at a CAGR of 8.21%.
- Strong market drivers include expanding precision-oncology pipelines, rising adoption of biomarker-stratified study designs, and increasing integration of decentralized trial models across early- and late-phase segments.
- Key trends highlight AI-enabled patient matching, adaptive platform trials, and advanced data-management systems that improve recruitment and optimize complex oncology protocols.
- Competitive intensity grows as global biopharma companies and CROs invest in multi-regional oncology networks, strengthen genomic-testing capabilities, and enhance operational efficiency in Phase II and Phase III segments, which hold the largest trial share.
- Regional analysis shows North America leading with 43% share, supported by mature research infrastructure, while Asia-Pacific expands rapidly due to large patient pools, accelerating approvals, and rising participation in precision and immuno-oncology trials.
Market Segmentation Analysis:
By Phase
Phase III dominates the Oncology Clinical Trials Market with an estimated 48–50 % share, supported by its pivotal role in validating large-scale efficacy and safety before regulatory submission. This phase attracts the highest patient enrollment, longer study durations, and expanded geographic trial footprints, driven by the need for statistically robust datasets across diverse populations. Growth accelerates as oncology sponsors increase late-stage pipeline investments and adopt adaptive protocols to streamline outcome assessments. Rising demand for targeted therapies and immuno-oncology agents further strengthens Phase III activity, making it the central driver of overall clinical development spending.
- For instance, 3M Health Information software solutions are used in many health systems worldwide, including over 75% of U.S. hospitals, and thousands of hospitals trust their technology. An older 3M resource from pre-spin-off noted more than 2,000 hospitals had selected the platform since its launch.
By Design
Treatment studies lead the market with nearly 70 % share, driven by the surge in interventional oncology trials assessing the therapeutic value of small molecules, biologics, and cell-based therapies. These trials dominate due to their direct focus on evaluating treatment response, progression-free survival, and overall survival endpoints. Adoption of combination-therapy designs, biomarker-guided arms, and dose-optimization cohorts expands trial complexity and volume. Observational studies grow steadily as real-world evidence gains importance, yet treatment studies remain the core segment as sponsors prioritize efficacy-driven designs to secure faster regulatory approvals.
- For instance, Nuance Communications reports that figure of over 2 billion real-time speech-to-text transactions handled by Dragon Medical One each month is a widely cited statistic in company and press materials, showcasing the immense scale of their cloud operations.
By Cancer Type
Lung cancer accounts for the largest share at roughly 24–26 %, supported by high global incidence, strong funding for immunotherapy and targeted drug development, and broad recruitment availability across regions. Sponsors intensify research on EGFR, ALK, KRAS, and PD-L1 targeted therapies, driving continued trial expansion. Breast cancer follows closely due to extensive biomarker-driven programs and rising demand for precision endocrine and HER2-directed regimens. Additional cancer types such as colorectal, prostate, and hematological malignancies contribute meaningfully, yet lung cancer retains its dominant position due to its extensive therapeutic pipeline and rapid innovation cycle.
Key Growth Drivers
Rising Oncology Drug Pipelines and Accelerated Trial Initiatives
The market grows as pharmaceutical companies expand their oncology pipelines and increase investments in novel immunotherapies, targeted inhibitors, and combination regimens. Faster regulatory pathways such as Breakthrough Therapy and Fast Track designations support quicker trial initiation and enhance trial throughput. The surge in biologics, cell therapies, and tumor-agnostic treatments increases the number of early-phase studies worldwide. Expanding collaborations between CROs, cancer centers, and biopharma sponsors further streamlines study start-up timelines and boosts enrollment efficiency in complex oncology trials.
- For instance, Optum’s Clinical Language Intelligence (CLI) platform is advertised as capable of leveraging advanced AI to automate 100% of clinical documentation review, case identification, and initial code assignment.
Advancements in Precision Medicine and Biomarker-Driven Designs
Precision oncology drives demand for biomarker-stratified trials, adaptive designs, and genomic-guided treatment evaluations. Widespread adoption of NGS panels, liquid biopsies, and companion diagnostics improves patient selection accuracy and reduces trial attrition. Stratified recruitment enhances response-rate endpoints and strengthens evidence generation for smaller, molecularly defined populations. Sponsors increasingly integrate real-time molecular profiling and AI-enabled patient matching to accelerate enrollment. These innovations raise trial success probability and fuel steady demand for biomarker-based oncology studies across pharmaceutical and academic research ecosystems.
- For instance, Epic Systems' EHR software manages over 305 million patient records across various healthcare organizations globally and within the United States. This figure is widely cited in numerous industry reports and Epic's own materials.
Expansion of Global Trial Infrastructure and CRO Capabilities
Growing investments in oncology research infrastructure, especially in Asia-Pacific and Europe, strengthen the market’s global clinical trial footprint. CROs expand capabilities in data management, decentralized operations, and advanced analytics to handle complex oncology protocols. Emerging countries offer competitive operational costs, diverse patient pools, and supportive regulatory reforms, attracting multinational trial sponsors. Expansion of specialized oncology centers, digital patient tracking platforms, and remote-monitoring technologies further enhances trial scalability, efficiency, and multi-regional participation, accelerating the execution of late-phase oncology trials.
Key Trends & Opportunities
Growth of Decentralized and Hybrid Oncology Trials
Oncology trials increasingly adopt decentralized and hybrid models using remote monitoring, ePROs, virtual visits, and home-based sample collection. These models reduce patient burden, improve retention, and support continuous data capture across multi-regional studies. Oncology-specific DCT solutions enable closer symptom tracking and better toxicity reporting, while tele-oncology platforms expand recruitment from rural and underserved areas. This shift offers strong opportunities for CROs, digital health firms, and technology vendors to develop oncology-tailored decentralized trial modules and patient-centric engagement tools.
- For instance, Wolters Kluwer’s UpToDate platform evaluates statistic of the UpToDate platform evaluating over 1.1 billion clinical queries per year is a widely cited metric in Wolters Kluwer's corporate materials and news reports, demonstrating the massive scale of information access by clinicians.
Rising Adoption of AI, Digital Biomarkers, and Real-World Data
AI-driven analytics, digital biomarkers, and real-world evidence platforms transform oncology trial design and execution. Machine learning models enhance patient matching, predict toxicity risks, and streamline protocol optimization. Wearable biosensors support continuous monitoring of vitals and treatment responses, increasing the value of functional endpoints. Real-world data integration strengthens safety assessments and comparative-effectiveness analyses. These advancements open opportunities for tech-enabled CRO partnerships, advanced data platforms, and AI-guided oncology trial strategies that minimize delays and improve outcome predictability.
- For instance, Skillsoft reported a 30% year-over-year (YoY) increase in the number of technology learners on its platform. This figure included a 74% increase specifically in AI learners.
Opportunities in Cell & Gene Therapy and Immuno-Oncology Trials
The rapid expansion of CAR-T, TCR therapies, bispecific antibodies, and personalized cancer vaccines creates strong opportunities for specialized oncology trial services. These advanced modalities require complex logistics, genomic profiling, and highly controlled manufacturing-to-clinic workflows. The rise of tumor-agnostic indications and immuno-modulatory combinations fuels innovative trial designs such as basket and umbrella trials. High unmet needs in hematologic malignancies and solid tumors drive sponsors to pursue accelerated global development programs, expanding opportunities for CROs, biomarker labs, and advanced trial-management technologies.
Key Challenges
High Patient Recruitment Barriers and Enrollment Delays
Oncology trials face persistent challenges in identifying eligible patients due to strict inclusion criteria, biomarker requirements, and competition among multiple concurrent studies. Slow recruitment extends study timelines and raises operational costs. Limited awareness, travel burdens, and the concentration of trials at major academic centers restrict participation from rural and underserved populations. Sponsors continue to face delays in molecular testing turnaround times and referral pathways, complicating patient identification and increasing the likelihood of early dropout or protocol deviations.
Rising Trial Complexity and Escalating Operational Costs
The complexity of oncology protocols, including multi-arm designs, biomarker stratification, and intensive safety monitoring, significantly increases operational burdens. Advanced therapies such as immunotherapies and cell-based treatments require specialized handling, long-term follow-up, and strict regulatory compliance, driving up trial costs. Data volume from genomics, imaging, and digital endpoints adds to analysis complexity. Sponsors must invest heavily in technology, specialized staff, and high-quality site infrastructure, creating substantial financial and logistical challenges that can limit trial scalability.
Regional Analysis
North America
North America dominates the Oncology Clinical Trials Market with an estimated 42–44% share, supported by robust R&D spending, strong biopharmaceutical pipelines, and the high concentration of NCI-designated cancer centers. The region benefits from early adoption of precision oncology, extensive genomic-testing infrastructure, and strong integration of biomarker-driven trial designs. Favorable regulatory pathways, such as the FDA’s breakthrough and accelerated approvals, shorten development timelines and increase sponsor participation. CROs and academic networks actively expand decentralized oncology trial models, improving recruitment efficiency and supporting multi-indication studies across diverse patient groups.
Europe
Europe holds approximately 27–29% share of the Oncology Clinical Trials Market, driven by strong clinical research networks, advanced cancer registries, and harmonized regulatory processes under EMA frameworks. Countries such as Germany, the UK, and Spain lead trial activity due to large oncology patient populations and specialized oncology centers. The region benefits from rising adoption of adaptive trial designs, increased genomic profiling, and widespread public–private partnerships supporting immuno-oncology and rare cancer studies. Growing investment in digital healthcare infrastructure and cross-border research programs strengthens multi-country oncology trial execution and enhances patient enrollment efficiency.
Asia-Pacific
Asia-Pacific commands nearly 22–24% market share, fueled by rapid expansion of cancer incidence, competitive trial costs, and significant government support for oncology research. China, Japan, South Korea, and Australia drive regional leadership through strong clinical trial infrastructure, rising domestic biopharma pipelines, and accelerated regulatory reforms that improve study approvals. Large, genetically diverse patient pools enhance recruitment speed, supporting biomarker-enriched and rare-cancer studies. CRO expansion and increased adoption of decentralized and hybrid trial models further strengthen Asia-Pacific’s position as a critical hub for late-phase oncology clinical trials.
Latin America
Latin America captures 4–5% share of the Oncology Clinical Trials Market, benefiting from cost-efficient operations, expanding investigator networks, and a growing prevalence of solid tumors that support accelerated recruitment. Brazil, Mexico, Argentina, and Colombia remain key destinations for multi-country studies due to improving regulatory timelines and strengthened site quality. Increasing investments in diagnostic infrastructure enable better biomarker-based patient selection. Despite progress, variability in approval processes and limited digitalization create operational challenges, though rising CRO partnerships and government-backed trial initiatives continue to enhance the region’s attractiveness for oncology research.
Middle East & Africa (MEA)
The Middle East & Africa region holds around 2–3% share, influenced by improving oncology care capacity, rising cancer detection rates, and government-driven initiatives to strengthen clinical research ecosystems. Countries such as Saudi Arabia, the UAE, and South Africa lead trial participation due to expanding specialized cancer centers and improving regulatory clarity. International sponsors increasingly conduct early-phase feasibility and late-phase recruitment studies here due to access to treatment-naïve populations. However, limited genomic-testing infrastructure and uneven site readiness constrain large-scale oncology trial growth, though ongoing healthcare modernization continues to create new opportunities.
Market Segmentations:
By Phase:
- Phase I
- Phase II
By Design:
- Treatment Studies
- Observational Studies
By Cancer Type:
- Lung Cancer
- Breast Cancer
By Geography
- North America
- U.S.
- Canada
- Mexico
- Europe
- Germany
- France
- U.K.
- Italy
- Spain
- Rest of Europe
- Asia Pacific
- China
- Japan
- India
- South Korea
- South-east Asia
- Rest of Asia Pacific
- Latin America
- Brazil
- Argentina
- Rest of Latin America
- Middle East & Africa
- GCC Countries
- South Africa
- Rest of the Middle East and Africa
Competitive Landscape
The Oncology Clinical Trials Market features a highly competitive environment shaped by global sponsors and contract research organizations, including PAREXEL International Corporation, Syneos Health, AstraZeneca, Medpace, Gilead Sciences, Inc., Merck & Co., Inc., Novotech, PRA Health Sciences, IQVIA Inc, and F. Hoffmann-La Roche Ltd. The Oncology Clinical Trials Market remains highly competitive as global sponsors and CROs intensify investments in precision oncology, immuno-oncology, and advanced trial methodologies. Companies prioritize adaptive designs, biomarker-driven enrollment, and real-time data analytics to improve study efficiency and accelerate regulatory submissions. The growing adoption of decentralized and hybrid trial models enhances patient accessibility and supports continuous monitoring across multi-regional studies. Specialized oncology sites, genomic-testing networks, and AI-enabled recruitment platforms further strengthen competitive differentiation. Strategic collaborations, technology-integrated trial management solutions, and expansion into emerging research hubs continue to shape the competitive landscape and elevate performance standards across the market.
Key Player Analysis
- PAREXEL International Corporation
- Syneos Health
- AstraZeneca
- Medpace
- Gilead Sciences, Inc.
- Merck & Co., Inc.
- Novotech
- PRA Health Sciences
- IQVIA Inc
- Hoffmann-La Roche Ltd
Recent Developments
- In October 2025, Precision BioSciences opened its first U.S. clinical trial site at Massachusetts General Hospital for the Phase 1 ELIMINATE-B study, which is investigating the in vivo gene editing therapy PBGENE-HBV for chronic hepatitis B.
- In July 2025, NeOnc Technologies Holdings, Inc., a clinical-stage biotechnology company developing transformative treatments for brain and central nervous system cancers, signed a definitive agreement for a strategic partnership with Abu Dhabi-based Quazar Investment.
- In May 2025, ImmunityBio partnered with Saudi Arabia’s Ministry of Investment, KFSHRC, and KAIMRC to launch the FDA-approved Cancer BioShield platform, introducing immune-restorative therapies targeting NK and T cells. The initiative aimed to enhance cancer care and foster regional collaboration.
- In January 2025, Charles River Laboratories launched the Apollo for CRADL cloud platform to streamline vivarium rental and research processes, but the expansion of in-vitro oncology services occurred as part of a broader, ongoing strategy that included specific partnership announcements in the past.
Report Coverage
The research report offers an in-depth analysis based on Phase, Design, Cancer Type and Geography. It details leading market players, providing an overview of their business, product offerings, investments, revenue streams, and key applications. Additionally, the report includes insights into the competitive environment, SWOT analysis, current market trends, as well as the primary drivers and constraints. Furthermore, it discusses various factors that have driven market expansion in recent years. The report also explores market dynamics, regulatory scenarios, and technological advancements that are shaping the industry. It assesses the impact of external factors and global economic changes on market growth. Lastly, it provides strategic recommendations for new entrants and established companies to navigate the complexities of the market.
Future Outlook
- Precision oncology will drive more biomarker-stratified and genomically guided clinical trial designs.
- AI and machine learning will accelerate protocol optimization and patient-matching efficiency.
- Decentralized and hybrid oncology trials will expand to improve accessibility and reduce patient burden.
- Immuno-oncology and cell therapy programs will increase the number of complex, multi-arm studies.
- Real-world evidence will strengthen regulatory submissions and long-term safety assessments.
- Asia-Pacific will gain greater trial volume due to fast recruitment and improving regulatory reforms.
- Digital biomarkers and wearable monitoring will enhance real-time toxicity tracking.
- Adaptive and platform trial models will shorten study timelines and boost design flexibility.
- CROs will expand specialized oncology capabilities to manage high data complexity.
- Global collaborations between sites, sponsors, and technology partners will deepen trial scalability and innovation.
Request a Free Sample
Fill in your details and we'll send you a free sample report.
- Sample data tables & charts
- Research methodology
Need a Custom Version of This Report?
Tailor the scope, geography, or segments to your exact requirements.
- Custom geography or segment scope
- Direct access to our analyst team
Frequently Asked Questions
What is the current market size for the Oncology Clinical Trials Market, and what is its projected size in 2032?
At what Compound Annual Growth Rate is the Oncology Clinical Trials Market projected to grow between 2025 and 2032?
Which trial design segment will post the highest CAGR in the forecast period?
What are the primary factors fueling the growth of the Oncology Clinical Trials Market?
Who are the leading companies in the Oncology Clinical Trials Market?
Table of Content
Chapter 1. Report Introduction
- 1.1 Report Description & Purpose
- 1.1.1 Report Title & Market Definition
- 1.1.2 Unique Selling Propositions (USP) & Key Differentiators
- 1.1.3 Value Proposition for Stakeholders
- 1.2 Research Objectives
- 1.2.1 Market Sizing Objectives (Volume & Revenue)
- 1.2.2 Segmentation Objectives
- 1.2.3 Competitive Intelligence Objectives
- 1.2.4 Forecast & Scenario Objectives
- 1.3 Report Scope
- 1.3.1 Oncology Clinical Trials Scope – Types & Subtypes Covered
- 1.3.2 Geographic Scope – Regions & Countries Covered
- 1.3.3 Historical Period, Base Year & Forecast Period (2024; forecast to 2032)
- 1.3.4 Inclusions & Exclusions
- 1.4 HS Code & Classification Framework
- 1.5 Currency, Units & Pricing Basis
- 1.6 Target Stakeholders
- 1.7 Limitations & Assumptions
Chapter 2. Executive Summary
- 2.1 Global Oncology Clinical Trials Market Snapshot
- 2.1.1 Market Size – Historical (2024) & Forecast (2024-2032) (2024: USD 17143 million → 2032: USD 32226.69 million)
- 2.1.2 Volume & Revenue – Global Totals
- 2.1.3 Key Market Highlights – Top Five Facts
- 2.2 Oncology Clinical Trials Market Segmentation Snapshot
- 2.2.1 Market Split by Region – 2024 vs. 2032
- 2.3 Competitive Snapshot
- 2.3.1 Top 10 Players by Revenue Share – 2024
- 2.3.2 Top 10 Players by Volume Share – 2024
- 2.3.3 Recent Strategic Developments (18-Month Summary)
- 2.4 Key Investment Highlights & Strategic Conclusions
Chapter 3. Oncology Clinical Trials Market Dynamics & Industry Analysis
- 3.1 Market Overview & Context
- 3.1.1 Oncology Clinical Trials Market Position in the Broader Automotive Value Chain
- 3.1.2 OEM vs. Replacement Market Dynamics
- 3.1.3 Market Maturity & Development Stage by Region
- 3.2 Oncology Clinical Trials Market Drivers
- 3.3 Oncology Clinical Trials Market Restraints & Challenges
- 3.4 Oncology Clinical Trials Market Opportunities
- 3.5 Porter's Five Forces Analysis
- 3.5.1 Threat of New Entrants
- 3.5.2 Bargaining Power of Suppliers
- 3.5.3 Bargaining Power of Buyers
- 3.5.4 Threat of Substitutes
- 3.5.5 Competitive Rivalry – Intensity Assessment
- 3.6 Oncology Clinical Trials Value Chain Analysis
- 3.6.1 Upstream – Raw Material/Input Suppliers
- 3.6.1.1 Raw Material/Input 1
- 3.6.1.2 Raw Material/Input 2
- 3.6.1.3 Raw Material/Input 3
- 3.6.2 Midstream – Production/Manufacturing/Service Delivery
- 3.6.2.1 Production/Process Overview
- 3.6.2.2 Key Facility Locations & Capacity by Manufacturer
- 3.6.3 Downstream – Distribution & End Consumer
- 3.6.3.1 Primary Channel – B2B/OEM
- 3.6.3.2 Secondary Channels – Dealer, Retail, Online, Direct
- 3.6.4 Value Chain Profitability Analysis
- 3.6.1 Upstream – Raw Material/Input Suppliers
- 3.7 PESTEL Analysis
- 3.7.1 Political Factors
- 3.7.2 Economic Factors
- 3.7.3 Social Factors
- 3.7.4 Technological Factors
- 3.7.5 Environmental Factors
- 3.7.6 Legal Factors
- 3.8 Oncology Clinical Trials Supply Chain Analysis
- 3.8.1 Raw Material/Input Supply Risk Assessment
- 3.8.2 Manufacturing Concentration Risk (Geographic Exposure)
- 3.8.3 Trade Disruption Impact Analysis
- 3.9 Regulatory & Policy Landscape
Note: The regulatory and policy landscape section covers regulations based on their applicability to the market, Oncology Clinical Trials category, geography, and scope of the study. Only regulatory frameworks with a material impact on operations, compliance, trade, sustainability, or market access are analyzed in detail.
Chapter 4. Key Investment Pockets & Opportunity Analysis
- 4.1 Oncology Clinical Trials Market Attractiveness Analysis
- 4.1.1 By Region – Investment Attractiveness Matrix (Volume × CAGR)
- 4.2 Absolute Revenue Growth Opportunity
- 4.2.1 By Region – Absolute USD Growth Through 2032
- 4.3 Incremental Volume Opportunity
- 4.3.1 By Region – Incremental Volume Through 2032
- 4.3.2 Segment – Incremental Volume
- 4.4 Emerging Submarket Opportunity Deep Dive (Subject to Applicability)
- 4.5 Emerging Market Opportunity Scorecards
- 4.5.1 United States
- 4.5.2 Europe
- 4.5.3 Asia
- 4.5.4 Middle East & Africa
Note: Emerging Market Opportunity Scorecards will be included based on relevance and strategic importance. Regions listed are indicative and may vary depending on data availability and market dynamics.
Chapter 5. Oncology Clinical Trials Import-Export Analysis & Trade Flows
- 5.1 Global Trade Overview
- 5.1.1 Global Export Value by Country (2024)
- 5.1.2 Global Export Volume by Country (2024)
- 5.1.3 Global Import Value by Country (2024)
- 5.1.4 Global Import Volume by Country (2024)
- 5.1.5 Net Trade Balance by Country (2024)
- 5.2 Export Analysis – Segment
- 5.2.1 Type 1 (HS Code)
- 5.2.2 Type 2 (HS Code)
- 5.2.3 Type 3 (HS Code)
- 5.2.4 Type 4 (HS Code)
- 5.2.5 Type 5 (HS Code)
- 5.3 Import Analysis – Segment
- 5.3.1 Type 1 (HS Code)
- 5.3.2 Type 2 (HS Code)
- 5.3.3 Type 3 (HS Code)
- 5.3.4 Type 4 (HS Code)
- 5.3.5 Type 5 (HS Code)
- 5.4 Average Unit Trade Prices
- 5.4.1 Average Export Price – Segment & Country
- 5.4.2 Average Import Price – Segment & Source Country
- 5.4.3 Price Trends (2024)
- 5.5 Key Trade Route Analysis
- 5.5.1 Trade Route 1
- 5.5.2 Trade Route 2
- 5.5.3 Trade Route 3
- 5.5.4 Trade Route 4
- 5.5.5 Trade Route 5
- 5.6 Trade Policy Impact Assessment
- 5.6.1 US Anti-Dumping & Section 301 Tariffs
- 5.6.2 EU Customs Union Impact
- 5.6.3 Major Free Trade Agreements
- 5.6.4 USMCA Rules of Origin
Note: Trade policy analysis will be included only where relevant to the Oncology Clinical Trials market.
Chapter 6. Competitive Landscape & Company Benchmarking
- 6.1 Oncology Clinical Trials Market Concentration & Structure
- 6.1.1 Herfindahl-Hirschman Index (HHI) – vs. 2024
- 6.1.2 Tier 1, Tier 2 & Tier 3 Market Structure
- 6.1.3 Global, Regional & Local Player Dynamics
- 6.2 Oncology Clinical Trials Market Share Analysis – 2024
- 6.2.1 Global Revenue Share by Company
- 6.2.2 Global Volume Share by Company
- 6.2.3 Regional Revenue Share
- 6.2.4 Market Share Evolution ( vs. 2024)
- 6.2.5 OEM Segment Share by Company
- 6.2.6 Replacement Segment Share by Company
- 6.3 Production/Delivery Capacity & Facility Analysis
- 6.3.1 Global Installed Capacity
- 6.3.2 Capacity Utilization Rates
- 6.3.3 Production/Output Volume
- 6.3.4 Facility Locations & Capacity Map
- 6.3.5 Planned Capacity Additions
- 6.4 Oncology Clinical Trials Competitive Benchmarking Matrix
- 6.4.1 Revenue, Volume, CAGR & Profitability Comparison
- 6.4.2 Channel Revenue Mix
- 6.4.3 Geographic Revenue Exposure
- 6.4.4 R&D Intensity
- 6.4.5 Sustainability Maturity
- 6.5 Strategic Developments in Oncology Clinical Trials (Last 24 Months)
- 6.5.1 Mergers, Acquisitions & Divestments
- 6.5.2 New Oncology Clinical Trials Launches
- 6.5.3 Facility Expansions
- 6.5.4 Strategic Alliances, Joint Ventures & Partnerships
- 6.5.5 Distribution Expansion & Market Entry
- 6.5.6 Sustainability & ESG Initiatives
- 6.6 Competitive Strategy Mapping
- 6.6.1 Leader, Challenger, Follower & Niche Classification
- 6.6.2 Pricing Strategy Comparison
- 6.6.3 Channel Strategy Matrix
Note: Strategic developments are included based on their materiality and the availability of reliable information.
Chapter 7. Global Oncology Clinical Trials Market – By Distribution Channel
- 7.1 Segment Overview
- 7.1.1 Volume & Revenue Split by Channel (2024 & 2032)
- 7.1.2 Channel Mix Evolution (2024-2032)
Chapter 8. Regional Market Analysis – Global Overview
- 8.1 Global Regional Overview
- 8.1.1 Regional Volume Share
- 8.1.2 Regional Revenue Share
- 8.1.3 Regional Volume by Region
- 8.1.4 Regional Revenue by Region
- 8.1.5 Regional Forecast Through 2032
- 8.2 Cross-Regional Segment Analysis
- 8.2.1 By Distribution Channel
- 8.2.2 By Brand/Price Tier
Chapter 9. North America Oncology Clinical Trials Market
- 9.1 United States
- 9.2 Canada
- 9.3 Mexico
Chapter 10. Europe Oncology Clinical Trials Market
- 10.1 Germany
- 10.2 France
- 10.3 Italy
- 10.4 United Kingdom
- 10.5 Spain
- 10.6 Poland
- 10.7 Russia
- 10.8 Netherlands
- 10.9 Belgium
- 10.10 Sweden
- 10.11 Denmark
- 10.12 Norway
- 10.13 Rest of Europe
Chapter 11. Asia Pacific Oncology Clinical Trials Market
- 11.1 China
- 11.2 India
- 11.3 Japan
- 11.4 South Korea
- 11.5 Thailand
- 11.6 Indonesia
- 11.7 Vietnam
- 11.8 Malaysia
- 11.9 Australia
- 11.10 Rest of Asia Pacific
Chapter 12. Latin America Oncology Clinical Trials Market
- 12.1 Brazil
- 12.2 Argentina
- 12.3 Colombia
- 12.4 Chile
- 12.5 Rest of Latin America
Chapter 13. Middle East Oncology Clinical Trials Market
- 13.1 Saudi Arabia
- 13.2 United Arab Emirates
- 13.3 Turkey
- 13.4 Israel
- 13.5 Iran
- 13.6 Rest of the Middle East
Chapter 14. Africa Oncology Clinical Trials Market
- 14.1 South Africa
- 14.2 Egypt
- 14.3 Nigeria
- 14.4 Morocco
- 14.5 Rest of Africa
Chapter 15. Oncology Clinical Trials Company Profiles
- 15.1 [Company 01]
- 15.1.1 Company Overview
- 15.1.2 Key Management Personnel
- 15.1.3 Products & Services Portfolio
- 15.1.4 Financial Performance
- 15.1.5 Key Market Focus & Geographic Presence
- 15.1.6 Recent Developments & Strategic Initiatives
Note: The company profile list is preliminary and may change based on research findings, market developments, data availability, and client requirements.
Chapter 16. Appendices
- Appendix A – List of Abbreviations & Acronyms
- Appendix B – Industry Classification Code Reference – Full Series
- Appendix C – Production & Capacity Data Tables
- Appendix D – End-Use & Demand Base Tables
- Appendix E – Consumption & Replacement Rate Assumptions
- Appendix F – ASP Reference Tables
- Appendix G – Manufacturing & Facility Database
- Appendix H – Import-Export Data Tables
- Appendix I – Regulatory Summary Tables
- Appendix J – Primary Research Participant List (Anonymized)
- Appendix K – Primary Research Questionnaire Framework
- Appendix L – Data Sources & Bibliography
- Appendix M – Market Size Divergence & Source Comparison
Chapter 17. Research Methodology
- 17.1 Research Framework & Philosophy
- 17.2 Secondary Research – Sources, Hierarchy & Data Extraction
- 17.3 Data Modeling – Bottom-Up & Top-Down Market Sizing
- 17.4 Primary Research – Stakeholder Framework, LOI & Sample Sizes
- 17.5 Forecast Methodology – Regression, Scenario & Sensitivity Analysis
- 17.6 Quality Control – Four-Layer Validation Framework
- 17.7 Limitations & Standard Assumptions
- 17.8 Disclaimer
