CDMO market expands as drugmakers outsource biologics
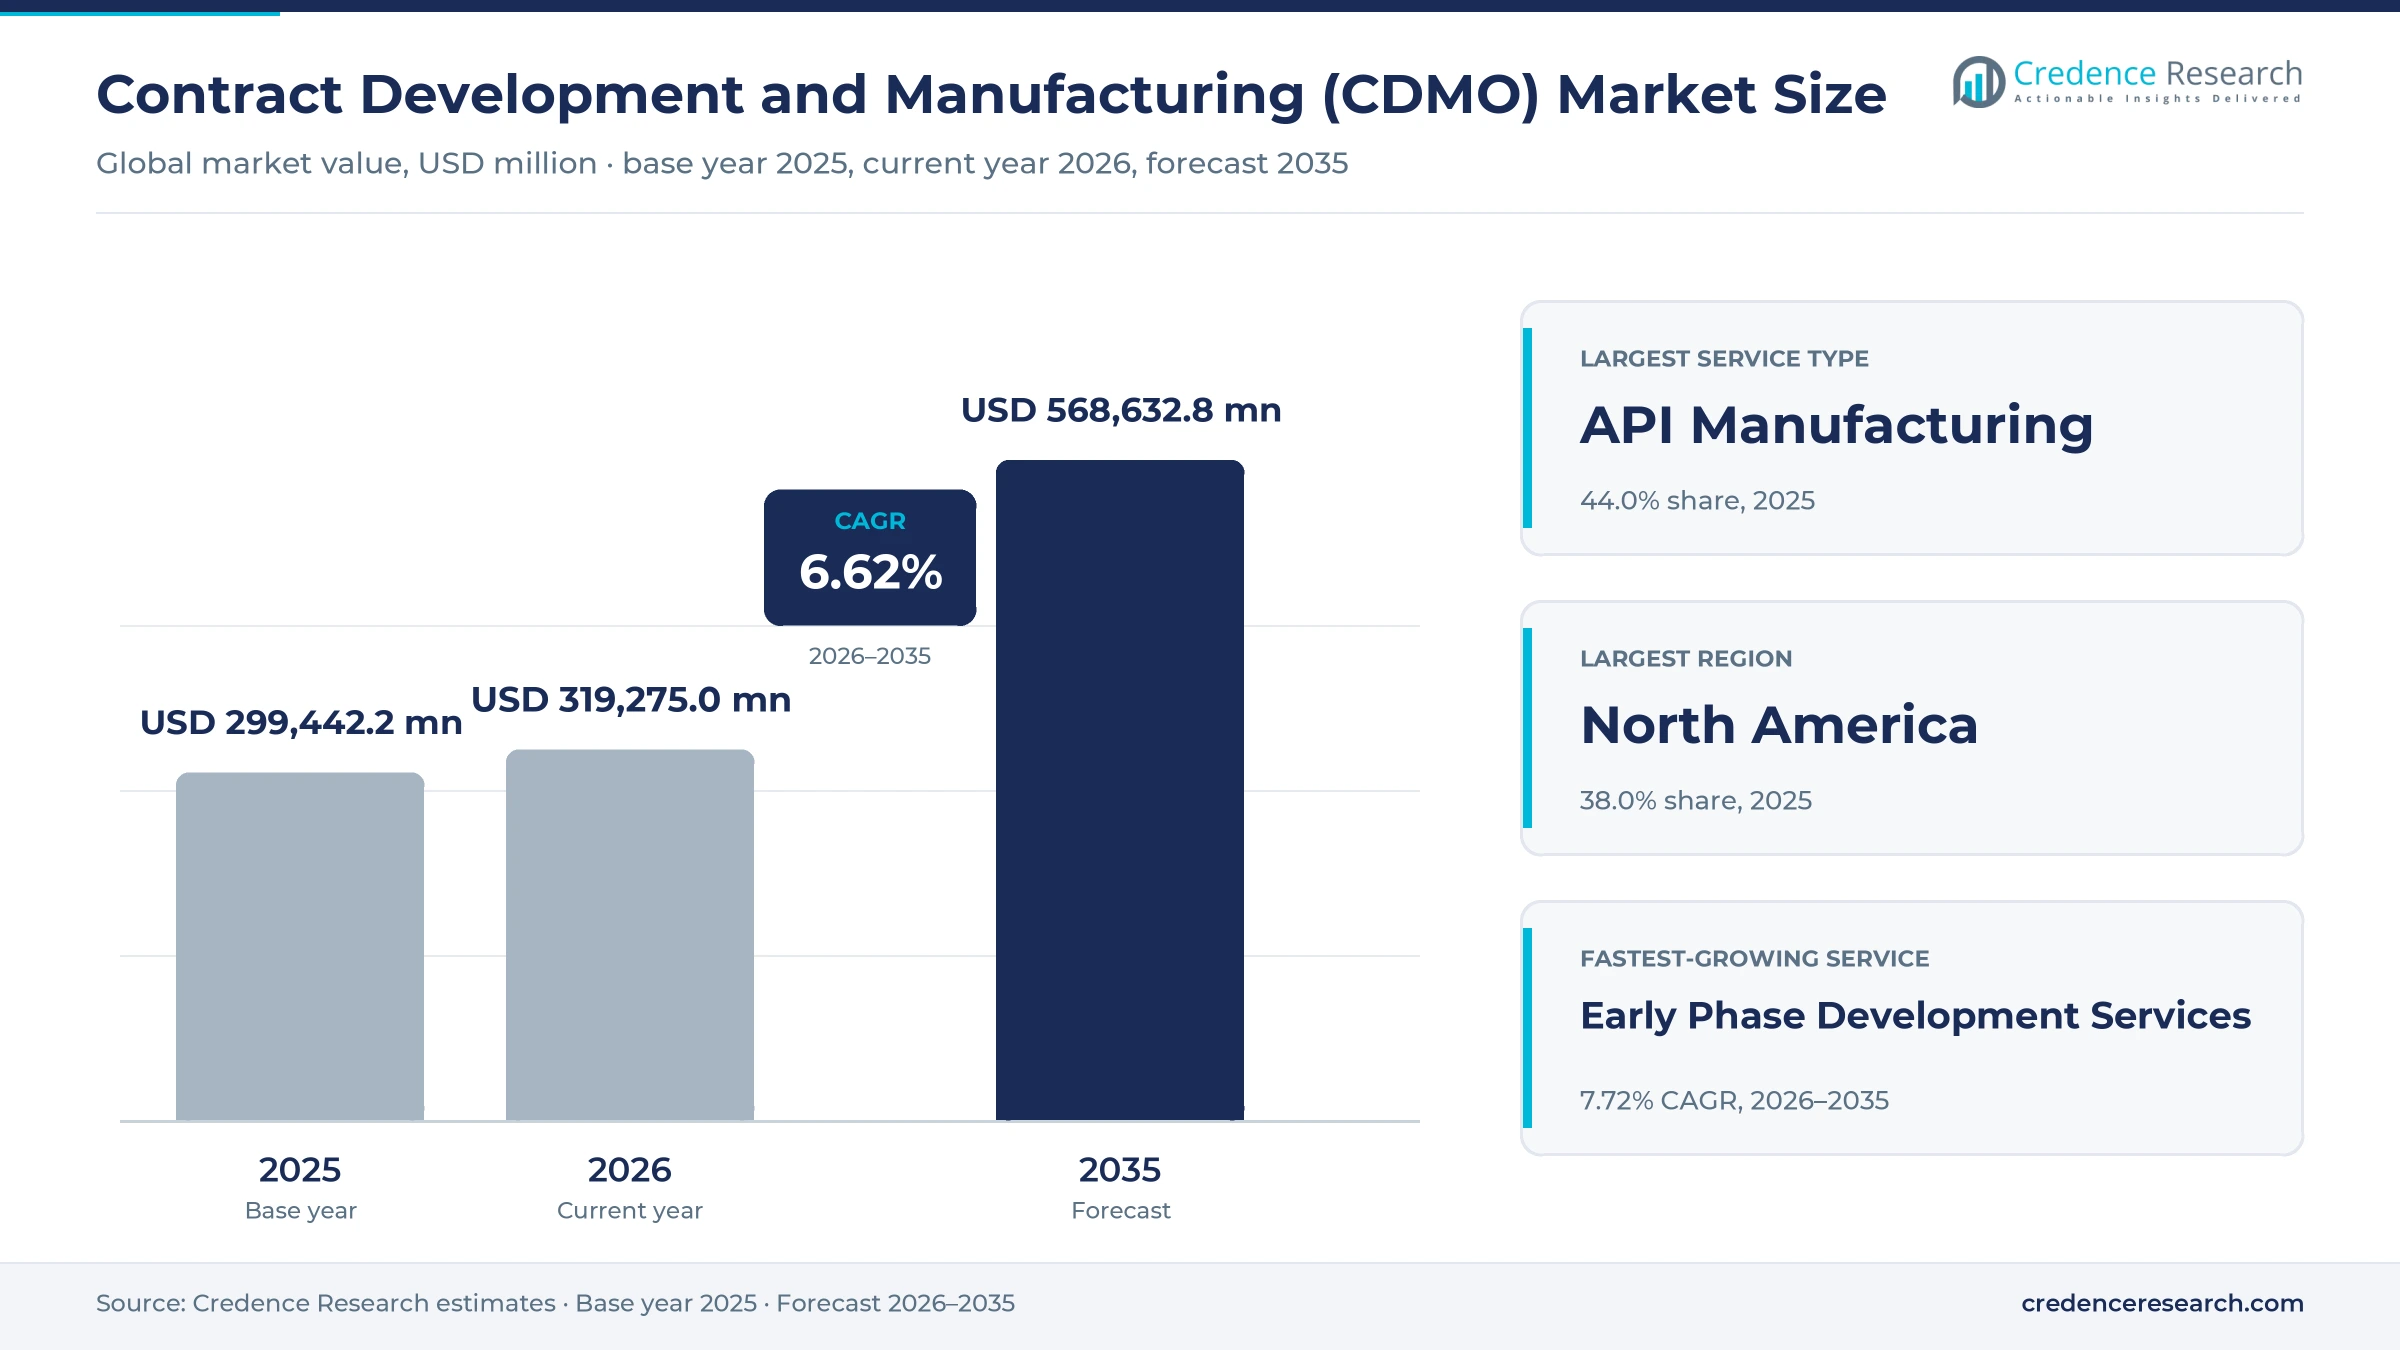
The global contract development and manufacturing (CDMO) market was valued at USD 299.44 billion in 2025 and is projected to increase from USD 319.28 billion in 2026 to USD 568.63 billion by 2035, registering a CAGR of 6.62% during 2026–2035. Demand comes from crowded biologics pipelines, the cost of building in-house plants and the growing number of small biotech companies that have no production assets of their own. North America held the largest regional share, 38.0% in 2025, because most drug sponsors and regulator-inspected sterile sites are based there. Asia Pacific is the fastest-growing region at 7.56% a year, as South Korea, India and China add large bioreactor capacity for global clients. The commercial picture shifted between 2024 and 2025, when large providers bought existing drugmaker sites in the United States. As a result, capacity close to U.S. patients has become a central selling point for outsourcing partners.
Which services and clients does this analysis cover?
The analysis counts fees paid to outside providers for active ingredient production, finished dosage manufacturing, early phase process and formulation work and related services such as packaging. Pharmaceutical, biotech and chemical companies buy these services through multiyear supply agreements, project contracts and capacity reservations.
Clinical trial management, pure research services and production that drug owners run in their own plants sit outside the scope of this analysis. The value chain runs from raw material and equipment suppliers through outsourcing providers to drug sponsors, distributors and the regulators who inspect every commercial site.
Contract Development and Manufacturing (CDMO) Market Insights
- The contract development and manufacturing market grows from USD 299.44 billion in 2025 to USD 568.63 billion by 2035, a 6.62% CAGR as drug sponsors outsource more biologics and sterile production.
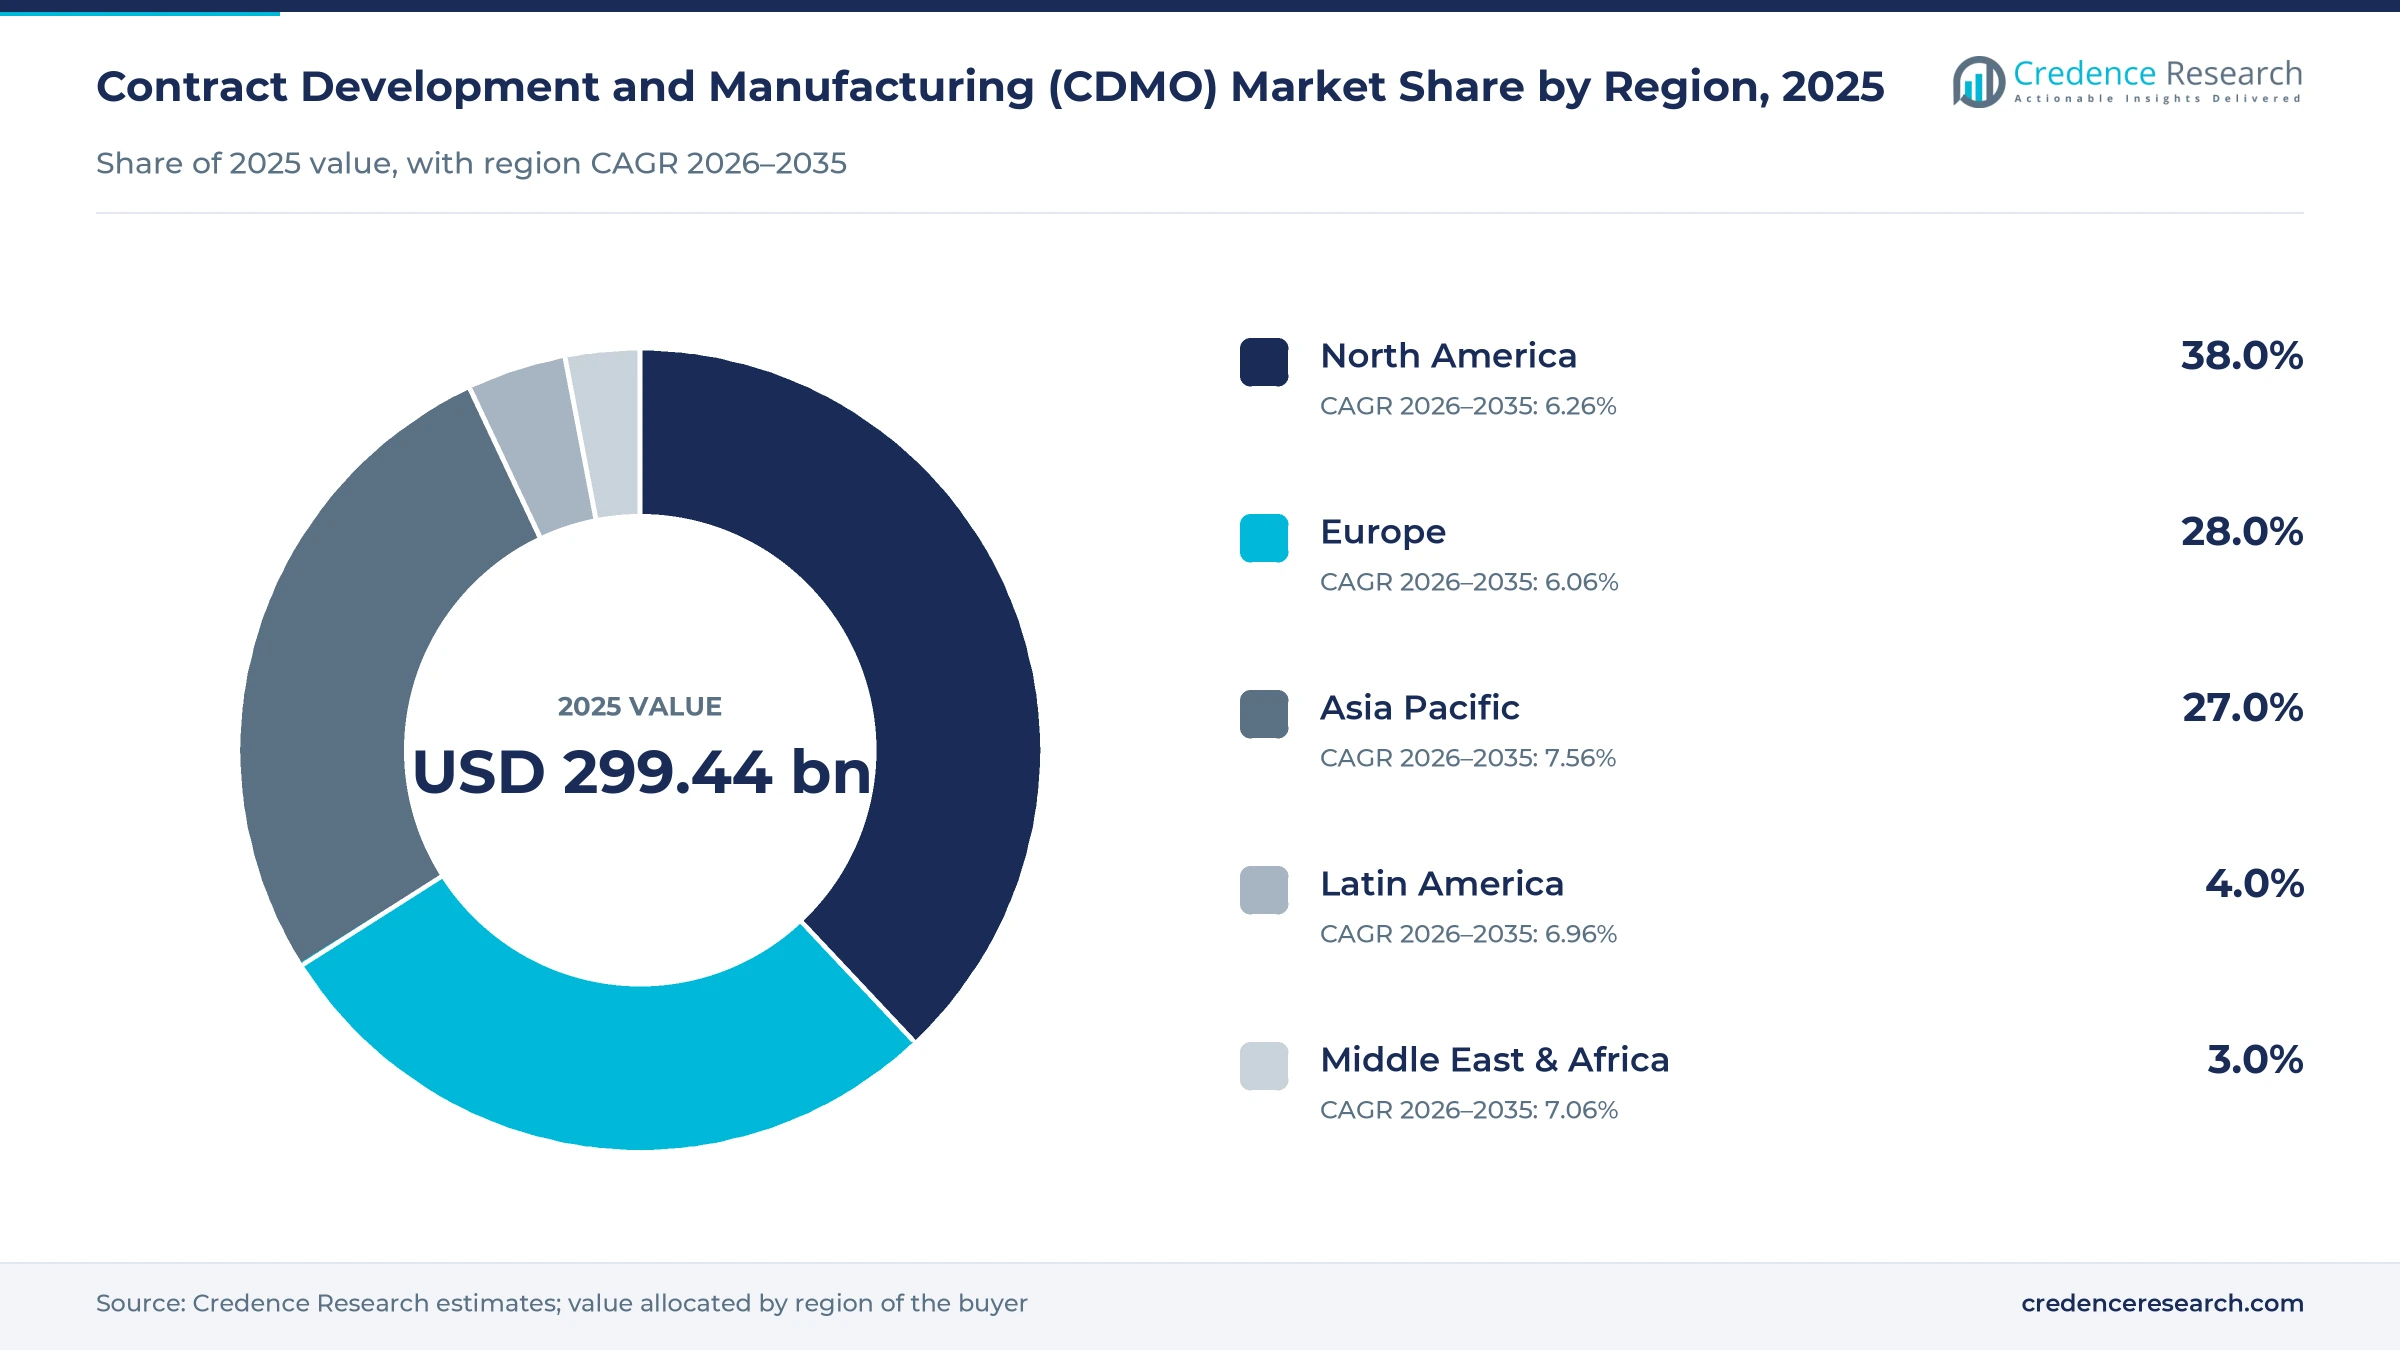
- North America held 38.0% of global outsourced drug production value in 2025, supported by sponsor density and FDA-inspected sites.
- API manufacturing led service types with 44.0% of 2025 value, while early phase development services grow fastest at 7.72% a year.
- In December 2024, Novo Holdings completed its acquisition of Catalent, and three fill-finish sites were set to move to Novo Nordisk soon after the closing.
- Lonza, Thermo Fisher and Samsung Biologics added large U.S. or Korean capacity between October 2024 and September 2025, which raises competition for biologics programs.
API manufacturing leads while early phase work grows fastest
Why does API manufacturing still lead service spending?
Based on service type, the market is categorized into API manufacturing, finished product manufacturing, early phase development services and others. API Manufacturing led with a 44.0% share of 2025 value, because active ingredient synthesis and biologic drug substance production carry the highest cost per batch. The Early Phase Development Services segment grows fastest at 7.72% a year, as venture-funded biotech companies hand process design to outside teams. Finished product work keeps a large base in tablets and sterile injectables.
Which client groups buy the most outsourced production?
Based on end user, the market is categorized into pharmaceutical companies, biotech companies and chemical companies. The Pharmaceutical Companies segment led with a 58.0% share of 2025 value, because large drugmakers outsource mature products and surge volumes across broad portfolios. The Biotech Companies segment grows fastest at 7.54% a year, since many emerging developers rely fully on outside plants from first trials to launch. Chemical companies buy smaller volumes of custom synthesis and intermediates.
| Segment Group | Leading Sub-segment | Share, 2025 | Fastest-growing Sub-segment | CAGR, 2026–2035 |
|---|---|---|---|---|
| By Service Type | API Manufacturing | 44.0% | Early Phase Development Services | 7.72% |
| By End User | Pharmaceutical Companies | 58.0% | Biotech Companies | 7.54% |
Request a Free Sample
Fill in your details and we'll send you a free sample report.
- Sample data tables & charts
- Research methodology
Biologics pipelines and capacity gaps lift outsourcing
How do steady drug approvals sustain outsourcing demand?
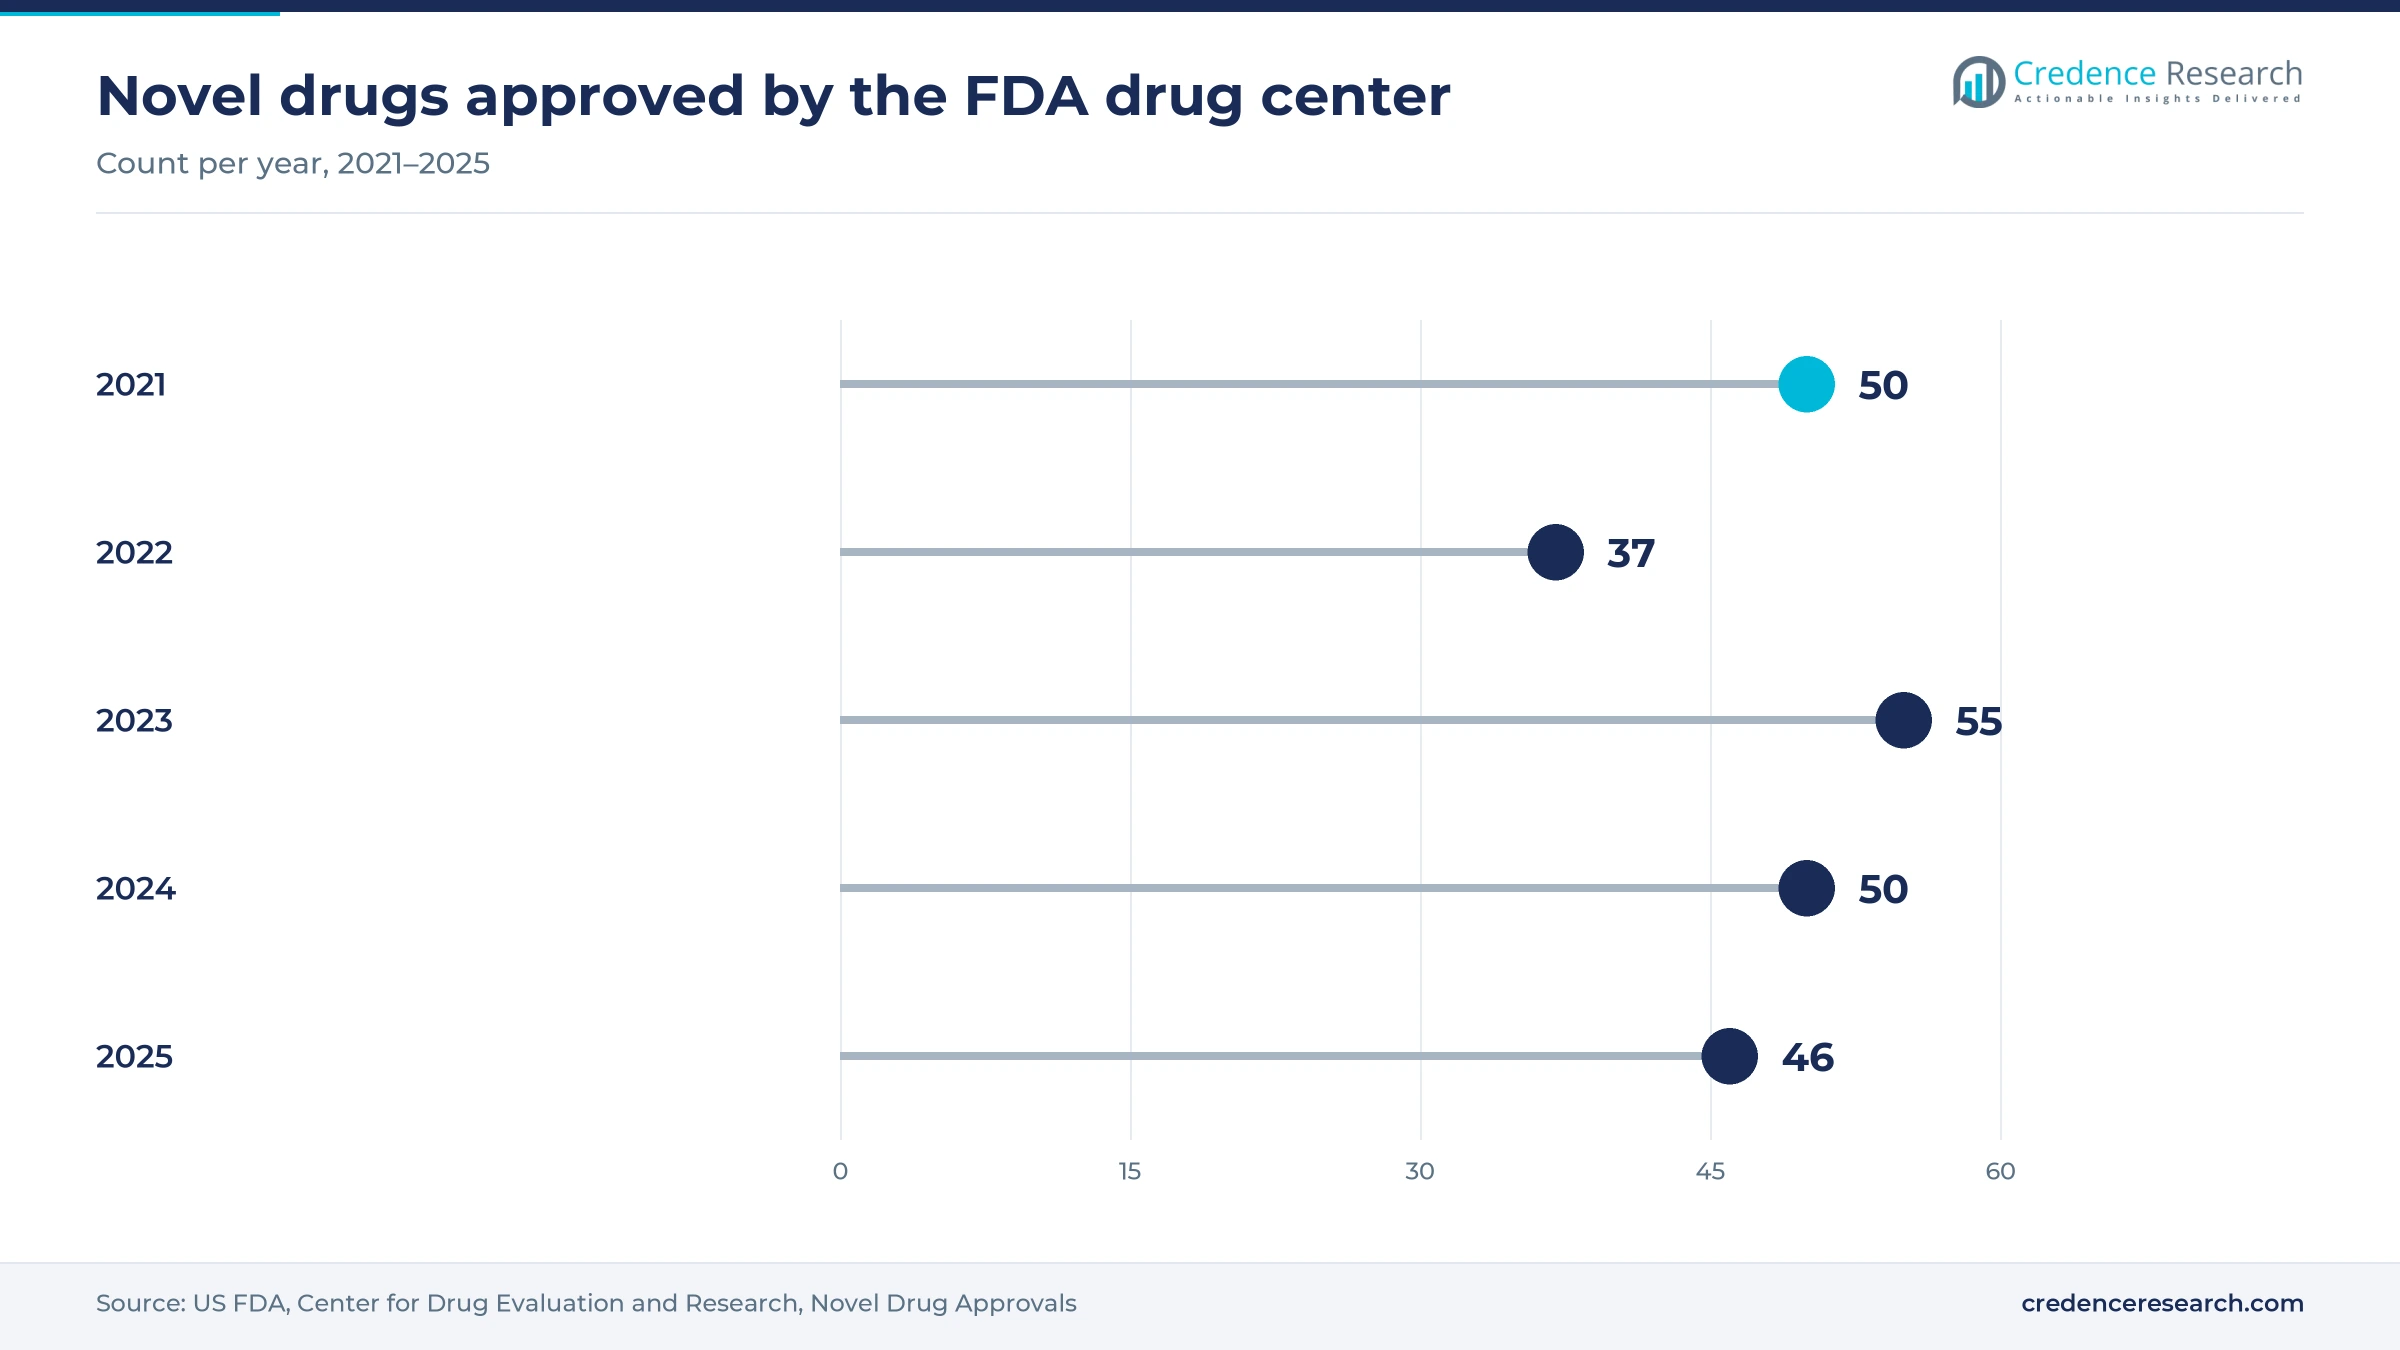
A steady flow of new medicines sustains demand, because every approved product needs validated production for launch and long-term supply. U.S. regulators approved 37 novel drugs in 2022, 55 in 2023, 50 in 2024 and 46 in 2025, according to the FDA drug evaluation center, and many came from companies without their own plants. Each launch usually follows years of outsourced process work and clinical supply batches. As a result, providers that support a molecule early often keep its commercial volume after approval.
Why do complex biologics push sponsors toward outside plants?
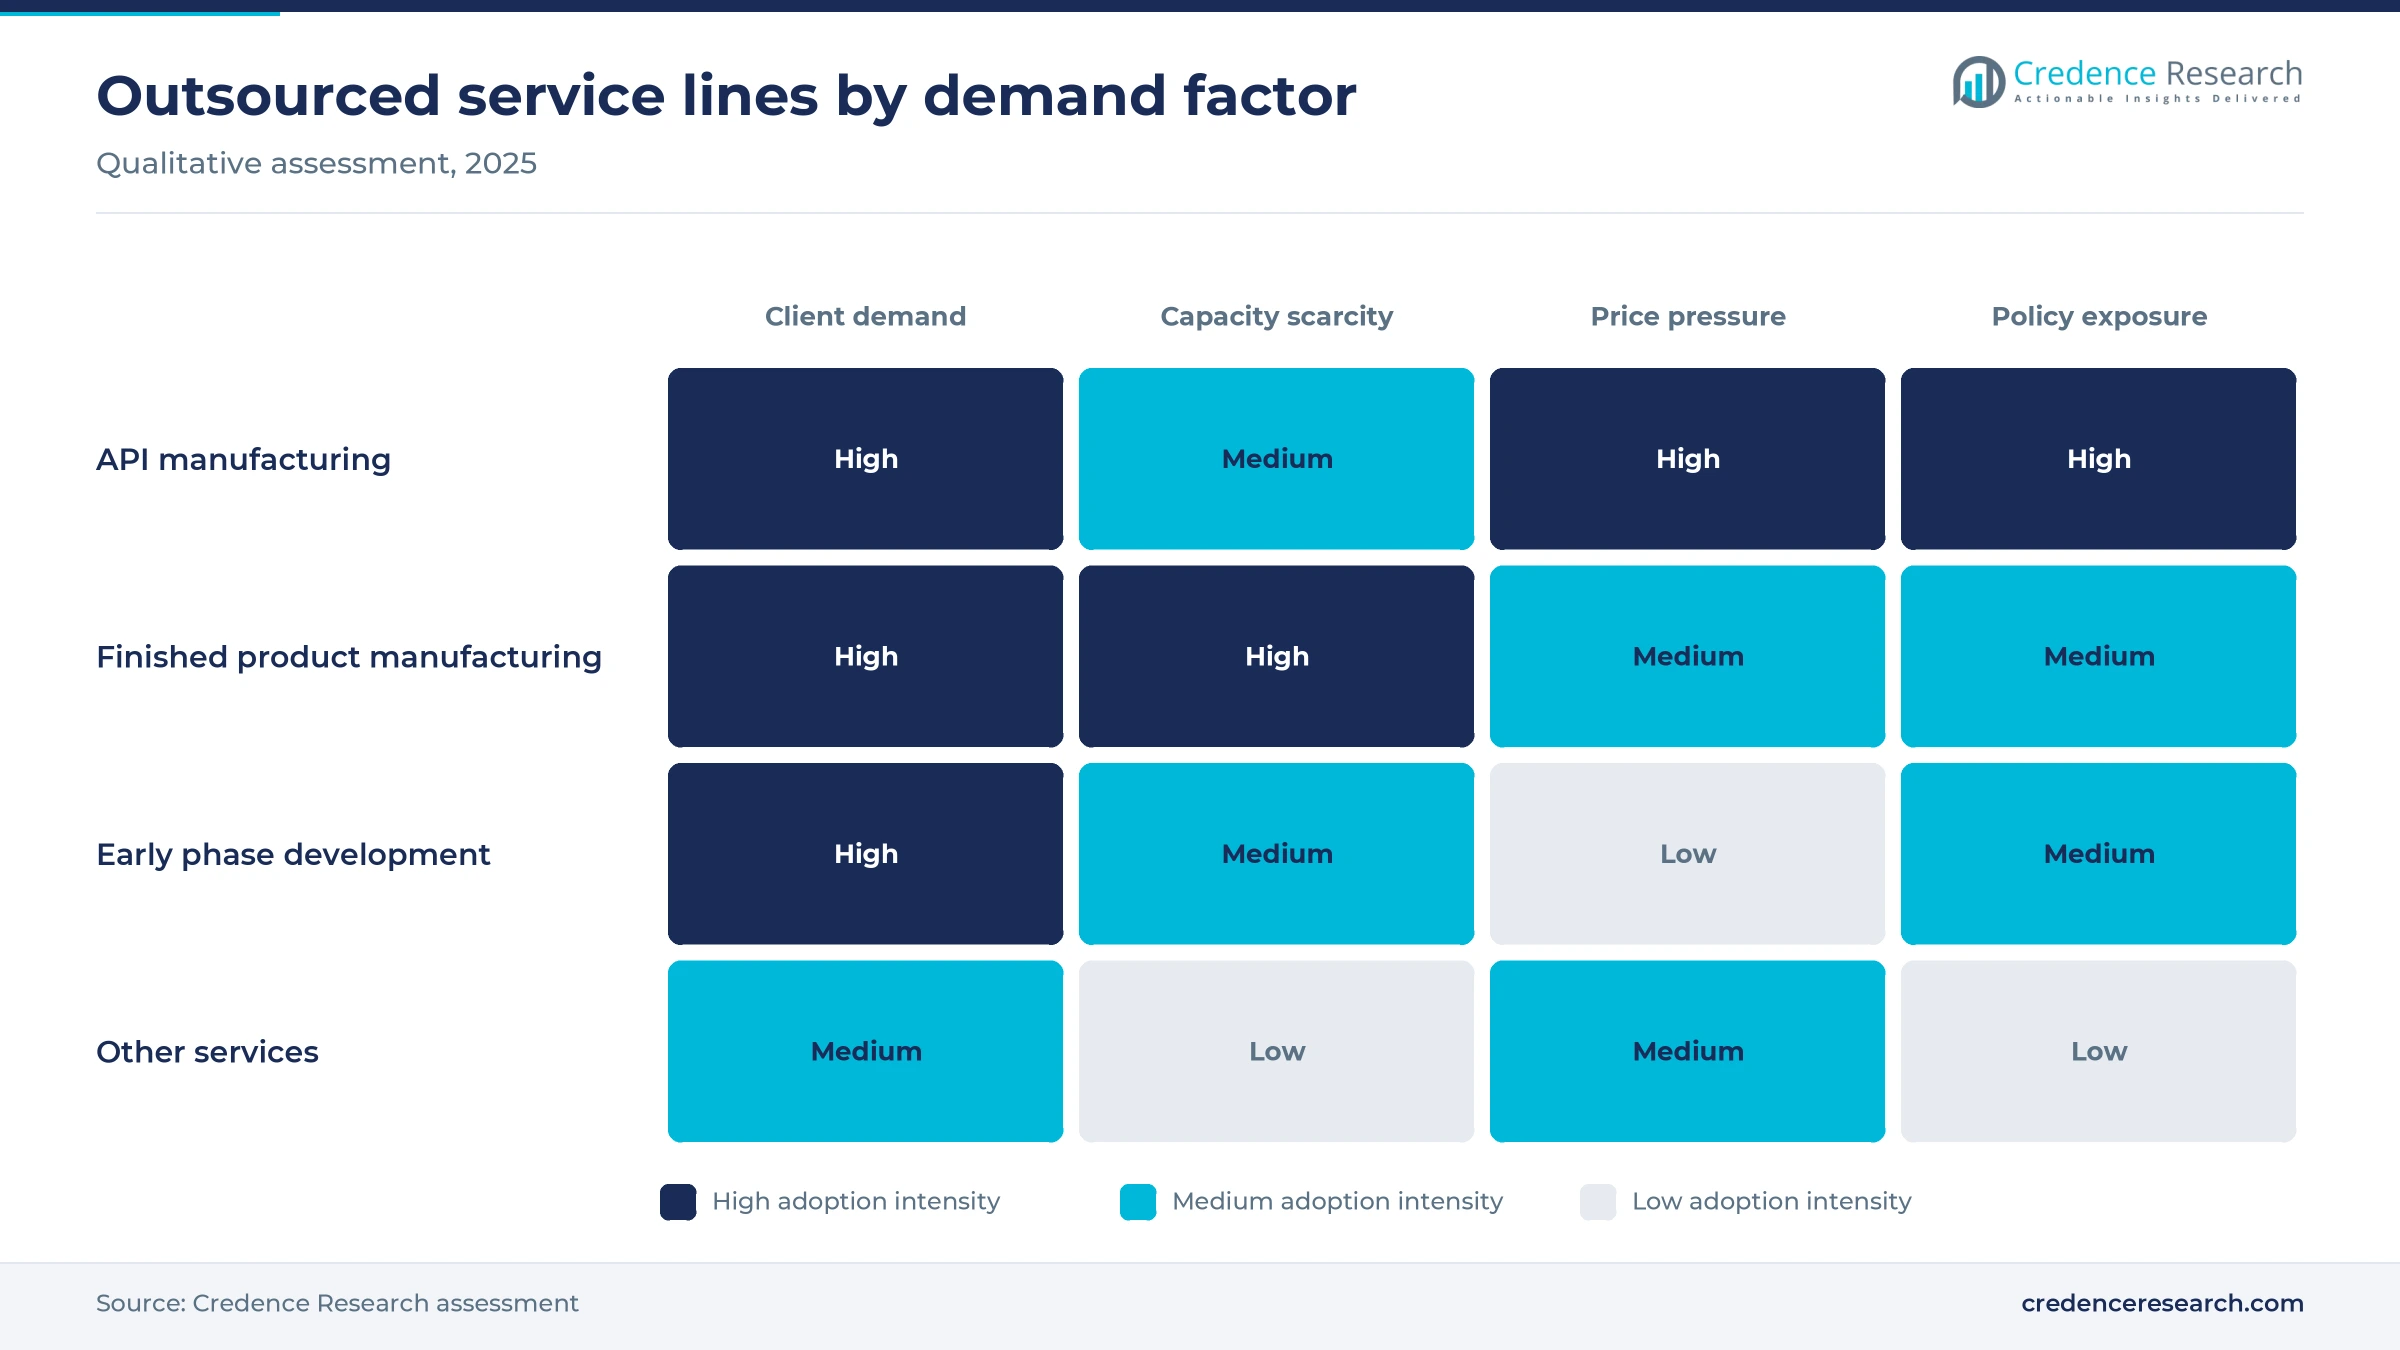
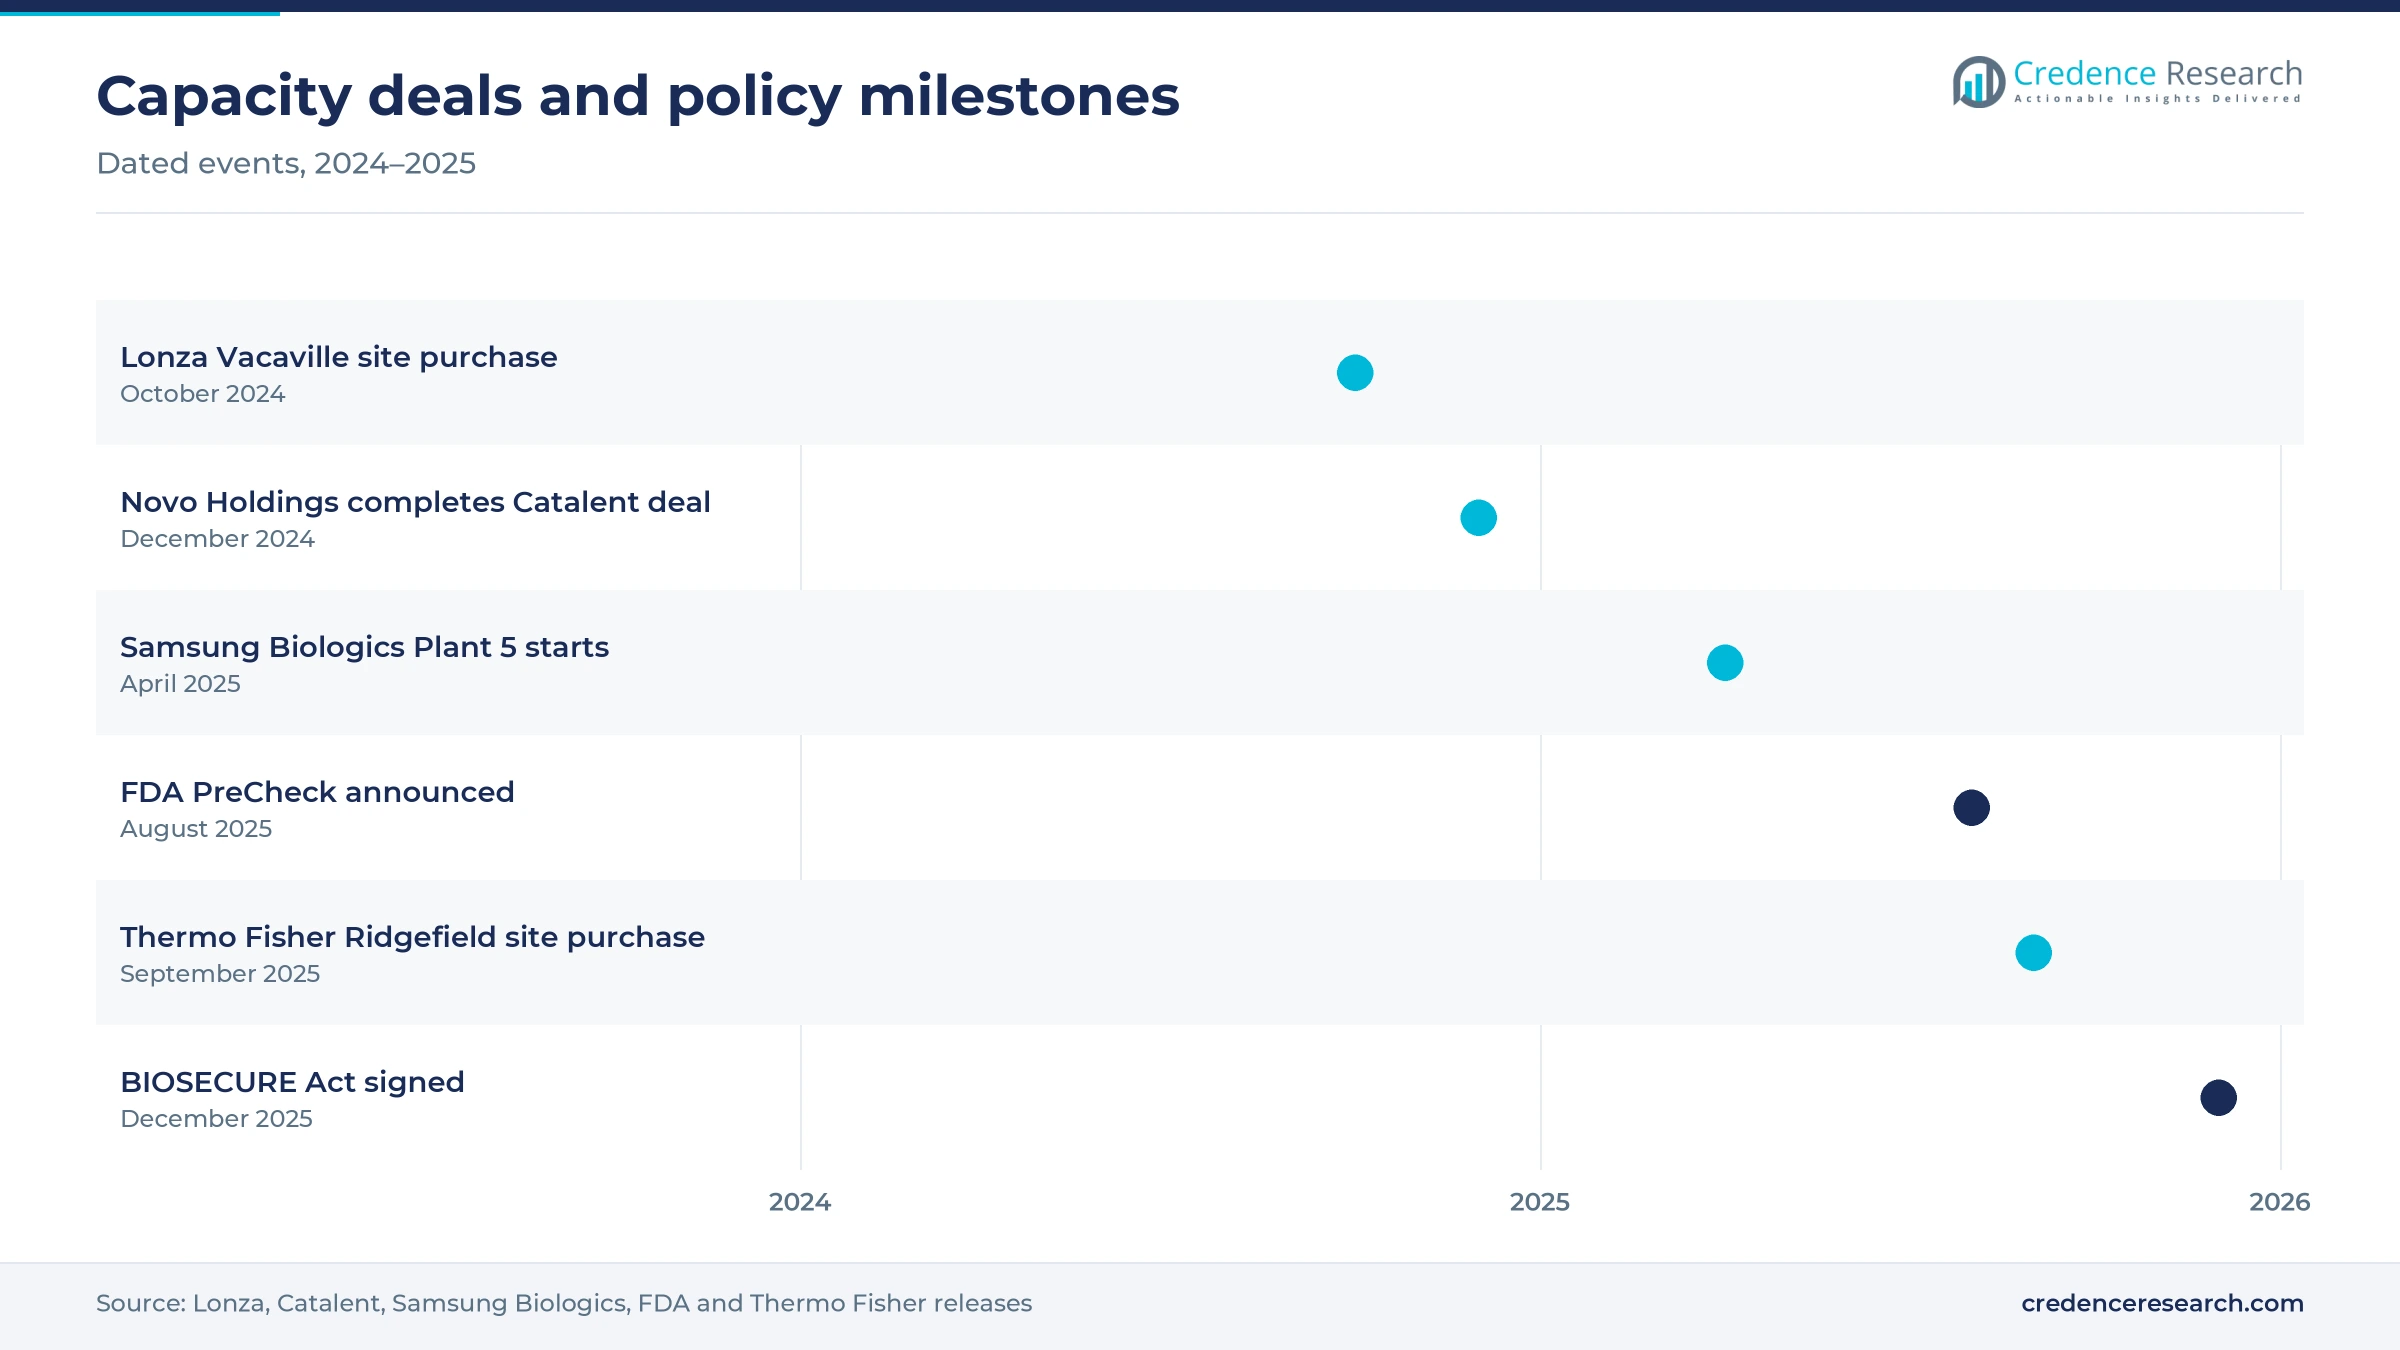
Complex biologics push sponsors toward outside plants, because large bioreactors, sterile suites and specialist staff take years and heavy capital to build. Demand for monoclonal antibodies and newer formats keeps large mammalian capacity in short supply in many years. On Oct. 1, 2024, Lonza completed its purchase of the Vacaville site in California for USD 1.2 billion, which carries around 330,000 liters of bioreactor capacity and adds a West Coast plant to its Portsmouth, New Hampshire site. In turn, sponsors can reserve proven capacity instead of waiting for new construction.
How does demand for metabolic drugs lift fill-finish needs?
Demand for injectable metabolic drugs has lifted fill-finish needs, because prefilled pens and syringes require sterile lines with high output. Rapid growth in GLP-1 receptor agonists made filling capacity a strategic asset for drug owners. In December 2024, Novo Holdings completed its acquisition of Catalent, and three fill-finish sites in Anagni, Italy, Brussels, Belgium and Bloomington, Indiana were set to move to Novo Nordisk. As a result, other sponsors look harder for independent sterile capacity.
Why do biosimilars and patent expiries add volume?
Patent expiries on major biologics add volume, because biosimilar developers often prefer to buy capacity rather than build it. Developers of biosimilars need cost-efficient drug substance and filling that match the reference product closely. Providers with large stainless steel and single-use networks can offer that scale at competitive prices, often across two or three continents. In turn, outsourcing partners gain long supply contracts that run well beyond the launch window of each biosimilar.
Onshoring and large bioreactor builds reshape supply
How is U.S. onshoring shifting site selection?
U.S. onshoring policy is shifting site selection, because regulators and buyers want more production close to American patients. In Aug. 7, 2025, the FDA announced its PreCheck program, a two-phase approach that gives earlier agency engagement during the design and construction of new U.S. drug plants. Providers that already own inspected U.S. sites can offer faster routes to domestic supply. As a result, purchases of existing American plants have become a common growth strategy.
Why is very large bioreactor capacity rising in Asia?
Very large bioreactor capacity is rising in Asia, because providers in South Korea compete on scale and price for global antibody programs. In April 2025, Samsung Biologics began operating its Plant 5 with 180,000 liters of capacity, bringing its total antibody capacity to 784,000 liters. This scale allows the company to run many commercial products in parallel. In turn, Western providers respond with acquisitions and expansions of their own large sites.
Can sterile fill-finish open a supply opportunity?
Sterile fill-finish offers a clear opening, because many new injectables need aseptic lines that drug owners cannot build in time. In September 2025, Thermo Fisher completed its acquisition of the Sanofi site in Ridgefield, New Jersey, a sterile fill-finish and packaging plant that keeps producing medicines for Sanofi, and more than 200 staff joined the company. Deals that pair a site purchase with a supply agreement give providers immediate revenue and staff. As a result, more drugmakers may sell plants to outsourcing partners.
Where can providers win new modality programs?
Providers have room to win programs in conjugates, peptides and potent small molecules, because these products need containment and specialist chemistry. Developers of antibody-drug conjugates must combine a biologic, a linker and a toxic payload under strict safety controls. Few drug owners hold all three skills in one network. As a result, providers that offer integrated conjugation and filling can capture high-value work over the next decade.
Quality audits, policy risk and capital needs limit growth
Why do quality audits and inspection findings slow growth?
Quality audits slow growth, because a single warning letter or failed inspection can delay approvals for every client served by a site. Regulators in the United States and Europe inspect commercial plants regularly, and remediation can take many months. Sponsors therefore spread programs across several suppliers to limit risk. As a result, providers must invest steadily in quality systems, data integrity and staff training to keep their order books full.
How does U.S. policy on foreign biotech suppliers add risk?
U.S. policy on foreign suppliers adds risk, because the BIOSECURE Act was signed into law on Dec. 18, 2025, as Section 851 of the 2026 defense authorization act. The law limits federal contracts with entities that use services from designated biotechnology companies of concern, with a list due by December 2026. Sponsors with U.S. government exposure may move programs to other providers before the rules take effect. In turn, affected providers face slower bookings from American clients.
Why do capital needs and long build times strain providers?
Large capital needs strain providers, because new biologics plants require years of construction, validation and qualification before earning revenue. Demand can shift during that time if a client drug fails in trials or loses market share. Providers carry the cost of idle suites when reserved capacity goes unused. As a result, many companies prefer phased builds or buying existing plants, which reduces risk but raises acquisition prices for good sites.
How do skills shortages limit plant output?
Shortages of skilled staff limit plant output, because aseptic processing, analytical testing and process engineering all require specialist training. New sites in North Carolina, New Jersey and South Korea compete for the same pool of experienced workers. Training programs take time to expand even when demand is strong. In turn, some providers run new lines below planned capacity during the first years after opening.
North America leads as Asia Pacific adds bioreactor capacity
| Region | Value, 2025 (USD billion) | Share, 2025 | CAGR, 2026–2035 |
|---|---|---|---|
| North America | 113.79 | 38.0% | 6.26% |
| Europe | 83.84 | 28.0% | 6.06% |
| Asia Pacific | 80.85 | 27.0% | 7.56% |
| Latin America | 11.98 | 4.0% | 6.96% |
| Middle East & Africa | 8.98 | 3.0% | 7.06% |
Why does North America hold the largest regional share?
North America held a 38.0% share of 2025 value and grows at 6.26% a year through 2035. The United States drives this position, because most venture-funded biotech companies and many large drugmakers are based there. Large providers bought or opened U.S. sites in Vacaville, Ridgefield and Holly Springs between 2024 and 2025. Fujifilm announced the opening of its Holly Springs plant in September 2025 with eight 20,000-liter bioreactors in the first phase and eight more planned in a second phase, for 16 in total. This expansion keeps sponsor demand anchored in domestic plants for the coming decade.
What shapes demand across Europe?
Europe held a 28.0% share of 2025 value and grows at 6.06% a year, the slowest pace of the five regions. Switzerland, Germany, Ireland, Italy and Belgium host dense networks of sterile and small molecule plants that serve global clients. Long regulatory track records help these sites keep commercial products for many years. However, higher energy and labor costs limit new construction, so growth comes mainly from upgrades and site transfers between drugmakers and providers.
How fast is Asia Pacific adding capacity?
Asia Pacific held a 27.0% share of 2025 value and is the fastest-growing region at 7.56% a year. South Korea leads biologics growth through very large antibody plants, including 784,000 liters of antibody capacity at Samsung Biologics in 2025, while India supplies active ingredients and finished generic doses worldwide. China remains a major source of chemistry services, although U.S. policy changes push some sponsors to diversify. In turn, providers in India and Southeast Asia gain inquiries from clients seeking alternative suppliers.
Where is Latin America adding demand?
Latin America held a 4.0% share of 2025 value and grows at 6.96% a year through 2035. Brazil and Mexico lead regional demand through local generic production and public vaccine programs. Regional providers mainly serve domestic markets, which limits exposure to global biologics contracts.
What limits growth in the Middle East and Africa?
The Middle East and Africa held a 3.0% share of 2025 value and grows at 7.06% a year through 2035. Gulf states fund new pharmaceutical plants to reduce reliance on imports. Africa still imports most medicines, so local outsourced production remains small outside a few countries.
Site deals and plant openings since late 2024
| Development | Status and market relevance |
|---|---|
| In October 2024, Lonza completed its acquisition of the Vacaville, California biologics site from Roche. | Completed; adds around 330,000 liters of mammalian bioreactor capacity on the U.S. West Coast |
| In December 2024, Novo Holdings completed its acquisition of Catalent. | Completed; three fill-finish sites in Italy, Belgium and Indiana were set to move to Novo Nordisk |
| In December 2024, WuXi AppTec agreed to sell the U.S. and U.K. operations of WuXi Advanced Therapies, with five facilities, to Altaris. | Agreed; closing was expected in the first half of 2025 |
| In April 2025, Samsung Biologics began operating Plant 5 at Bio Campus II with 180,000 liters of capacity. | Operating; total antibody capacity reached 784,000 liters |
| In September 2025, Thermo Fisher Scientific completed its acquisition of the Sanofi sterile fill-finish site in Ridgefield, New Jersey. | Completed; the site continues to manufacture a portfolio of Sanofi therapies |
Single-use systems and continuous processing lead change
- Single-use bioreactors and process systems cut cleaning and changeover time, which lets one suite run several client products each year.
- Continuous processing links synthesis or purification steps into one flow, which reduces footprint and improves batch consistency.
- Containment suites for potent compounds protect workers handling high-potency active pharmaceutical ingredients and conjugate payloads.
- Digital batch records and process analytics track quality data in real time, which supports faster release and smoother regulatory inspections.
- Modular cleanroom and plant designs shorten construction and qualification time, which helps providers add capacity in phases as client demand becomes clear.
Need a Custom Version of This Report?
Tailor the scope, geography, or segments to your exact requirements.
- Custom geography or segment scope
- Direct access to our analyst team
Integrated providers compete on capacity and quality record
Competition is led by integrated providers that combine process work, drug substance, filling and packaging across global networks. Thermo Fisher Scientific Inc., Lonza Group and Catalent Inc. compete for full-service programs, and each has bought or expanded U.S. sites since 2024. Samsung Biologics Co. Ltd. and Fujifilm Diosynth Biotechnologies focus on very large mammalian capacity for antibodies. WuXi AppTec Inc. offers chemistry and testing services at scale, while Recipharm AB, Aenova Holding GmbH and Jubilant Pharmova Ltd. serve finished dose, sterile and active ingredient clients. Boehringer Ingelheim Group, Pfizer CentreOne and Baxter BioPharma Solutions sell spare capacity from drugmaker networks, which gives clients access to long regulatory records. As a result, buyers often choose partners on inspection history, available capacity and the ability to move a product from first trials to commercial supply.
Companies profiled and their roles in this market
| Company | Type | Role in the market |
|---|---|---|
| Thermo Fisher Scientific Inc. | Integrated | Drug substance, sterile fill-finish and clinical supply, including the Ridgefield site |
| Lonza Group | Integrated | Mammalian, microbial and cell and gene production, including the Vacaville site |
| Catalent Inc. | Integrated | Biologics, gene therapy and oral and sterile dose forms under Novo Holdings ownership |
| Samsung Biologics Co. Ltd. | Biologics specialist | Large-scale antibody production at Songdo, including Plant 5 |
| WuXi AppTec Inc. | Chemistry specialist | Small molecule process chemistry, manufacturing and testing |
| Recipharm AB | Dose form specialist | Oral, sterile and inhalation dose manufacturing |
| Jubilant Pharmova Ltd. | Diversified | Sterile injectables and active ingredient services |
| Boehringer Ingelheim Group | Drugmaker network | Biologics outsourcing from company bioprocess sites |
| Pfizer CentreOne | Drugmaker network | Sterile injectables and active ingredients from Pfizer sites |
| Aenova Holding GmbH | Dose form specialist | Solid, semi-solid, liquid and sterile dose forms in Europe |
| Fujifilm Diosynth Biotechnologies | Biologics specialist | Large-scale cell culture, including the Holly Springs site |
| Baxter BioPharma Solutions | Sterile specialist | Parenteral fill-finish, including potent and cytotoxic products |
Biologics and sterile fill-finish set the growth pace
Credence Research's view is that, in contract development and manufacturing, biologics drug substance and sterile fill-finish will set the pace of growth through 2035, because both need scarce capacity that most sponsors cannot build quickly. The overall market grows at 6.62% a year, supported by steady drug approvals and a widening base of small biotech clients. U.S. onshoring policy favors providers that already own inspected domestic plants. Providers that combine strong quality records with flexible capacity will win the most new programs, while single-site suppliers face pricing pressure.
How Credence Research sized outsourced drug production
The report uses 2025 as the base year and 2026 to 2035 as the forecast period. Market values come from the Credence Research model, which builds outsourced production spending by service type, end user and region. Regional and segment splits are Credence Research estimates informed by FDA approval statistics and announcements, company press releases and securities filings. No primary interviews or surveys were used in preparing this edition of the report.
Outsourced drug production outlook to 2035
By 2035, the contract development and manufacturing market is projected to reach USD 568.63 billion, with growth led by biologics, sterile injectables and early phase services for emerging biotech companies. API manufacturing will remain the largest service type, although finished product work gains from new injectable launches. North America keeps the highest spending, while Asia Pacific adds the most new capacity. Policy on foreign suppliers will shape where sponsors place new programs. As a result, advantage will depend on quality records, regional site networks and available capacity.
Frequently Asked Questions
How big is the global CDMO market?
Which service type leads the CDMO market?
Which region leads outsourced drug production spending?
Which client group buys the most CDMO services?
What recent deals changed CDMO capacity?
How does FDA PreCheck affect outsourced production?
Who are the leading CDMO companies?
What restrains growth in outsourced drug production?
Table of Content
Chapter 1 Market Segmentation
- 1.1 Segmentation Framework
- 1.1.1 Product and Service Classification
- 1.1.2 Application and End-Use Classification
- 1.1.3 Technology and Solution Classification
- 1.1.4 Customer and Distribution Channel Classification
- 1.1.5 Geographic Segmentation
- 1.1.6 Market Segment Definitions and Boundaries
- 1.2 By Service Type
- 1.2.1 API Manufacturing
- 1.2.2 Finished Product Manufacturing
- 1.2.3 Early Phase Development Services
- 1.2.4 Others
- 1.3 By End User
- 1.3.1 Pharmaceutical Companies
- 1.3.2 Biotech Companies
- 1.3.3 Chemical Companies
Chapter 2 Introduction
- 2.1 Report Objectives and Scope
- 2.2 Product Definition and Industry Terminology
- 2.3 Market Inclusions and Exclusions
- 2.4 Research Process
- 2.4.1 Primary Research and Expert Interviews
- 2.4.2 Secondary Research and Source Review
- 2.4.3 Top-Down and Bottom-Up Estimation
- 2.4.4 Data Triangulation and Verification
- 2.5 Market Size Measurement Basis
- 2.5.1 2025: USD 299.44 billion → 2035: USD 568.63 billion
- 2.6 Historical and Forecast Reference Periods
- 2.6.1 Historical Period: 2018-2025
- 2.6.2 Base Year: 2025
- 2.6.3 Forecast Period: 2025-2035
- 2.7 Research Assumptions and Limitations
Chapter 3 Executive Summary
- 3.1 Market Snapshot and Key Findings
- 3.2 Base-Year Market Size, 2025
- 3.3 Forecast Market Size, 2035
- 3.4 Revenue and Volume Growth Outlook
- 3.5 Key Demand and Supply Indicators
- 3.6 Leading Market Segments
- 3.7 Fastest-Growing Market Opportunities
- 3.8 Regional Performance Highlights
- 3.9 Technology and Industry Transformation
- 3.10 Competitive Landscape Summary
- 3.11 Analyst View and Strategic Implications
Chapter 4 Global Contract Development and Manufacturing (CDMO) Market Trends and Developments
- 4.1 Historical Industry Development, 2018-2025
- 4.2 Recent Market Trends and Developments
- 4.3 Demand and Customer Behavior Trends
- 4.4 Technology and Product Innovation
- 4.5 Artificial Intelligence, Automation and Digitalization
- 4.6 Local Manufacturing and Supply Chain Realignment
- 4.7 Industry Partnerships, Mergers and Acquisitions
- 4.8 Sustainability and Circular Economy Developments
- 4.9 Government and Private Sector Investment Trends
- 4.10 Emerging Business Models and Commercialization
- 4.11 Industry Developments and Announcements
Chapter 5 Global Contract Development and Manufacturing (CDMO) Market Production, Supply and Demand Analysis
- 5.1 Demand Trend and Consumption Analysis, 2018-2025
- 5.2 Demand Forecast, 2025-2035
- 5.3 Production and Output Trend, 2018-2025
- 5.4 Production and Output Forecast, 2025-2035
- 5.5 Installed Capacity and Capacity Utilization
- 5.6 Company-Wise Production Plants and Statistics
- 5.6.1 Installed Production Capacity
- 5.6.2 Actual Production
- 5.6.3 Planned Capacity and Expansion Targets
- 5.7 Supply Chain Structure and Procurement Trends
- 5.8 Supply-Demand Gap and Bottlenecks
- 5.9 Import Dependence and Sourcing Structure
- 5.10 Contract Manufacturing and Outsourcing
- 5.11 Regional Supply and Demand Concentration
Chapter 6 Global Contract Development and Manufacturing (CDMO) Market Pricing Analysis
- 6.1 Pricing Structure and Measurement
- 6.2 Historical Pricing Trends, 2018-2025
- 6.3 Pricing Outlook, 2025-2035
- 6.4 Average Selling Price and Unit Economics
- 6.5 Pricing by Product and Market Segment
- 6.6 Geographic Pricing Differences
- 6.7 Key Input, Energy, Labor and Logistics Costs
- 6.8 Contract Pricing and Purchasing Models
- 6.9 Pricing Sensitivity and Competitive Positioning
- 6.10 Price, Margin and Profitability Implications
Chapter 7 Global Contract Development and Manufacturing (CDMO) Market Dynamics
- 7.1 Market Growth Drivers
- 7.1.1 Demand-Side Drivers
- 7.1.2 Technology and Innovation Drivers
- 7.1.3 Infrastructure and Investment Drivers
- 7.1.4 Regulatory and Policy Drivers
- 7.2 Market Restraints
- 7.2.1 Cost and Affordability Constraints
- 7.2.2 Technology and Adoption Barriers
- 7.2.3 Supply Chain and Operational Constraints
- 7.3 Market Challenges
- 7.3.1 Competitive Pressure and Margin Erosion
- 7.3.2 Skills, Infrastructure and Implementation Gaps
- 7.4 Emerging Market Opportunities
- 7.5 Market Dynamics Impact and Time-Horizon Assessment
Chapter 8 Global Contract Development and Manufacturing (CDMO) Value Chain Analysis
- 8.1 Industry Value Chain Overview
- 8.2 Upstream Suppliers and Critical Inputs
- 8.3 Technology and Component Providers
- 8.4 Manufacturing or Service Delivery
- 8.5 Distribution, Channel Partners and Integrators
- 8.6 Downstream Applications and End Users
- 8.7 Value Addition and Profit Pools
- 8.8 Vertical Integration and Outsourcing
- 8.9 Supplier Concentration and Risk
- 8.10 Supply Chain Localization and Resilience
Chapter 9 Global Contract Development and Manufacturing (CDMO) Market Regulations and Policies
- 9.1 Relevant Laws, Standards and Compliance Frameworks
- 9.2 Product, Service, Safety and Quality Requirements
- 9.3 Government Policies, Incentives and Subsidies
- 9.4 Imports, Exports and Trade Barriers
- 9.5 Public Procurement and Local Content Requirements
- 9.6 Environmental and Sustainability Compliance
- 9.7 Upcoming Policy Changes and Market Implications
Chapter 10 Global Contract Development and Manufacturing (CDMO) Market Hotspots and Opportunities
- 10.1 Market Opportunity Mapping and Growth Hotspots
- 10.2 High-Growth Applications and Customer Groups
- 10.3 Underserved Markets and White-Space Opportunities
- 10.4 Emerging Technology and Product Opportunities
- 10.5 New Capacity and Investment Hotspots
- 10.6 Market Entry and Expansion Opportunities
- 10.7 Distribution and Partnership Opportunities
- 10.8 Near-Term and Long-Term Commercial Potential
- 10.9 Opportunity Attractiveness and Execution Risks
Chapter 11 Global Contract Development and Manufacturing (CDMO) Market Outlook, 2025-2035
- 11.1 Market Size and Analysis
- 11.1.1 Revenue (Market Measurement: 2025: USD 299.44 billion → 2035: USD 568.63 billion)
- 11.1.2 Market Volume and Quantity Sold
- 11.1.3 Historical Market Size, 2018-2025
- 11.1.4 Base-Year Market Size, 2025
- 11.2 Market Forecast, 2025-2035
- 11.2.1 Revenue Forecast to 2035
- 11.2.2 Volume Forecast to 2035
- 11.2.3 CAGR and Year-on-Year Growth
- 11.2.4 Incremental Revenue Opportunity
- 11.3 Forecast Assumptions and Scenario Analysis
- 11.3.1 Base-Case Forecast
- 11.3.2 Optimistic and Conservative Scenarios
- 11.3.3 Technology, Pricing and Policy Sensitivities
- 11.4 Market Attractiveness and Growth Outlook
Chapter 12 Global Contract Development and Manufacturing (CDMO) Market Segmentation and Outlook
- 12.1 Segmentation Summary and Market Shares, 2025
- 12.2 Largest and Fastest-Growing Segments
- 12.3 By Service Type - Market Size and Forecast, 2025-2035
- 12.3.1 Segment Definition and Scope
- 12.3.2 Historical Market Size, 2018-2025
- 12.3.3 Revenue Forecast, 2025-2035
- 12.3.4 Volume Forecast, 2025-2035
- 12.3.5 Base-Year Market Share, 2025
- 12.3.6 Segment CAGR and Growth Drivers
- 12.3.7 Subsegment Market Size and Forecast
- 12.3.7.1 API Manufacturing
- 12.3.7.2 Finished Product Manufacturing
- 12.3.7.3 Early Phase Development Services
- 12.3.7.4 Others
- 12.3.8 Subsegment Pricing and Adoption Trends
- 12.3.9 Leading Suppliers and Competition
- 12.3.10 Regional Demand and Opportunities
- 12.4 By End User - Market Size and Forecast, 2025-2035
- 12.4.1 Segment Definition and Scope
- 12.4.2 Historical Market Size, 2018-2025
- 12.4.3 Revenue Forecast, 2025-2035
- 12.4.4 Volume Forecast, 2025-2035
- 12.4.5 Base-Year Market Share, 2025
- 12.4.6 Segment CAGR and Growth Drivers
- 12.4.7 Subsegment Market Size and Forecast
- 12.4.7.1 Pharmaceutical Companies
- 12.4.7.2 Biotech Companies
- 12.4.7.3 Chemical Companies
- 12.4.8 Subsegment Pricing and Adoption Trends
- 12.4.9 Leading Suppliers and Competition
- 12.4.10 Regional Demand and Opportunities
- 12.5 Segment Growth Comparison
- 12.6 Segment Attractiveness and Priority Matrix
Chapter 13 Global Contract Development and Manufacturing (CDMO) End-Use and Application Market Outlook
- 13.1 End-Use Industry and Customer Demand Structure
- 13.2 Leading Applications and Customer Groups
- 13.3 End-Use Market Size, Share and Forecast
- 13.4 Major End-Use Industry Deep Dives
- 13.4.1 Customer Requirements and Use Cases
- 13.4.2 Demand and Replacement Cycles
- 13.4.3 Technical and Regulatory Considerations
- 13.4.4 Purchasing and Procurement Models
- 13.4.5 Leading Vendors and Distribution Channels
- 13.4.6 Forecast and Commercial Opportunities
- 13.5 Emerging Applications and Cross-Segment Demand
- 13.6 End-Use Industry Investment Priorities
Chapter 14 Global Contract Development and Manufacturing (CDMO) Geographic Market Outlook, 2025-2035
- 14.1 Regional Market Size and Share, 2025
- 14.2 Regional Market Forecast, 2025-2035
- 14.3 Regional Pricing, Production and Demand Differences
- 14.4 North America
- 14.4.1 United States
- 14.4.2 Canada
- 14.4.3 Mexico
- 14.5 Europe
- 14.5.1 Germany
- 14.5.2 France
- 14.5.3 Italy
- 14.5.4 United Kingdom
- 14.5.5 Spain
- 14.5.6 Poland
- 14.5.7 Russia
- 14.5.8 Netherlands
- 14.5.9 Belgium
- 14.5.10 Sweden
- 14.5.11 Denmark
- 14.5.12 Norway
- 14.5.13 Rest of Europe
- 14.6 Asia Pacific
- 14.6.1 China
- 14.6.2 India
- 14.6.3 Japan
- 14.6.4 South Korea
- 14.6.5 Thailand
- 14.6.6 Indonesia
- 14.6.7 Vietnam
- 14.6.8 Malaysia
- 14.6.9 Australia
- 14.6.10 Rest of Asia Pacific
- 14.7 Latin America
- 14.7.1 Brazil
- 14.7.2 Argentina
- 14.7.3 Colombia
- 14.7.4 Chile
- 14.7.5 Rest of Latin America
- 14.8 Middle East
- 14.8.1 Saudi Arabia
- 14.8.2 United Arab Emirates
- 14.8.3 Turkey
- 14.8.4 Israel
- 14.8.5 Iran
- 14.8.6 Rest of the Middle East
- 14.9 Africa
- 14.9.1 South Africa
- 14.9.2 Egypt
- 14.9.3 Nigeria
- 14.9.4 Morocco
- 14.9.5 Rest of Africa
- 14.10 Regional Investment, Policy and Supply Chain Differences
- 14.11 Regional Competitive Landscape
- 14.12 Geographic Growth Hotspots
Chapter 15 Global Contract Development and Manufacturing (CDMO) Technology, Innovation and Sustainability Outlook
- 15.1 Technology Landscape and Maturity
- 15.2 Product, Process and Service Innovation
- 15.3 AI, Automation and Digital Tools in the Industry
- 15.4 Technology Adoption and Performance Benchmarking
- 15.5 Innovation Pipeline and R&D Investment
- 15.6 Patent and Intellectual Property Trends
- 15.7 Energy Efficiency and Resource Management
- 15.8 Sustainability, Recycling and Circularity
- 15.9 Technology Roadmap, 2025-2035
- 15.10 Risks of Obsolescence and Technology Substitution
Chapter 16 Global Contract Development and Manufacturing (CDMO) Market Key Strategic Imperatives
- 16.1 Growth and Market Entry Priorities
- 16.2 High-Return Products and Segments
- 16.3 Pricing, Profitability and Cost Optimization
- 16.4 Technology Investment and Product Differentiation
- 16.5 Supply Chain Localization and Resilience
- 16.6 Distribution and Customer Acquisition
- 16.7 Partnership, Acquisition and Capacity Strategy
- 16.8 Regional Expansion Priorities
- 16.9 Short-, Medium- and Long-Term Actions
Chapter 17 Competition Outlook
- 17.1 Industry Competition Characteristics
- 17.2 Market Structure and Concentration
- 17.3 Market Share and Competitive Positioning, 2025
- 17.4 Company-Wise Revenue and Product Benchmarking
- 17.5 Production and Service Capacity Benchmarking
- 17.6 Technology, Pricing and Differentiation
- 17.7 Regional Footprint and Distribution Strength
- 17.8 Mergers, Acquisitions and Strategic Alliances
- 17.9 New Entrants and Competitive Threats
- 17.10 Porter's Five Forces and Industry Attractiveness
- 17.11 Competitive Outlook, 2025-2035
Chapter 18 Company Profiles
- 18.1 Company Coverage and Selection Criteria
- 18.2 Thermo Fisher Scientific Inc.
- 18.2.1 Business Description
- 18.2.2 Company Ownership and Geographic Presence
- 18.2.3 Product and Service Portfolio
- 18.2.4 Manufacturing and Operating Footprint
- 18.2.5 Production Capacity and Expansion Plans
- 18.2.6 Financial Performance and Investment
- 18.2.7 Market Share and Competitive Position
- 18.2.8 Technology and Innovation Capabilities
- 18.2.9 Strategic Alliances or Partnerships
- 18.2.10 Recent Developments
- 18.2.11 Growth Strategy and Outlook
- 18.3 Lonza Group
- 18.4 Catalent Inc.
- 18.5 Samsung Biologics Co. Ltd.
- 18.6 WuXi AppTec Inc.
- 18.7 Recipharm AB
- 18.8 Jubilant Pharmova Ltd.
- 18.9 Boehringer Ingelheim Group
- 18.10 Pfizer CentreOne
- 18.11 Aenova Holding GmbH
- 18.12 Fujifilm Diosynth Biotechnologies
- 18.13 Baxter BioPharma Solutions
- 18.14 Other Relevant Market Participants
Note: Every listed company is profiled on the structure shown under the first company. The company list is preliminary and may change based on research findings, market developments, data availability and client requirements.
Chapter 19 Disclaimer
- 19.1 Research and Forecast Disclaimer
- 19.2 Data Source and Estimation Limitations
Note: The depth of individual sections depends on data availability for this market. Volume, capacity, trade and other unit-based metrics are included where applicable.