Route-based urban fleets anchor regional electric van demand
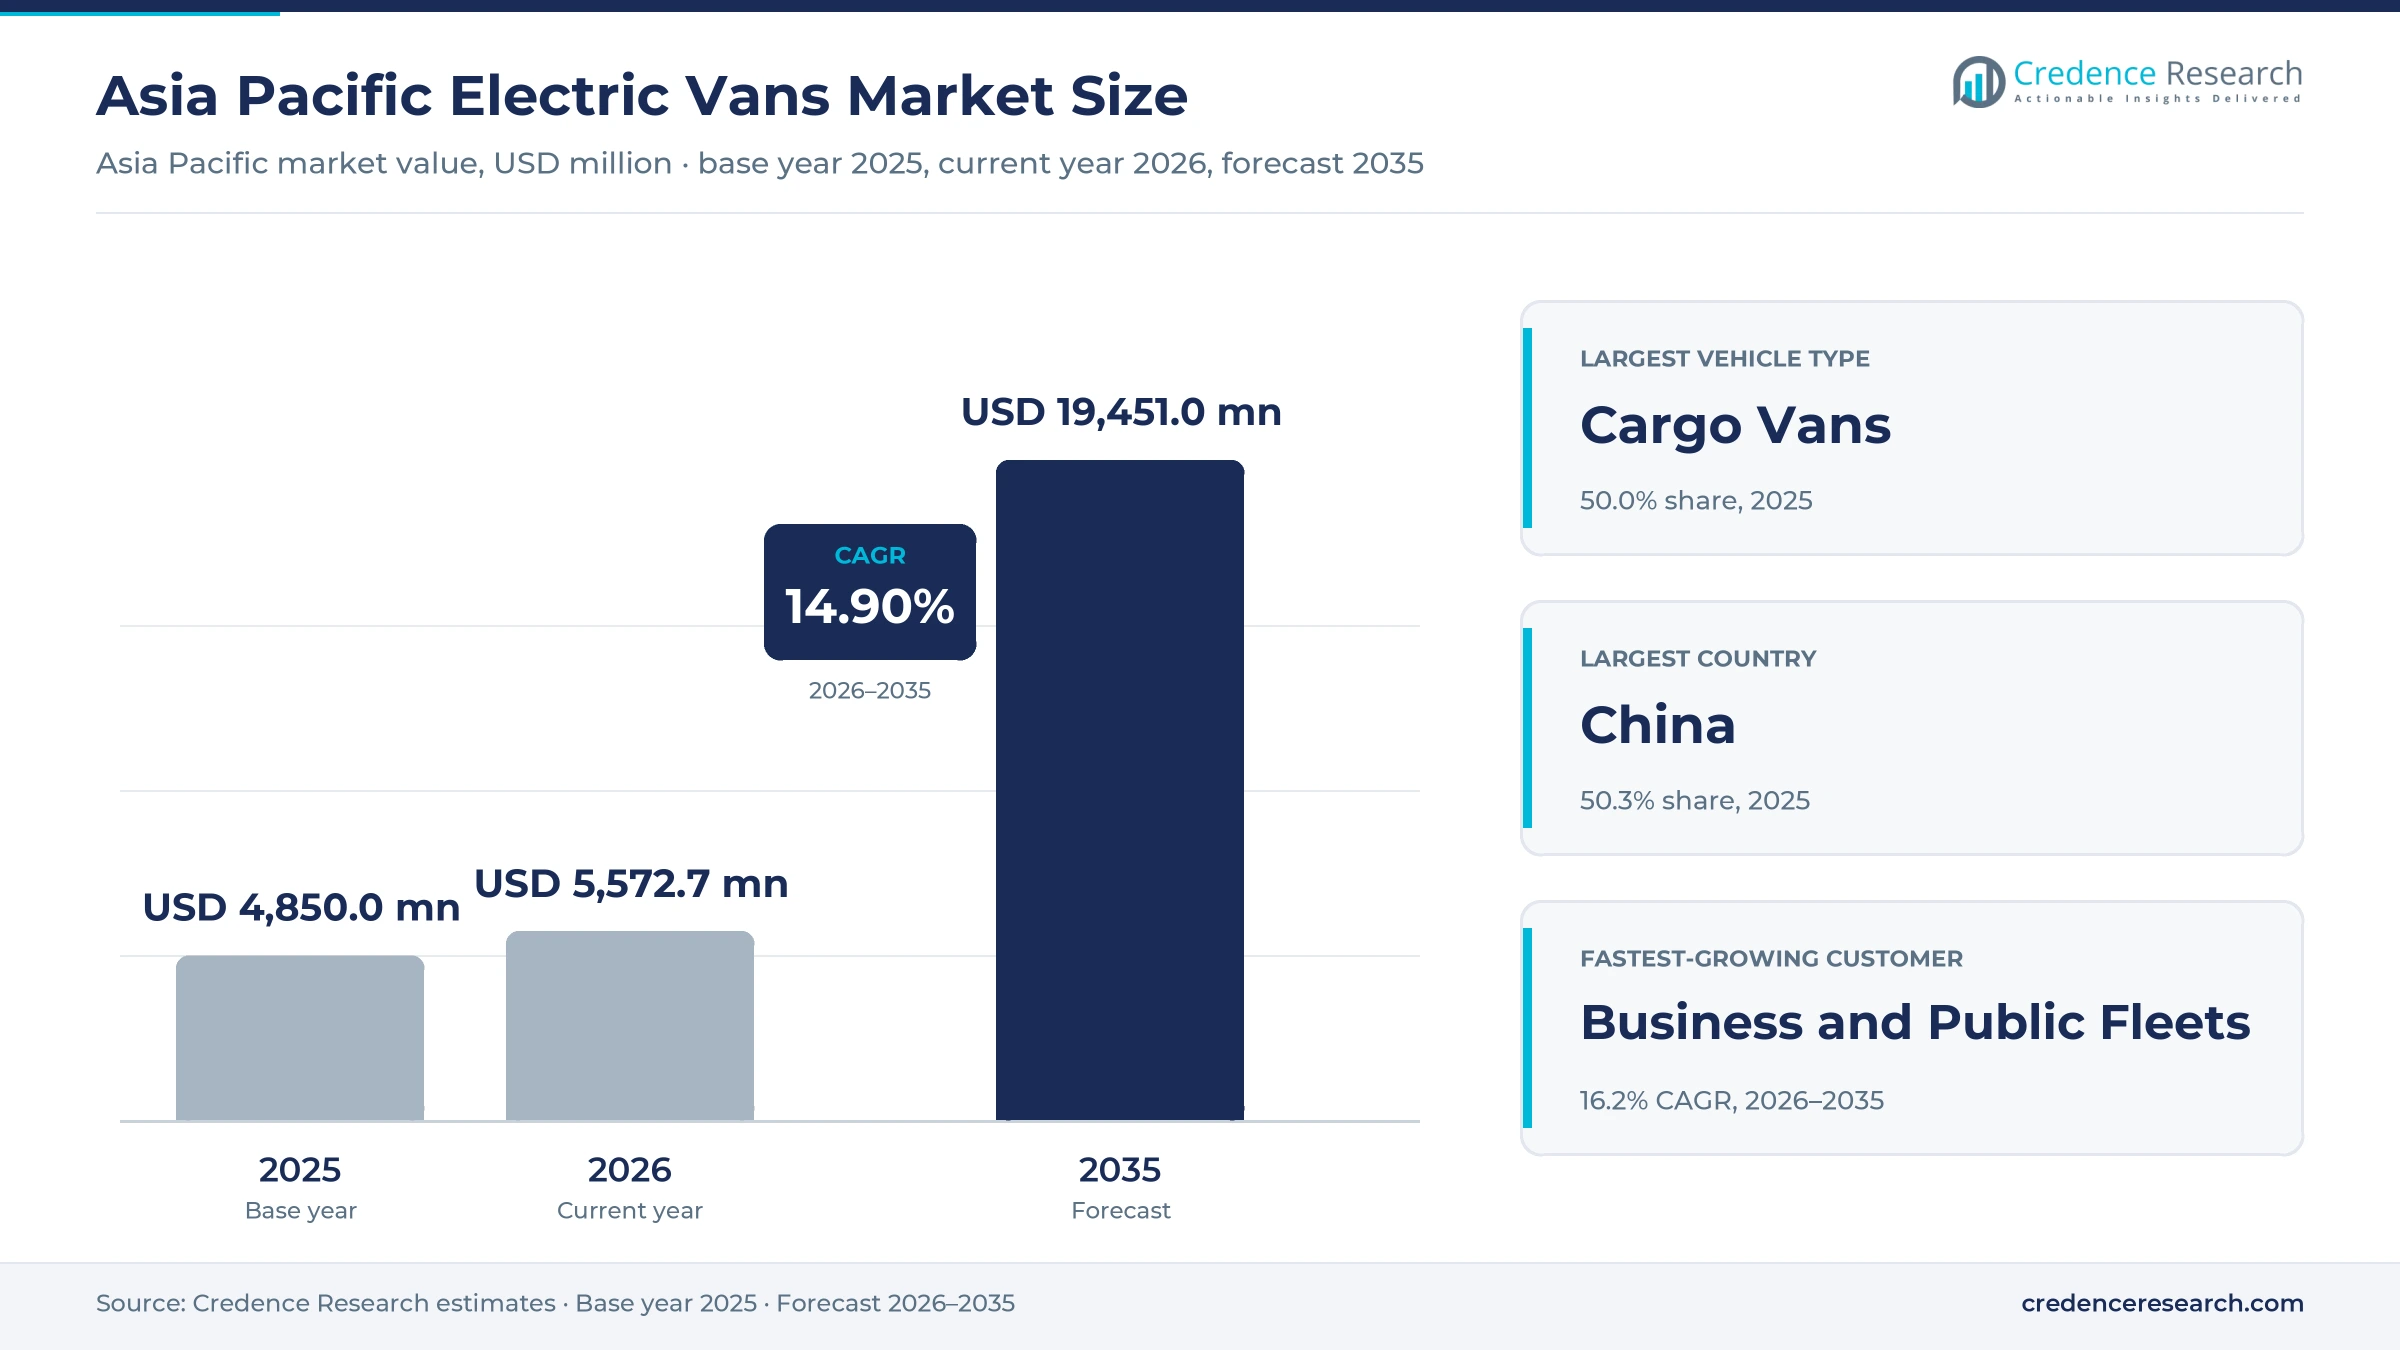
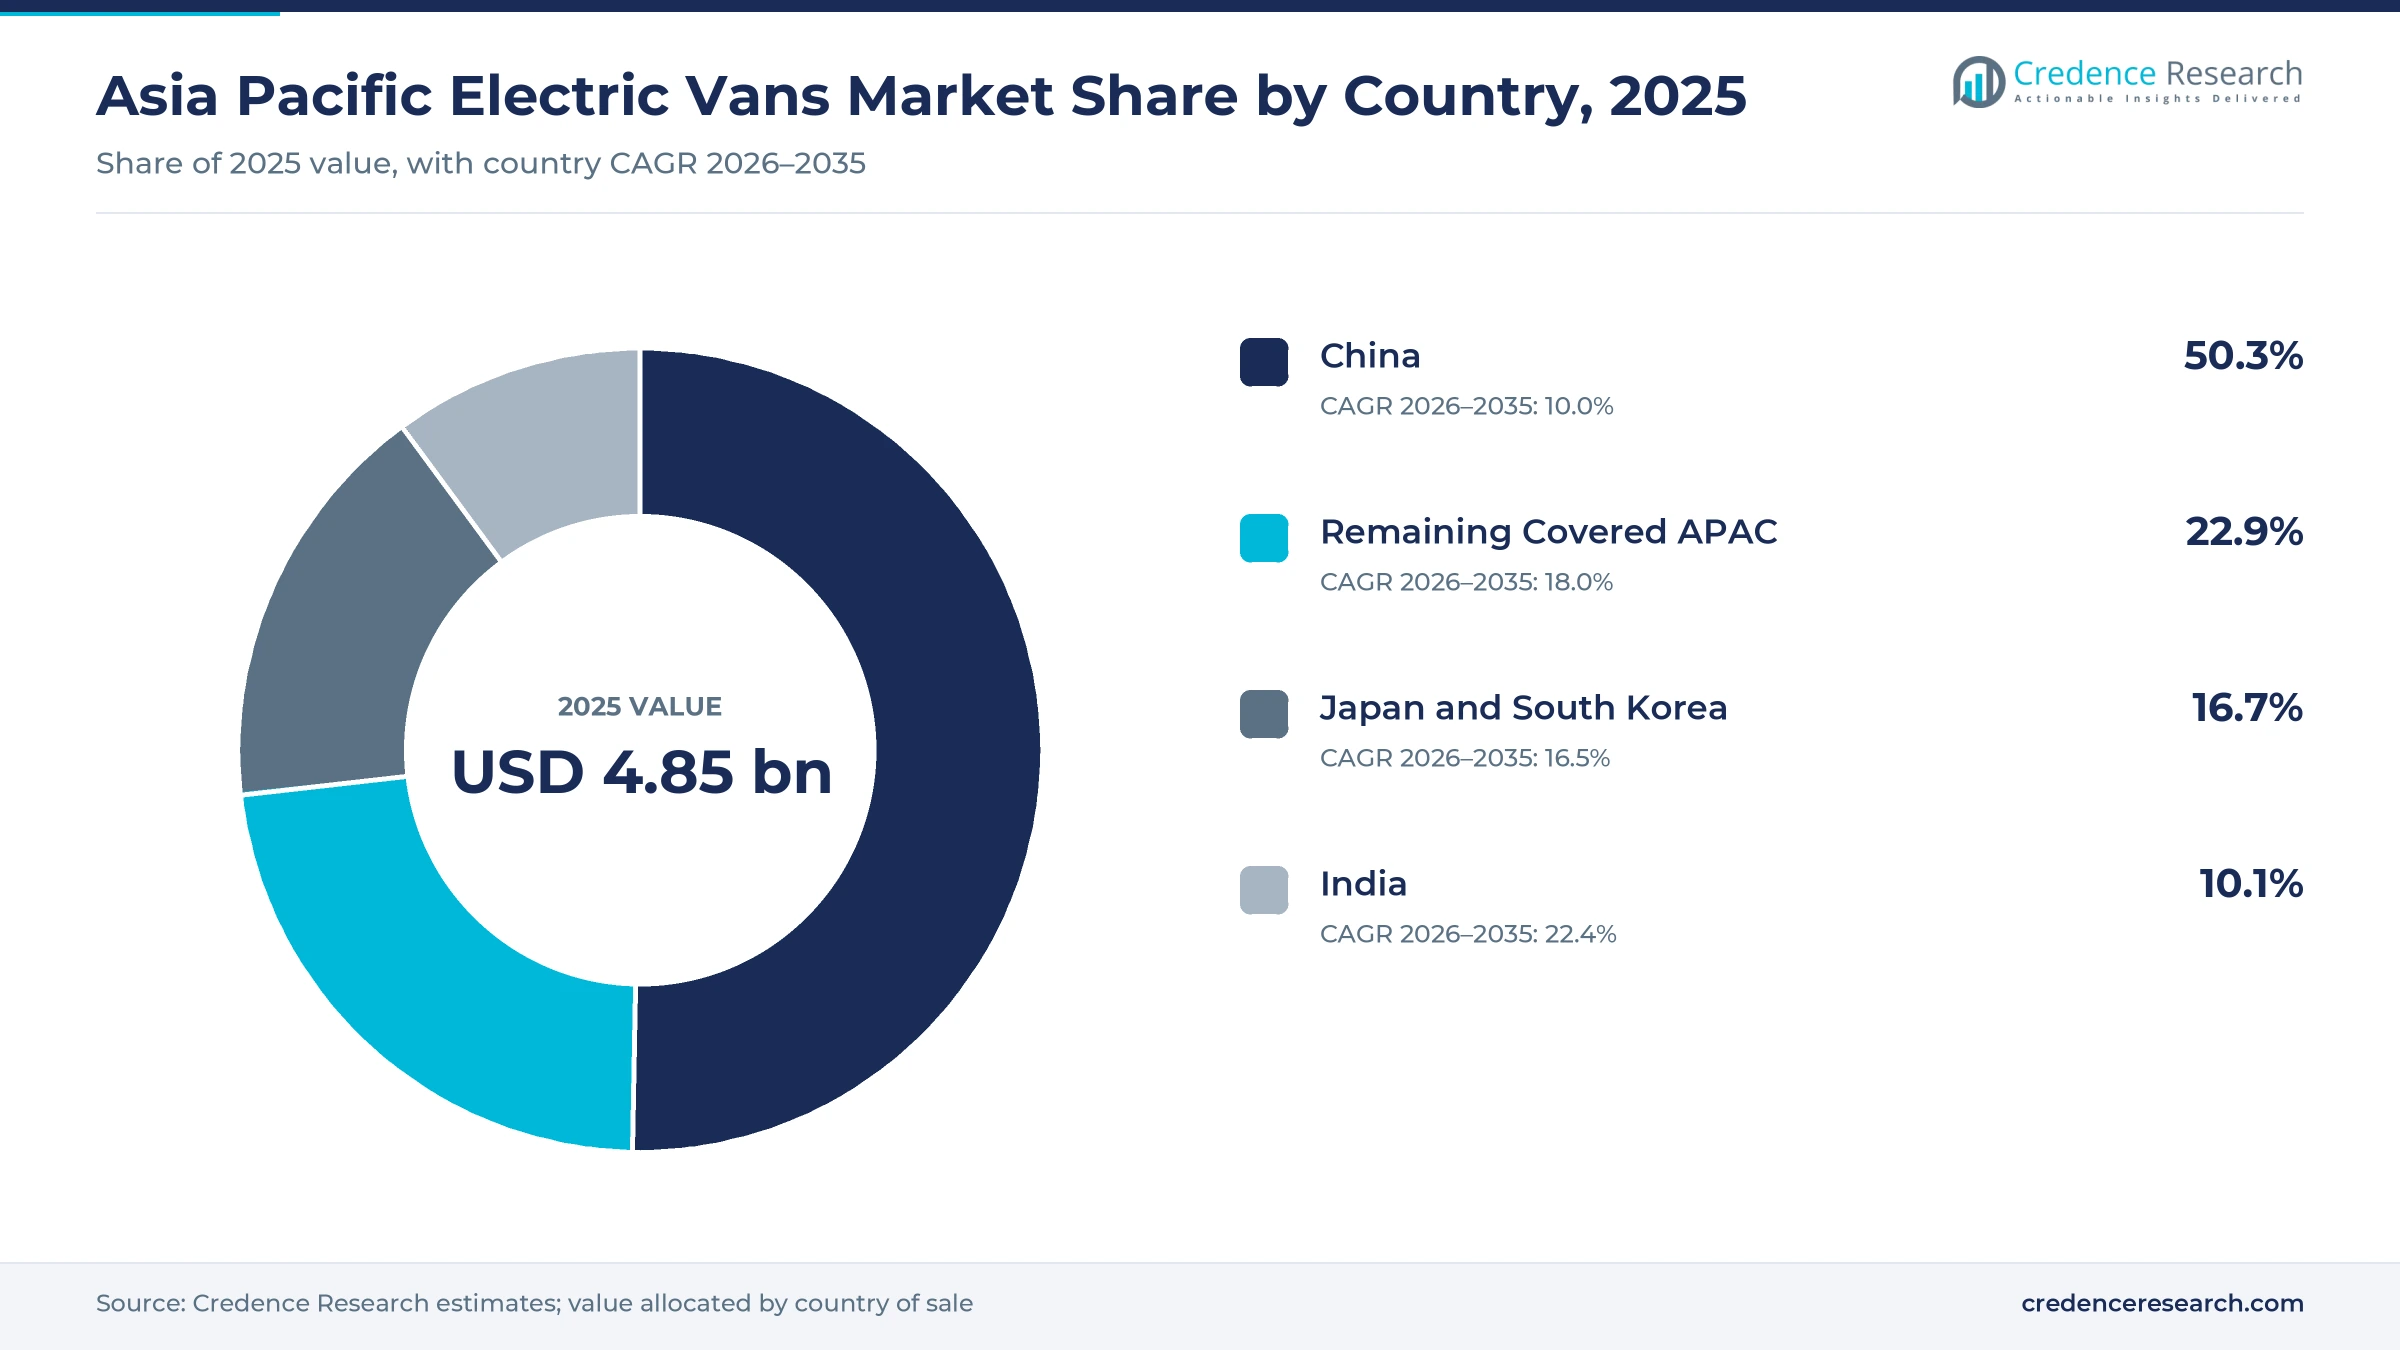
The Asia Pacific electric vans market was valued at USD 4.85 billion in 2025 and is projected to increase from USD 5.57 billion in 2026 to USD 19.45 billion by 2035, registering a CAGR of 14.90% during 2026–2035. Demand comes from parcel carriers, retailers, postal operators, taxi and shuttle fleets, utilities and a smaller group of households that buy cargo, panel and passenger vans for urban routes with predictable daily mileage. China held the largest country share, 50.3% in 2025, because domestic makers sell battery-electric light vans at prices close to diesel models and electric units now take most new light-van sales there. India is the fastest-growing country at 22.4% a year, although it starts from a small base. Supply is also changing, as Kia completed a dedicated purpose-built van plant at Hwaseong in November 2025, and buyers in Korea, Japan and Australia now choose among skateboard-platform models rather than converted diesel vans.
Urban fleets with fixed routes form the core buyer base
The market counts the wholesale value of new battery-electric cargo vans, panel vans and passenger vans sold in China, India, Japan, South Korea and the remaining covered Asia Pacific markets. It includes kei-class microvans in Japan, light vans of 4.5 to 7 meters in China, and midsize purpose-built vans sold in Korea and Australia, bought through direct OEM sales, authorized dealers and importers.
The count excludes pickups, chassis-cab light trucks, three-wheelers, used vans, aftermarket conversions, charging hardware and leasing fees. Value flows from cell makers and platform engineers to van makers and importers, then to logistics fleets, mobility operators, public agencies and households that weigh a higher purchase price against lower energy and maintenance costs.
Asia Pacific Electric Vans Market Insights
- The Asia Pacific electric vans market rises from USD 4.85 billion in 2025 to USD 19.45 billion by 2035, a 14.90% CAGR during 2026–2035, as fleets replace diesel light vans on urban routes.
- China held 50.3% of 2025 value, because electric models took 61.55% of domestic light-van sales from January to September 2025.
- LFP Battery Vans held 76.0% of 2025 value, since LFP cells made up 81.3% of the power batteries installed in China in 2025.
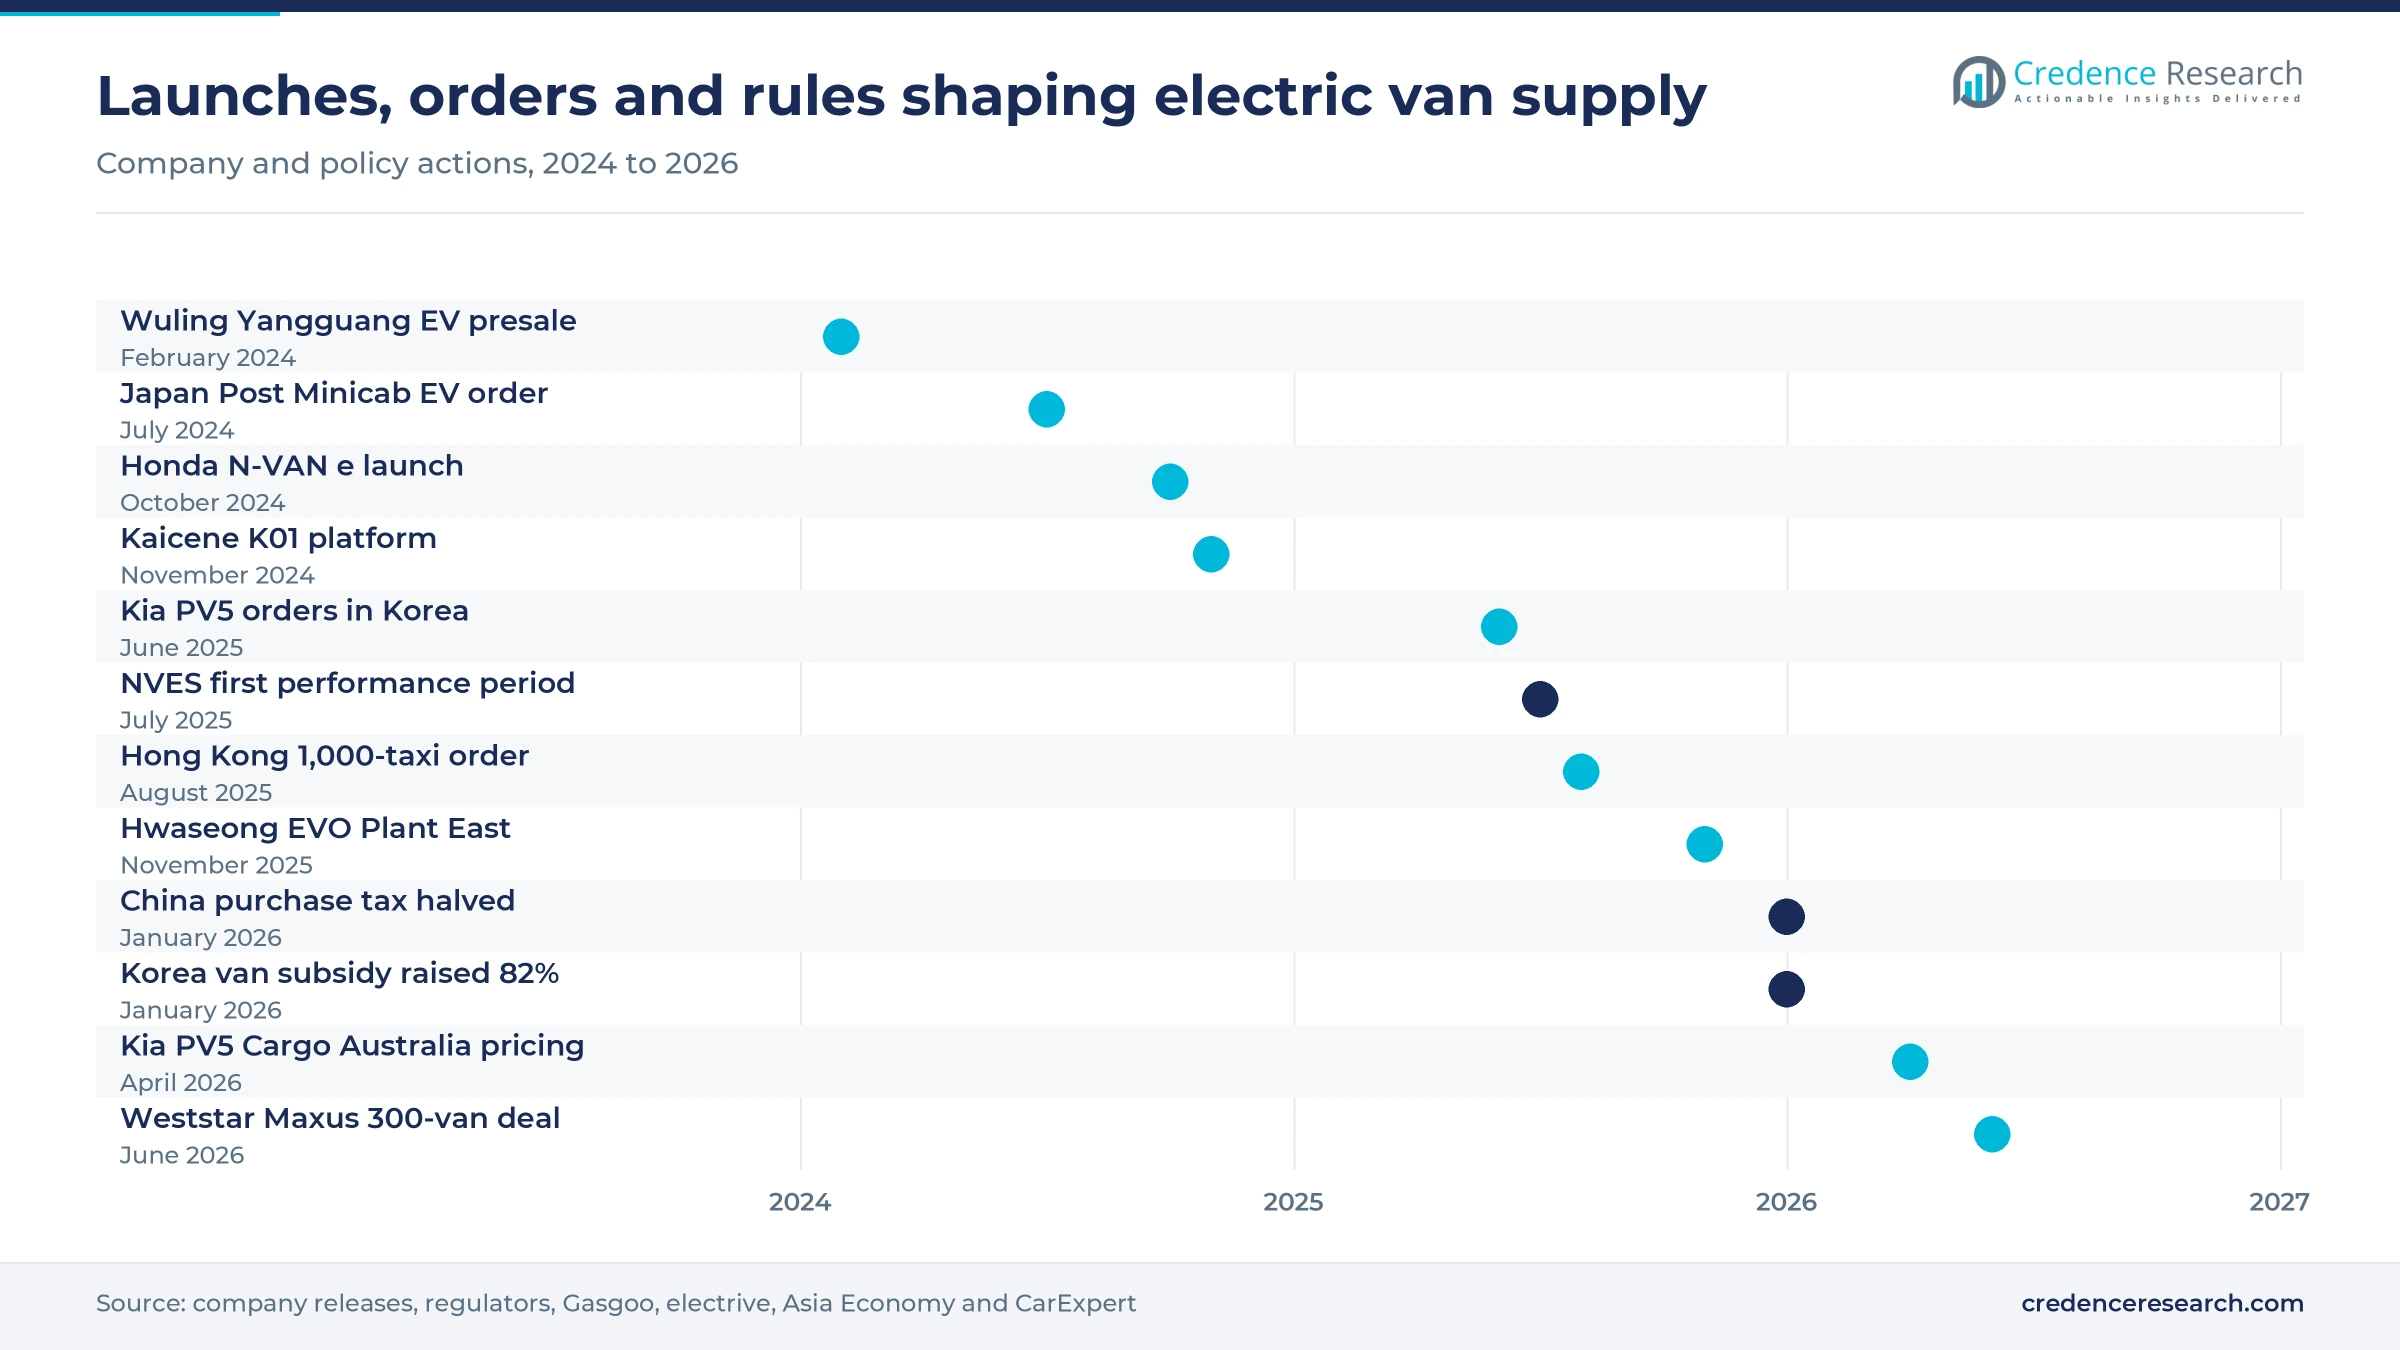
- Kia completed its Hwaseong EVO Plant East in November 2025, the first stage of 250,000 units of annual capacity for purpose-built electric vans.
- Business and public fleet buyers grow fastest by customer at 16.2% a year during 2026–2035, as postal, municipal and leasing fleets place block orders.
Cargo vans and LFP packs lead while passenger bodies rise
Cargo bodies carry volume while passenger vans climb
Based on vehicle type, the market is categorized into cargo vans, panel vans and passenger vans. Cargo Vans led with 50.0% of 2025 value because high-volume Chinese light vans and Japanese kei vans fall in this class, and SAIC-GM-Wuling presold the Yangguang EV in February 2024 with 6.5 cubic meters of load space and two range options, Gasgoo reported. Passenger Vans grow fastest at 16.6% a year as mobility operators move people in van bodies, and Big Bee taxi in Hong Kong ordered 1,000 seven-seat Farizon SV taxis in August 2025, GreenFleet reported. Operators gain lower energy cost per seat, while cargo models compete harder on price.
LFP dominates packs as sodium-ion enters small vans
Based on battery chemistry, the market is categorized into LFP battery vans, nickel-based battery vans and alternative-chemistry battery vans. LFP Battery Vans led with 76.0% of 2025 value because fleet buyers rank cycle life and pack cost above range, and lithium iron phosphate cells made up 81.3% of the 769.7 GWh of power batteries installed in China in 2025, according to the China Automotive Battery Innovation Alliance. Alternative-Chemistry Battery Vans grow fastest at 20.8% a year from a very small base, as CATL presented a 175 Wh/kg sodium-ion pack for small vans and micro trucks in January 2026. CATL gave no production schedule, so adoption timing remains uncertain.
Parcel routes lead while refrigerated bodies grow
Based on usage type, the market is categorized into parcel and general delivery, temperature-controlled delivery, passenger transport and service and utility operations. Parcel and General Delivery led with 56.0% of 2025 value because last-mile parcel networks run fixed daily routes that suit overnight depot charging, and Remote, the Geely brand sold abroad as Farizon, sold 8,011 electric light vans in China in September 2025 alone, according to First Commercial Vehicle Network data. Temperature-Controlled Delivery grows fastest at 17.0% a year as makers add factory refrigerated bodies, and Hyundai launched the updated ST1 Cargo Refrigerated in Korea in July 2025, Asia Economy reported. Food and pharmaceutical shippers gain a sealed body without a diesel reefer engine.
Logistics fleets buy most vans as public fleets accelerate
Based on customer type, the market is categorized into logistics fleet buyers, passenger mobility buyers, business and public fleet buyers, and private household buyers. Logistics Fleet Buyers led with 54.0% of 2025 value because parcel and contract logistics companies buy in batches and drive enough kilometers to recover a higher purchase price, and SAIC Maxus said its domestic NEV sales exceeded 54,000 units in 2025, China Buses reported. Business and Public Fleet Buyers grow fastest at 16.2% a year as postal and municipal fleets place block orders, and Japan Post ordered 3,000 Mitsubishi Minicab EV units in July 2024, electrive reported. Households remain a niche because few makers sell electric vans through retail channels.
| Segment Group | Leading Sub-segment | Share, 2025 | Fastest-growing Sub-segment | CAGR, 2026–2035 |
|---|---|---|---|---|
| By Vehicle Type | Cargo Vans | 50.0% | Passenger Vans | 16.6% |
| By Battery Chemistry | LFP Battery Vans | 76.0% | Alternative-Chemistry Battery Vans | 20.8% |
| By Usage Type | Parcel and General Delivery | 56.0% | Temperature-Controlled Delivery | 17.0% |
| By Customer Type | Logistics Fleet Buyers | 54.0% | Business and Public Fleet Buyers | 16.2% |
Van prices span kei, light and midsize classes
Electric vans are priced per unit, and list prices vary roughly fourfold between Chinese light vans and midsize purpose-built models sold in Korea, Australia and Singapore. Body size, battery capacity, chemistry and import duties move prices most. Subsidies decide the net price in Korea, where incentives and a VAT refund can cut the Hyundai ST1 Cargo price by more than half, while Japanese kei vans depend on fleet discounts. Chinese makers set the floor for regional bids, so importers of Korean and Japanese models compete on platform features, service and residual value rather than on list price.
| Model and market | Typical price or fee | Basis |
|---|---|---|
| Wuling Yangguang EV light van, China | CNY 73,800 to 85,800 presale | Gasgoo, February 2024 |
| Honda N-VAN e kei van, Japan | JPY 2.44 million to 2.92 million incl. tax | Honda, June 2024 |
| Kia PV5 Cargo, South Korea | KRW 42.0 million before subsidies | Asia Economy, June 2025 |
| Hyundai ST1 Cargo, South Korea | KRW 58.74 million list, KRW 25 million to 35 million after incentives | Asia Economy, July 2025 |
| Maxus eDeliver 5, Singapore | SGD 54,000 excluding COE | AutoApp, December 2024 |
| Farizon SV range, Australia | AUD 62,990 to 77,490 before on-road costs | CarExpert, August 2026 |
Request a Free Sample
Fill in your details and we'll send you a free sample report.
- Sample data tables & charts
- Research methodology
Cheaper packs, new platforms and fixed rules lift orders
Battery cost reduction narrows the gap with diesel vans
Cheaper batteries narrow the price gap between electric and diesel vans, which drives fleet adoption faster than private demand because fleet managers judge vehicles on cost per kilometer. Average prices of EV battery packs fell 8% in 2025, packs in China cost 30% less than in North America, and LFP packs were more than 40% cheaper per kWh than NMC packs, according to the International Energy Agency. Kia opened Korean orders for the PV5 Cargo in June 2025 at KRW 42.0 million before subsidies, Asia Economy reported. The International Energy Agency notes that the PV5 costs about 20% less than Hyundai's ST1 Cargo Electric with a similar battery and longer range. Lower pack costs let makers cut prices or add range, and both widen the routes on which an electric van pays back.
Dedicated electric van platforms widen the model choice
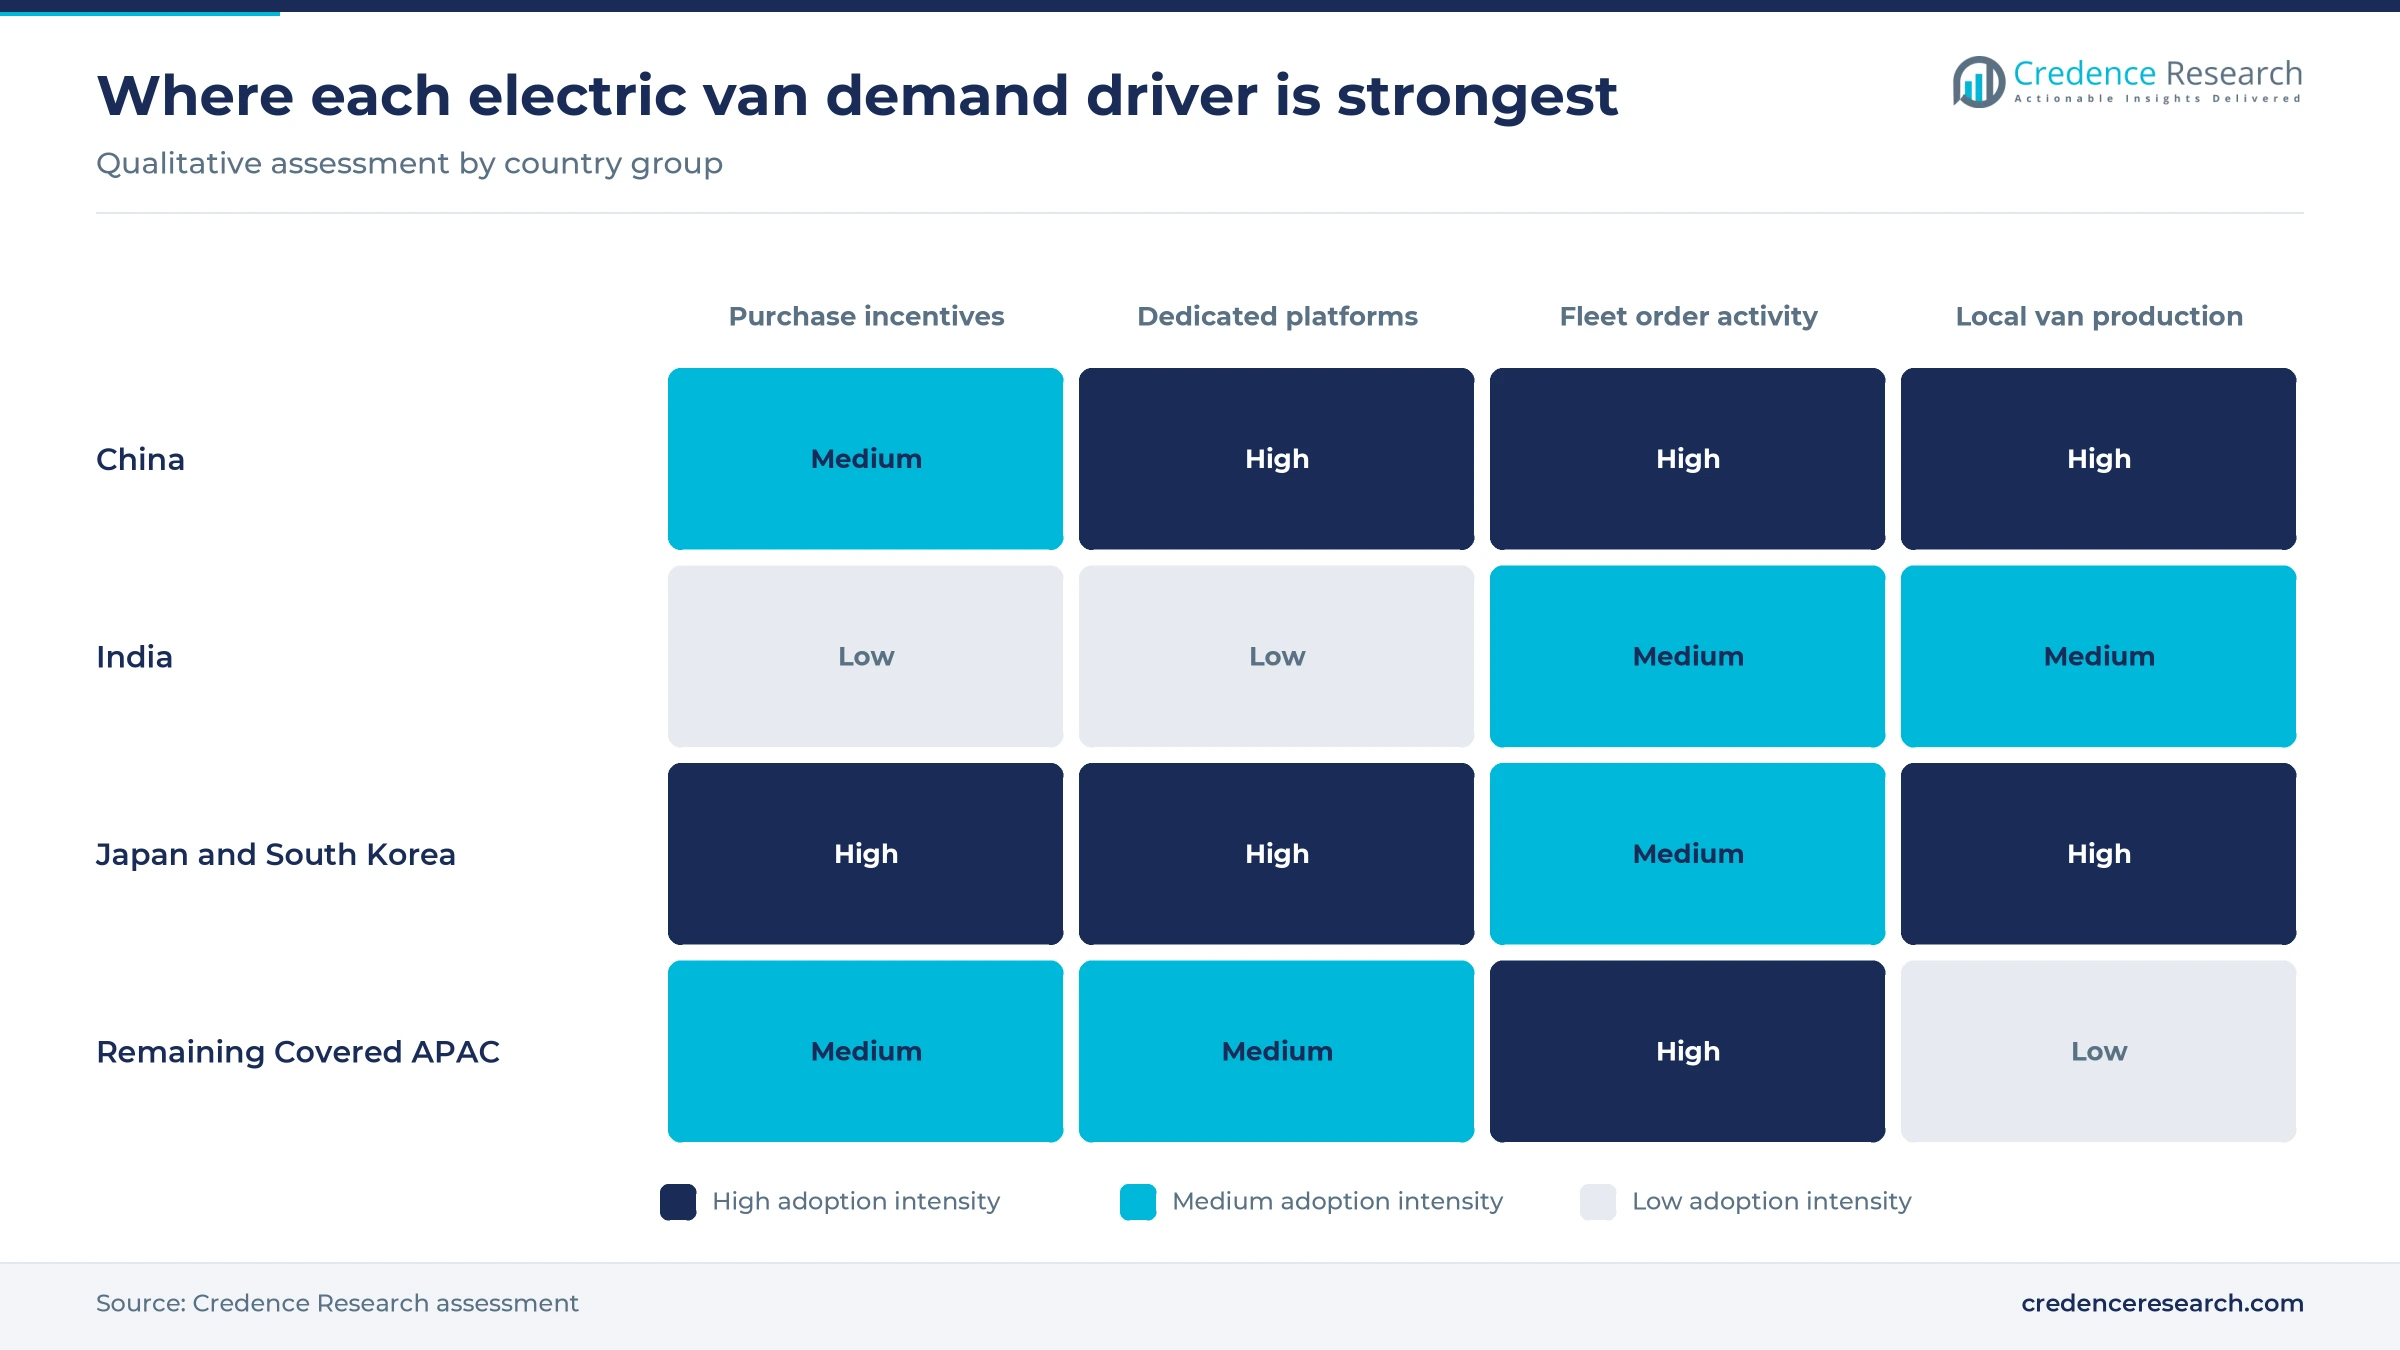
Purpose-built electric platforms give vans a flat floor, low loading height and modular bodies that converted diesel vans cannot match, which widens the set of jobs an electric van can do. Hyundai Motor Group describes its E-GMP.S as a skateboard platform dedicated to purpose-built vehicles, with a full-flat floor and modular roof, door and overhang options, and the Kia PV5 is its first model. Kia completed its Hwaseong EVO Plant East on Nov. 14, 2025, the first stage of a KRW 4 trillion complex with 250,000 units of annual capacity. Farizon builds its SV on a dedicated modular EV platform, Carsales reported in January 2025, and Changan Kaicene unveiled its K01 native new energy commercial platform in November 2024. Fleet demand broadens as buyers gain more body choices from each platform.
Policy visibility lets fleets plan multiyear procurement
Clear incentive schedules let fleet buyers plan replacement cycles years ahead, which favors electric models when subsidies and emission targets are fixed well in advance. China's industry, finance and tax authorities set new energy vehicle purchase tax at a 50% reduction for 2026 and 2027, capped at CNY 15,000 per vehicle, SteelOrbis reported. South Korea raised its 2026 electric van subsidy budget 82% to KRW 279.5 billion, with up to KRW 15 million for small vans, Asia Economy reported in January 2026. Australia's New Vehicle Efficiency Standard set a 2025 target of 210 g CO2/km for light commercial vehicles such as vans, according to the NVES Regulator. Dated rules give importers and fleets a fixed horizon for orders and support steady adoption growth.
Chinese van exports lower prices in import-led markets
Chinese makers now export electric vans at scale, which gives buyers in markets without local van production more models and sharper prices. SAIC Maxus sold 103,000 vehicles overseas in 2025, up 25%, and now reaches more than 100 countries and regions, while its light-van exports ranked first among Chinese brands, China Buses reported. Farizon cut Australian prices of its SV long-range van by up to A$8,500 in August 2026, CarExpert reported, only months after the model arrived. Mitsubishi Motors began producing the Minicab EV in Indonesia in December 2023 for local sale as the L100 EV, electrive reported, which adds non-Chinese regional supply. Price competition boosts demand in import-led markets and favors importers with service networks and fleet finance over those competing on sticker price alone.
Kei-class launches and leasing reshape how vans are bought
Japanese kei van lines shift to battery-electric versions
Japanese makers are shifting their kei commercial vans to battery-electric versions to serve parcel and service fleets that run short daily routes in dense cities. Mitsubishi Motors launched the new Minicab EV in Japan on Dec. 21, 2023, with a 20 kWh battery and 180 km of WLTC range, electrive reported. Nissan announced the Clipper EV, built on the same base, in January 2024 for sale from February, according to a Nissan release. Honda launched the N-VAN e on Oct. 10, 2024, with 245 km of WLTC range and prices from JPY 2.44 million to JPY 2.92 million, according to Honda. Competition in the class now centers on range per yen, which pushes makers toward larger packs while keeping kei dimensions and tax benefits.
Fleets move van purchases to leases and bundled finance
Van buyers are shifting from outright purchase to leasing and bundled finance, because operators want predictable monthly costs while battery values and resale prices remain uncertain. Weststar Maxus and drivEV, the e-mobility business of Yinson GreenTech, signed an agreement in June 2026 to procure 300 units of the Maxus eDeliver 5, and Yinson GreenTech said the partnership will move fleet operators to electric vans through leasing and charging solutions, The Star reported. Honda sells two N-VAN e trims only on lease through its fleet sales division. Business and public fleet buyers grow at 16.2% a year, and leasing lets them add vans without large upfront capital.
Australian and Singapore fleets replace diesel vans on short cycles
Australia and Singapore offer a clear volume opening, because fleets there replace diesel vans on short cycles and importers now offer electric models near diesel prices. Kia priced the PV5 Cargo in Australia at A$55,990 before on-road costs in April 2026, which CarExpert called the most affordable electric van on sale locally. Kia Australia set a 50-unit monthly target and said fleet orders were stronger than anticipated, CarExpert reported in June 2026. Cycle & Carriage launched the Maxus eDeliver 5 in Singapore in December 2024 with a 64 kWh LFP battery, AutoApp reported. Importers that pair vans with depot charging and service contracts can win multiyear fleet tenders.
Korean school and care transport funds higher-subsidy vans
Korean passenger and care transport offers a specialized opening, because local governments fund vans for school runs and vulnerable groups and pay higher subsidies for them. Korea's 2026 program allows up to KRW 30 million per small electric van classified for transporting children to and from school, Asia Economy reported. Local governments road-tested the Hyundai Staria EV in 2025 for transport services for vulnerable groups, ahead of a 2026 launch. Kia lists the PV5 Passenger at KRW 47.09 million before subsidies, with a 71.2 kWh battery and 358 km of range. Makers that offer wheelchair, school and shuttle bodies from one platform can serve these public buyers at scale.
Incentive gaps, tax changes and kei pricing slow uptake
India offers no van-specific purchase incentive
India's main electric vehicle subsidy program does not list vans, which leaves electric van buyers paying the full price gap with diesel. PM E-DRIVE has an outlay of INR 11,900 crore and covers electric two-wheelers, three-wheelers, ambulances, trucks and buses, and it has been extended to March 31, 2028, according to the Press Information Bureau. Importers and domestic makers of electric vans are most exposed, and fleets will keep buying three-wheelers and small cargo carriers until a van incentive appears.
Korean van demand has not recovered its 2023 peak
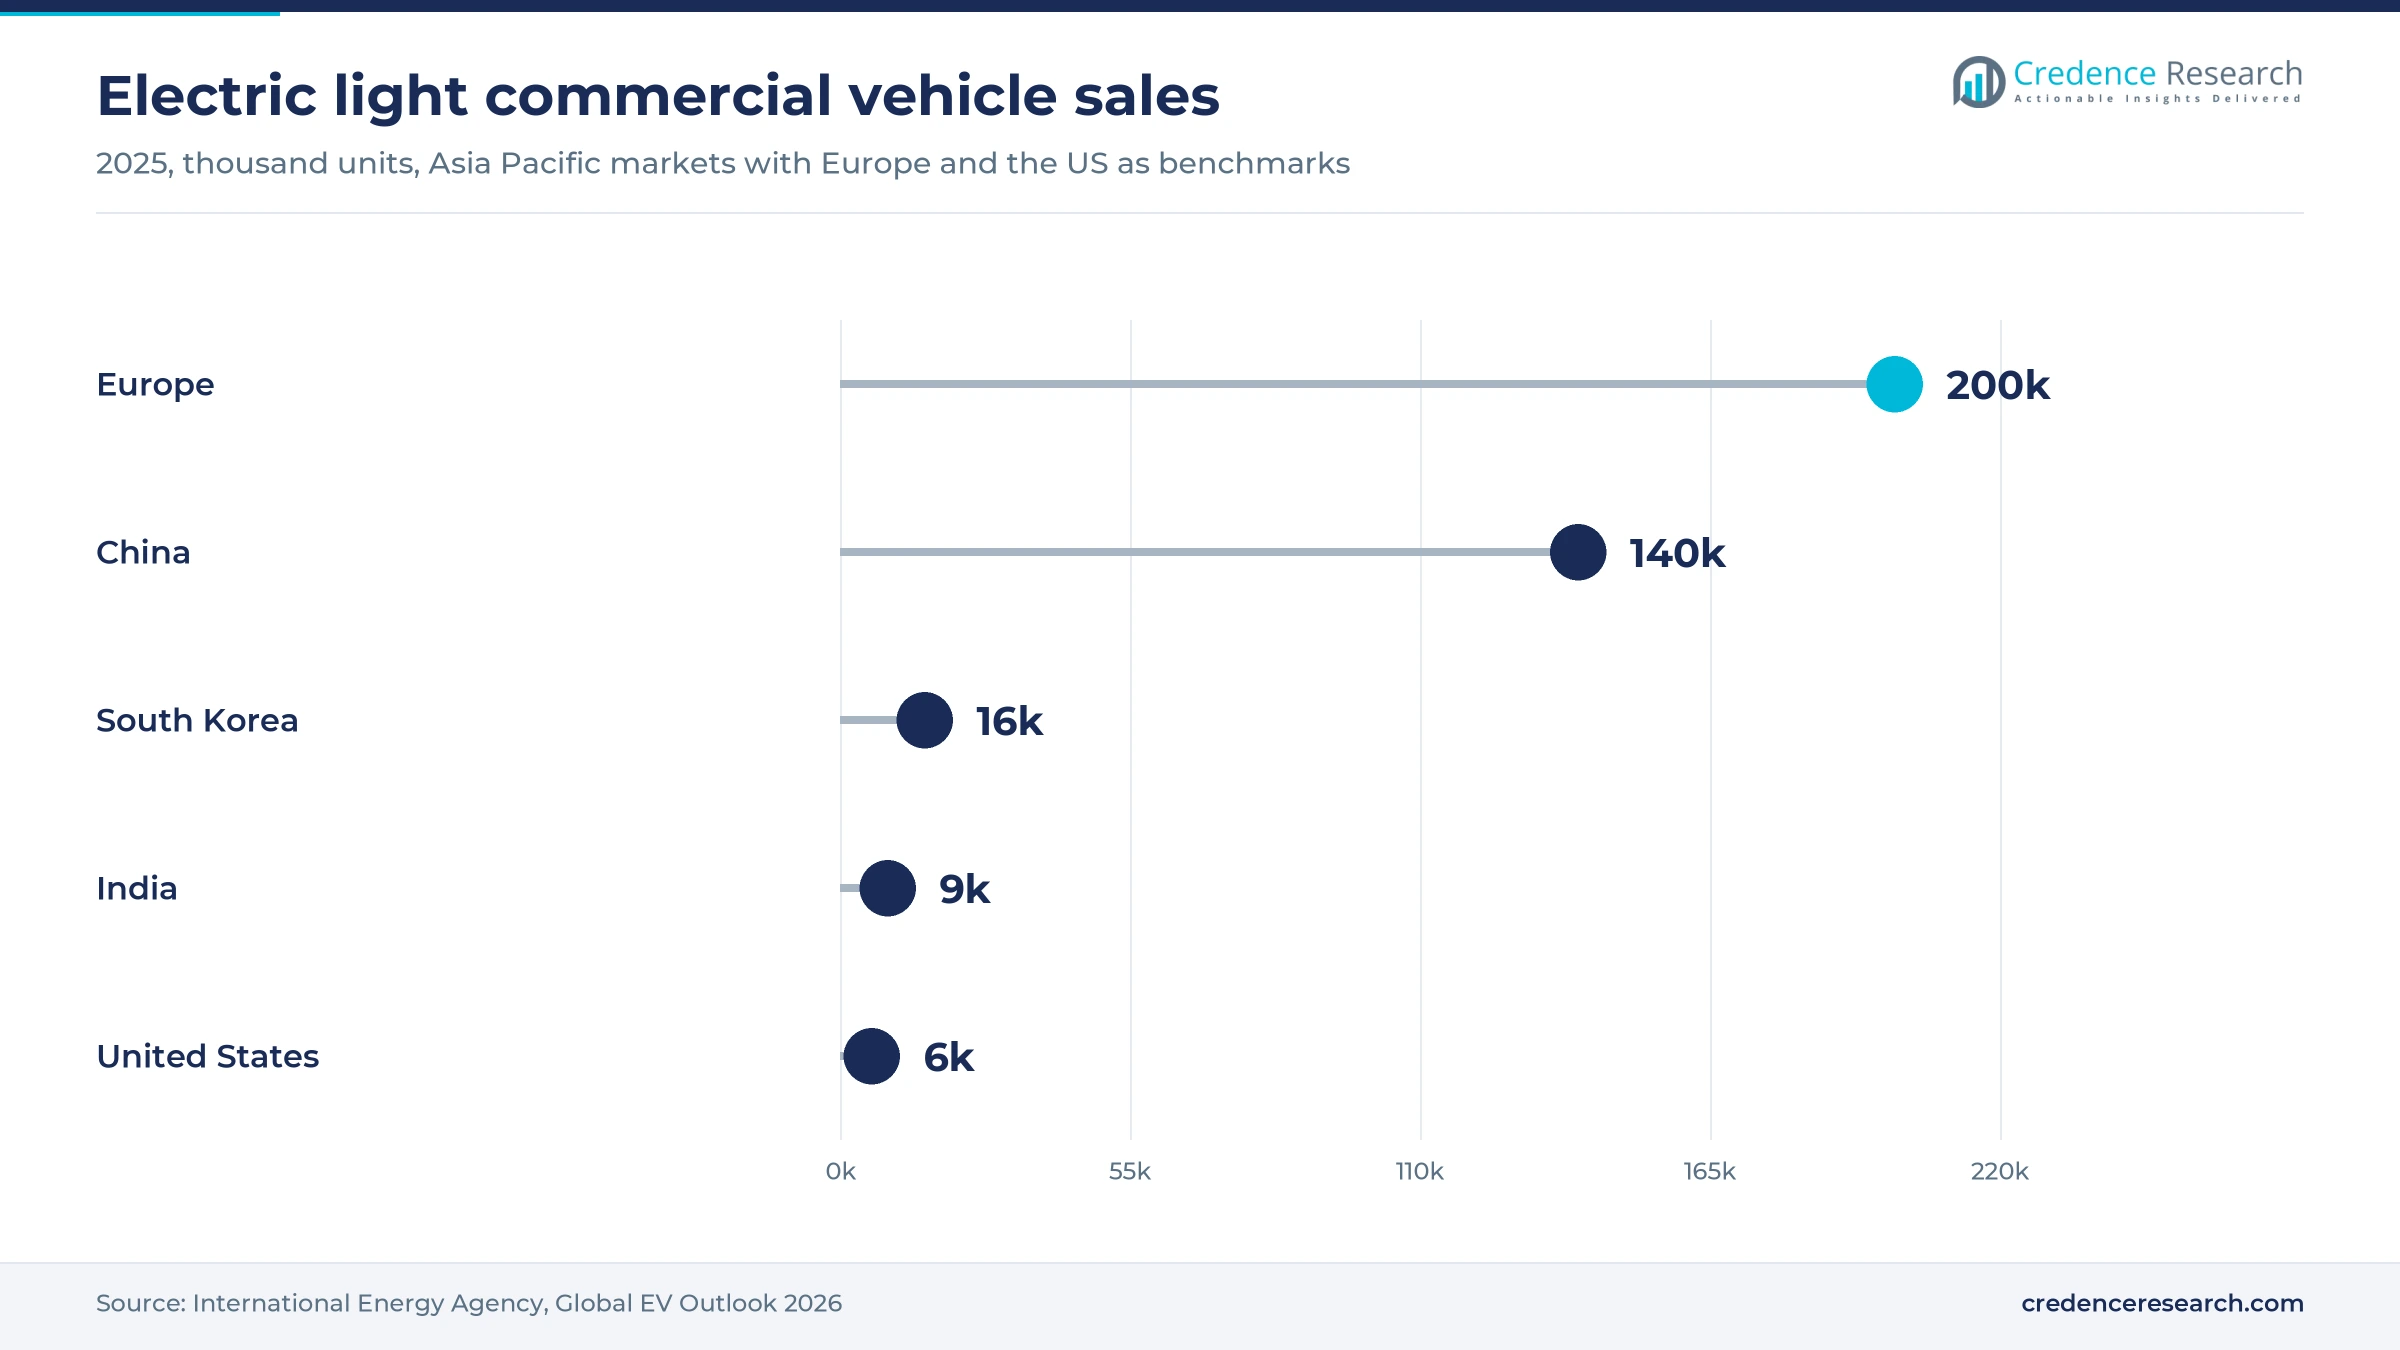
South Korea's electric light commercial market shrank sharply after its 2023 peak, which leaves domestic makers dependent on new models to restore volume. Korean electric LCV sales were about 16,000 in 2025, about 60% below the 2023 peak, and only four electric LCV models were on sale against about 90 electric car models, according to the International Energy Agency. Hyundai and Kia are most exposed, and the higher 2026 subsidy budget only partly offsets the narrow model range.
High kei van prices limit Japanese small-business uptake
Electric kei vans still cost far more than gasoline versions, which slows adoption among small shops and sole traders that buy on price. Daihatsu launched the e-Hijet Cargo and e-Atrai in February 2026 at JPY 3.14 million for the cheapest version, the highest in the kei van segment, Automotive World reported. A Daihatsu sales officer said a price above JPY 3 million is a challenge. Small buyers without fleet discounts or subsidies are most exposed until pack costs fall further.
China is phasing out tax breaks for electric commercial vehicles
China is withdrawing part of its tax support for electric commercial vehicles, which raises running costs for fleets that bought on the strength of exemptions. The Ministry of Finance, State Taxation Administration and industry ministry said in July 2026 that battery-electric commercial vehicles will owe vehicle and vessel tax from Jan. 1, 2027, CnEVPost reported. Combined with the halved purchase tax relief noted above, this squeezes small fleet operators most, although fuel savings still favor electric vans.
China sets volume while India grows from a low start
| Country | Value, 2025 (USD billion) | Share, 2025 | CAGR, 2026–2035 |
|---|---|---|---|
| China | 2.44 | 50.3% | 10.0% |
| Remaining Covered APAC | 1.11 | 22.9% | 18.0% |
| Japan and South Korea | 0.81 | 16.7% | 16.5% |
| India | 0.49 | 10.1% | 22.4% |
China leads on volume after early light-van electrification
China held 50.3% of 2025 value and grows at 10.0% a year, the slowest pace in the region, because electric models already take most new light-van sales. Electric light vans of 4.5 to 7 meters sold 205,100 units from January to September 2025, 61.55% of the class, and reached 70.12% in September, First Commercial Vehicle Network reported from insurance data that exclude exports. The International Energy Agency counts about 140,000 electric light commercial vehicles sold in China in 2025, fewer than the insurance-based van count, so the two series classify vehicles differently and Credence Research relies on insurance data for van volume.
Japan and South Korea add purpose-built and kei models
Japan and South Korea held 16.7% of 2025 value and grow at 16.5% a year, as new dedicated and kei-class models replace a thin earlier lineup. Kia's PV5 reached 53,530 global sales by the end of July 2026, including 15,853 units in the second half of 2025, and overseas markets took about 60% of the total, the Korea Times reported. Because overseas buyers took most PV5 output, domestic Korean volume still rests on a few models, while Japanese demand depends on the kei launches described above.
India grows fastest from a small cargo-led base
India held 10.1% of 2025 value and is the fastest-growing country at 22.4% a year, although public data show a market at an early stage. Electric LCV sales passed 9,000 in 2025, up more than 50%, but held only 1% of LCV sales, and Tata Motors' Ace EV and Mahindra's Zeo took 80% of them, according to International Energy Agency data. Those models are small cargo carriers rather than vans, so the 10.1% share is a Credence Research estimate that runs well ahead of current registration data and assumes Indian makers add panel and passenger vans early in the forecast period.
Remaining markets rely on importers and regional assembly
Remaining Covered APAC held 22.9% of 2025 value and grows at 18.0% a year, as Australia, Hong Kong, Singapore, Malaysia, Thailand and Indonesia add electric vans through importers and regional plants. Farizon named Jameel Motors as its Australian distributor, Carsales reported in January 2025, while Cycle & Carriage sells the Maxus eDeliver 5 in Singapore and Mitsubishi builds kei vans in Indonesia, as noted above. The Hong Kong taxi order adds passenger demand to the delivery fleets that buy most vans in these markets.
Orders, plants and battery launches from 2025 to 2026
| Development | Status and market relevance |
|---|---|
| In June 2025, Kia opened orders in South Korea for the PV5 Passenger and PV5 Cargo electric vans. | Launched; deliveries began in the second half of 2025. |
| In August 2025, Big Bee taxi in Hong Kong ordered 1,000 seven-seat Farizon SV electric taxis. | Order placed; delivery schedule not disclosed. |
| In November 2025, Kia completed the Hwaseong EVO Plant East for purpose-built electric vans. | Completed; the West plant is planned to start in 2027. |
| In January 2026, CATL presented a sodium-ion battery in its Tianxing II series for small vans and micro trucks. | Product launch; mass-production date not disclosed. |
| In June 2026, Weststar Maxus and drivEV agreed to procure 300 units of the Maxus eDeliver 5 in Malaysia. | Procurement agreement; delivery timing not disclosed. |
Skateboard platforms, cell-to-pack and fast-charge vans
- Skateboard van platforms place the battery and drive unit under a flat floor, so one base can carry cargo, passenger and refrigerated bodies.
- Cell-to-pack batteries remove module housings to raise energy density, which Hyundai Motor Group uses on E-GMP.S and Farizon on its SV.
- High-power charging lets the 76.1 kWh Hyundai ST1 charge from 10% to 80% in about 20 minutes at 350 kW, which supports double-shift routes.
- Fleet management software tracks state of charge, routes and maintenance from the depot, which turns van uptime into a managed service.
Need a Custom Version of This Report?
Tailor the scope, geography, or segments to your exact requirements.
- Custom geography or segment scope
- Direct access to our analyst team
Chinese volume makers and Korean platforms set the pace
Competition in Asia Pacific electric vans splits into three groups. Chinese volume makers, led by Farizon, SAIC-GM-Wuling and Changan Kaicene, dominate domestic light vans and compete on price, range and dealer reach, while SAIC Maxus, Foton Motor, Jiangling Motors, Dongfeng Automobile Co. and BYD Auto add vans for fleets and export markets. Kia and Hyundai compete with dedicated purpose-built platforms that support many body types, and Kia prices the PV5 below rival midsize electric vans in Korea and Australia. Mitsubishi Motors and Nissan supply kei-class electric vans in Japan, where Honda and Daihatsu also compete. Buyers compare payload, range, charging speed, service coverage and residual value, and large fleets sign multiyear deals that favor makers with regional parts networks and finance partners.
How concentrated is electric van supply in the region?
Supply is concentrated in China and fragmented across the other covered markets. In China, Remote held 22.57%, Wuling 18.71% and Changan 13.12% of electric light-van sales in September 2025, First Commercial Vehicle Network data show, so three groups took more than half of the class while Jiangling Motors ranked seventh at 5.22%. Japan relies on a few kei makers, and Korea on Hyundai and Kia. Outside these markets, importers and distributors control access, which raises entry barriers for brands without service networks. Margins sit with platform owners and battery suppliers, while dealers in import markets earn mainly on service and finance.
Van makers that fleet buyers shortlist in the region
| Company | Type | Role in the market |
|---|---|---|
| SAIC Maxus (SAIC Motor) | Chinese van maker and exporter | Sells eDeliver and Dana electric vans in China and exports them across the region |
| SAIC-GM-Wuling | Chinese volume van maker | Sells Yangguang EV light vans to Chinese logistics and business fleets |
| Farizon (Geely) | Chinese electric van specialist | Sells SV electric vans and taxis in China, Hong Kong and Australia |
| BYD Auto | Chinese EV and battery maker | Sells T3 compact electric vans and supplies its own LFP battery packs |
| Kia Corporation | Korean PBV maker | Sells PV5 cargo and passenger vans in Korea, Australia and other markets |
| Hyundai Motor Company | Korean van maker | Sells ST1 cargo and refrigerated electric vans in South Korea |
| Changan Kaicene (Changan Automobile) | Chinese commercial van maker | Sells Ruixing electric light vans built for its K01 new energy strategy |
| Foton Motor | Chinese commercial vehicle maker | Sells Toano electric vans with CATL batteries in China and export markets |
| Dongfeng Automobile Co. (DFAC) | Chinese light commercial maker | Sells Yufeng electric light vans to Chinese delivery fleets |
| Jiangling Motors (JMC) | Chinese light commercial maker | Sells electric light vans to Chinese logistics and business fleets |
| Mitsubishi Motors | Japanese kei van maker | Sells Minicab EV kei vans in Japan and builds them in Indonesia |
| Nissan | Japanese van brand | Sells the Clipper EV kei van in Japan, supplied from the Minicab EV base |
Platform scale and fleet finance will decide winners
Credence Research's view is that platform scale and fleet finance, not list price alone, will decide supplier returns in Asia Pacific electric vans through 2035. Electric models already took 61.55% of China's light-van class in the first nine months of 2025, so regional demand growth now depends on Korea, Japan, India and import-led markets where buyers need financing, service and subsidies. Dedicated platforms such as E-GMP.S let makers spread one base across cargo, passenger and refrigerated bodies, which lowers cost per variant. Buyers should secure service and battery warranty terms early, because Chinese price competition will keep resale values uncertain.
Estimates rest on registration, price and policy data
The report uses 2025 as the base year and 2026 to 2035 as the forecast period. Market values come from the Credence Research model, and the country, vehicle type, chemistry, usage and customer splits are Credence Research estimates informed by public data. Sources include government and regulator releases, energy agency statistics, battery price surveys, insurance-registration data reported by trade publishers, company releases and product pages, and regional news publishers. No interviews or surveys were used to build these estimates.
Growth shifts from China toward import-led markets
Credence Research expects Asia Pacific electric van value to reach USD 19.45 billion by 2035 as fleets in Korea, Japan, India and import-led markets follow China in moving delivery and shuttle routes to battery vans. India should keep the fastest pace, while China remains the largest source of value. Passenger and refrigerated bodies will take a larger share as dedicated platforms spread, and LFP packs will stay the default chemistry for fleet use. The main risks are slow incentive action in India and Southeast Asia and price cuts that lower value per van.
Incentive timing and Chinese pricing set the range to 2035
The range depends on how fast India, Southeast Asia and Korea add van incentives and models, and on whether Chinese export pricing keeps pulling list prices down. Faster adoption outside China would lift value, while deep price cuts could raise units but cut value per van. The withdrawal of Chinese tax breaks matters less, because energy savings already favor electric light vans there.
| Scenario | CAGR, 2026–2035 | Value, 2035 | What has to hold |
|---|---|---|---|
| Downside | 11.9% | USD 15.33 billion | Indian and Southeast Asian van incentives stay absent and Chinese price cuts lower value per unit |
| Base | 14.90% | USD 19.45 billion | Announced models, plants and subsidy budgets proceed on schedule across the region |
| Upside | 17.4% | USD 23.61 billion | India adds a van incentive and Korean and Australian fleets switch faster than planned |
Frequently Asked Questions
How big is the Asia Pacific electric vans market?
Which country leads electric van demand in the region?
Which country grows fastest?
Which battery chemistry leads electric vans in Asia Pacific?
How are battery prices affecting electric van demand?
What policies support electric van purchases in the region?
What are the main challenges for suppliers?
Who are the main companies in this market?
Table of Content
Chapter 1 Market Segmentation
- 1.1 Segmentation Framework
- 1.1.1 Product and Service Classification
- 1.1.2 Application and End-Use Classification
- 1.1.3 Technology and Solution Classification
- 1.1.4 Customer and Distribution Channel Classification
- 1.1.5 Geographic Segmentation
- 1.1.6 Market Segment Definitions and Boundaries
- 1.2 By Vehicle Type
- 1.2.1 Cargo Vans
- 1.2.2 Panel Vans
- 1.2.3 Passenger Vans
- 1.3 By Battery Chemistry
- 1.3.1 LFP Battery Vans
- 1.3.2 Nickel-Based Battery Vans
- 1.3.3 Alternative-Chemistry Battery Vans
- 1.4 By Usage Type
- 1.4.1 Parcel and General Delivery
- 1.4.2 Temperature-Controlled Delivery
- 1.4.3 Passenger Transport
- 1.4.4 Service and Utility Operations
- 1.5 By Customer Type
- 1.5.1 Logistics Fleet Buyers
- 1.5.2 Passenger Mobility Buyers
- 1.5.3 Business and Public Fleet Buyers
- 1.5.4 Private Household Buyers
- 1.6 By Country
- 1.6.1 China
- 1.6.2 India
- 1.6.3 Japan and South Korea
- 1.6.4 Remaining Covered APAC
Chapter 2 Introduction
- 2.1 Report Objectives and Scope
- 2.2 Product Definition and Industry Terminology
- 2.3 Market Inclusions and Exclusions
- 2.4 Research Process
- 2.4.1 Primary Research and Expert Interviews
- 2.4.2 Secondary Research and Source Review
- 2.4.3 Top-Down and Bottom-Up Estimation
- 2.4.4 Data Triangulation and Verification
- 2.5 Market Size Measurement Basis
- 2.5.1 2025: USD 4.85 billion → 2035: USD 19.45 billion
- 2.6 Historical and Forecast Reference Periods
- 2.6.1 Historical Period: 2018-2025
- 2.6.2 Base Year: 2025
- 2.6.3 Forecast Period: 2025-2035
- 2.7 Research Assumptions and Limitations
Chapter 3 Executive Summary
- 3.1 Market Snapshot and Key Findings
- 3.2 Base-Year Market Size, 2025
- 3.3 Forecast Market Size, 2035
- 3.4 Revenue and Volume Growth Outlook
- 3.5 Key Demand and Supply Indicators
- 3.6 Leading Market Segments
- 3.7 Fastest-Growing Market Opportunities
- 3.8 Regional Performance Highlights
- 3.9 Technology and Industry Transformation
- 3.10 Competitive Landscape Summary
- 3.11 Analyst View and Strategic Implications
Chapter 4 Asia Pacific Electric Vans Market Trends and Developments
- 4.1 Historical Industry Development, 2018-2025
- 4.2 Recent Market Trends and Developments
- 4.3 Demand and Customer Behavior Trends
- 4.4 Technology and Product Innovation
- 4.5 Artificial Intelligence, Automation and Digitalization
- 4.6 Local Manufacturing and Supply Chain Realignment
- 4.7 Industry Partnerships, Mergers and Acquisitions
- 4.8 Sustainability and Circular Economy Developments
- 4.9 Government and Private Sector Investment Trends
- 4.10 Emerging Business Models and Commercialization
- 4.11 Industry Developments and Announcements
Chapter 5 Asia Pacific Electric Vans Market Production, Supply and Demand Analysis
- 5.1 Demand Trend and Consumption Analysis, 2018-2025
- 5.2 Demand Forecast, 2025-2035
- 5.3 Production and Output Trend, 2018-2025
- 5.4 Production and Output Forecast, 2025-2035
- 5.5 Installed Capacity and Capacity Utilization
- 5.6 Company-Wise Production Plants and Statistics
- 5.6.1 Installed Production Capacity
- 5.6.2 Actual Production
- 5.6.3 Planned Capacity and Expansion Targets
- 5.7 Supply Chain Structure and Procurement Trends
- 5.8 Supply-Demand Gap and Bottlenecks
- 5.9 Import Dependence and Sourcing Structure
- 5.10 Contract Manufacturing and Outsourcing
- 5.11 Regional Supply and Demand Concentration
Chapter 6 Asia Pacific Electric Vans Market Pricing Analysis
- 6.1 Pricing Structure and Measurement
- 6.2 Historical Pricing Trends, 2018-2025
- 6.3 Pricing Outlook, 2025-2035
- 6.4 Average Selling Price and Unit Economics
- 6.5 Pricing by Product and Market Segment
- 6.6 Geographic Pricing Differences
- 6.7 Key Input, Energy, Labor and Logistics Costs
- 6.8 Contract Pricing and Purchasing Models
- 6.9 Pricing Sensitivity and Competitive Positioning
- 6.10 Price, Margin and Profitability Implications
Chapter 7 Asia Pacific Electric Vans Market Dynamics
- 7.1 Market Growth Drivers
- 7.1.1 Demand-Side Drivers
- 7.1.2 Technology and Innovation Drivers
- 7.1.3 Infrastructure and Investment Drivers
- 7.1.4 Regulatory and Policy Drivers
- 7.2 Market Restraints
- 7.2.1 Cost and Affordability Constraints
- 7.2.2 Technology and Adoption Barriers
- 7.2.3 Supply Chain and Operational Constraints
- 7.3 Market Challenges
- 7.3.1 Competitive Pressure and Margin Erosion
- 7.3.2 Skills, Infrastructure and Implementation Gaps
- 7.4 Emerging Market Opportunities
- 7.5 Market Dynamics Impact and Time-Horizon Assessment
Chapter 8 Asia Pacific Electric Vans Value Chain Analysis
- 8.1 Industry Value Chain Overview
- 8.2 Upstream Suppliers and Critical Inputs
- 8.3 Technology and Component Providers
- 8.4 Manufacturing or Service Delivery
- 8.5 Distribution, Channel Partners and Integrators
- 8.6 Downstream Applications and End Users
- 8.7 Value Addition and Profit Pools
- 8.8 Vertical Integration and Outsourcing
- 8.9 Supplier Concentration and Risk
- 8.10 Supply Chain Localization and Resilience
Chapter 9 Asia Pacific Electric Vans Market Regulations and Policies
- 9.1 Relevant Laws, Standards and Compliance Frameworks
- 9.2 Product, Service, Safety and Quality Requirements
- 9.3 Government Policies, Incentives and Subsidies
- 9.4 Imports, Exports and Trade Barriers
- 9.5 Public Procurement and Local Content Requirements
- 9.6 Environmental and Sustainability Compliance
- 9.7 Upcoming Policy Changes and Market Implications
Chapter 10 Asia Pacific Electric Vans Market Hotspots and Opportunities
- 10.1 Market Opportunity Mapping and Growth Hotspots
- 10.2 High-Growth Applications and Customer Groups
- 10.3 Underserved Markets and White-Space Opportunities
- 10.4 Emerging Technology and Product Opportunities
- 10.5 New Capacity and Investment Hotspots
- 10.6 Market Entry and Expansion Opportunities
- 10.7 Distribution and Partnership Opportunities
- 10.8 Near-Term and Long-Term Commercial Potential
- 10.9 Opportunity Attractiveness and Execution Risks
Chapter 11 Asia Pacific Electric Vans Market Outlook, 2025-2035
- 11.1 Market Size and Analysis
- 11.1.1 Revenue (Market Measurement: 2025: USD 4.85 billion → 2035: USD 19.45 billion)
- 11.1.2 Market Volume and Quantity Sold
- 11.1.3 Historical Market Size, 2018-2025
- 11.1.4 Base-Year Market Size, 2025
- 11.2 Market Forecast, 2025-2035
- 11.2.1 Revenue Forecast to 2035
- 11.2.2 Volume Forecast to 2035
- 11.2.3 CAGR and Year-on-Year Growth
- 11.2.4 Incremental Revenue Opportunity
- 11.3 Forecast Assumptions and Scenario Analysis
- 11.3.1 Base-Case Forecast
- 11.3.2 Optimistic and Conservative Scenarios
- 11.3.3 Technology, Pricing and Policy Sensitivities
- 11.4 Market Attractiveness and Growth Outlook
Chapter 12 Asia Pacific Electric Vans Market Segmentation and Outlook
- 12.1 Segmentation Summary and Market Shares, 2025
- 12.2 Largest and Fastest-Growing Segments
- 12.3 By Vehicle Type - Market Size and Forecast, 2025-2035
- 12.3.1 Segment Definition and Scope
- 12.3.2 Historical Market Size, 2018-2025
- 12.3.3 Revenue Forecast, 2025-2035
- 12.3.4 Volume Forecast, 2025-2035
- 12.3.5 Base-Year Market Share, 2025
- 12.3.6 Segment CAGR and Growth Drivers
- 12.3.7 Subsegment Market Size and Forecast
- 12.3.7.1 Cargo Vans
- 12.3.7.2 Panel Vans
- 12.3.7.3 Passenger Vans
- 12.3.8 Subsegment Pricing and Adoption Trends
- 12.3.9 Leading Suppliers and Competition
- 12.3.10 Regional Demand and Opportunities
- 12.4 By Battery Chemistry - Market Size and Forecast, 2025-2035
- 12.4.1 Segment Definition and Scope
- 12.4.2 Historical Market Size, 2018-2025
- 12.4.3 Revenue Forecast, 2025-2035
- 12.4.4 Volume Forecast, 2025-2035
- 12.4.5 Base-Year Market Share, 2025
- 12.4.6 Segment CAGR and Growth Drivers
- 12.4.7 Subsegment Market Size and Forecast
- 12.4.7.1 LFP Battery Vans
- 12.4.7.2 Nickel-Based Battery Vans
- 12.4.7.3 Alternative-Chemistry Battery Vans
- 12.4.8 Subsegment Pricing and Adoption Trends
- 12.4.9 Leading Suppliers and Competition
- 12.4.10 Regional Demand and Opportunities
- 12.5 By Usage Type - Market Size and Forecast, 2025-2035
- 12.5.1 Segment Definition and Scope
- 12.5.2 Historical Market Size, 2018-2025
- 12.5.3 Revenue Forecast, 2025-2035
- 12.5.4 Volume Forecast, 2025-2035
- 12.5.5 Base-Year Market Share, 2025
- 12.5.6 Segment CAGR and Growth Drivers
- 12.5.7 Subsegment Market Size and Forecast
- 12.5.7.1 Parcel and General Delivery
- 12.5.7.2 Temperature-Controlled Delivery
- 12.5.7.3 Passenger Transport
- 12.5.7.4 Service and Utility Operations
- 12.5.8 Subsegment Pricing and Adoption Trends
- 12.5.9 Leading Suppliers and Competition
- 12.5.10 Regional Demand and Opportunities
- 12.6 By Customer Type - Market Size and Forecast, 2025-2035
- 12.6.1 Segment Definition and Scope
- 12.6.2 Historical Market Size, 2018-2025
- 12.6.3 Revenue Forecast, 2025-2035
- 12.6.4 Volume Forecast, 2025-2035
- 12.6.5 Base-Year Market Share, 2025
- 12.6.6 Segment CAGR and Growth Drivers
- 12.6.7 Subsegment Market Size and Forecast
- 12.6.7.1 Logistics Fleet Buyers
- 12.6.7.2 Passenger Mobility Buyers
- 12.6.7.3 Business and Public Fleet Buyers
- 12.6.7.4 Private Household Buyers
- 12.6.8 Subsegment Pricing and Adoption Trends
- 12.6.9 Leading Suppliers and Competition
- 12.6.10 Regional Demand and Opportunities
- 12.7 By Country - Market Size and Forecast, 2025-2035
- 12.7.1 Segment Definition and Scope
- 12.7.2 Historical Market Size, 2018-2025
- 12.7.3 Revenue Forecast, 2025-2035
- 12.7.4 Volume Forecast, 2025-2035
- 12.7.5 Base-Year Market Share, 2025
- 12.7.6 Segment CAGR and Growth Drivers
- 12.7.7 Subsegment Market Size and Forecast
- 12.7.7.1 China
- 12.7.7.2 India
- 12.7.7.3 Japan and South Korea
- 12.7.7.4 Remaining Covered APAC
- 12.7.8 Subsegment Pricing and Adoption Trends
- 12.7.9 Leading Suppliers and Competition
- 12.7.10 Regional Demand and Opportunities
- 12.8 Segment Growth Comparison
- 12.9 Segment Attractiveness and Priority Matrix
Chapter 13 Asia Pacific Electric Vans End-Use and Application Market Outlook
- 13.1 End-Use Industry and Customer Demand Structure
- 13.2 Leading Applications and Customer Groups
- 13.3 End-Use Market Size, Share and Forecast
- 13.4 Major End-Use Industry Deep Dives
- 13.4.1 Customer Requirements and Use Cases
- 13.4.2 Demand and Replacement Cycles
- 13.4.3 Technical and Regulatory Considerations
- 13.4.4 Purchasing and Procurement Models
- 13.4.5 Leading Vendors and Distribution Channels
- 13.4.6 Forecast and Commercial Opportunities
- 13.5 Emerging Applications and Cross-Segment Demand
- 13.6 End-Use Industry Investment Priorities
Chapter 14 Asia Pacific Electric Vans Geographic Market Outlook, 2025-2035
- 14.1 Regional Market Size and Country-Level Shares, 2025
- 14.2 Country Market Size Comparison, 2025
- 14.3 Country Market Forecasts, 2025-2035
- 14.4 Subregional Industrial and Demand Clusters
- 14.5 Intra-Regional Pricing and Cost Differences
- 14.6 Cross-Border Trade and Supply Networks
- 14.7 Regional Supply and Demand Balances
- 14.8 Country Opportunity Comparison and Prioritization
Note: Every listed country is covered on the structure shown under the first country.
Chapter 15 Asia Pacific Electric Vans Technology, Innovation and Sustainability Outlook
- 15.1 Technology Landscape and Maturity
- 15.2 Product, Process and Service Innovation
- 15.3 AI, Automation and Digital Tools in the Industry
- 15.4 Technology Adoption and Performance Benchmarking
- 15.5 Innovation Pipeline and R&D Investment
- 15.6 Patent and Intellectual Property Trends
- 15.7 Energy Efficiency and Resource Management
- 15.8 Sustainability, Recycling and Circularity
- 15.9 Technology Roadmap, 2025-2035
- 15.10 Risks of Obsolescence and Technology Substitution
Chapter 16 Asia Pacific Electric Vans Market Key Strategic Imperatives
- 16.1 Growth and Market Entry Priorities
- 16.2 High-Return Products and Segments
- 16.3 Pricing, Profitability and Cost Optimization
- 16.4 Technology Investment and Product Differentiation
- 16.5 Supply Chain Localization and Resilience
- 16.6 Distribution and Customer Acquisition
- 16.7 Partnership, Acquisition and Capacity Strategy
- 16.8 Regional Expansion Priorities
- 16.9 Short-, Medium- and Long-Term Actions
Chapter 17 Competition Outlook
- 17.1 Industry Competition Characteristics
- 17.2 Market Structure and Concentration
- 17.3 Market Share and Competitive Positioning, 2025
- 17.4 Company-Wise Revenue and Product Benchmarking
- 17.5 Production and Service Capacity Benchmarking
- 17.6 Technology, Pricing and Differentiation
- 17.7 Regional Footprint and Distribution Strength
- 17.8 Mergers, Acquisitions and Strategic Alliances
- 17.9 New Entrants and Competitive Threats
- 17.10 Porter's Five Forces and Industry Attractiveness
- 17.11 Competitive Outlook, 2025-2035
Chapter 18 Company Profiles
- 18.1 Company Coverage and Selection Criteria
- 18.2 SAIC Maxus (SAIC Motor)
- 18.2.1 Business Description
- 18.2.2 Company Ownership and Geographic Presence
- 18.2.3 Product and Service Portfolio
- 18.2.4 Manufacturing and Operating Footprint
- 18.2.5 Production Capacity and Expansion Plans
- 18.2.6 Financial Performance and Investment
- 18.2.7 Market Share and Competitive Position
- 18.2.8 Technology and Innovation Capabilities
- 18.2.9 Strategic Alliances or Partnerships
- 18.2.10 Recent Developments
- 18.2.11 Growth Strategy and Outlook
- 18.3 SAIC-GM-Wuling
- 18.4 Farizon (Geely)
- 18.5 BYD Auto
- 18.6 Kia Corporation
- 18.7 Hyundai Motor Company
- 18.8 Changan Kaicene (Changan Automobile)
- 18.9 Foton Motor
- 18.10 Dongfeng Automobile Co. (DFAC)
- 18.11 Jiangling Motors (JMC)
- 18.12 Mitsubishi Motors
- 18.13 Nissan
- 18.14 Other Relevant Market Participants
Note: Every listed company is profiled on the structure shown under the first company. The company list is preliminary and may change based on research findings, market developments, data availability and client requirements.
Chapter 19 Disclaimer
- 19.1 Research and Forecast Disclaimer
- 19.2 Data Source and Estimation Limitations
Note: The depth of individual sections depends on data availability for this market. Volume, capacity, trade and other unit-based metrics are included where applicable.