Home » Chemicals » Methionine Market

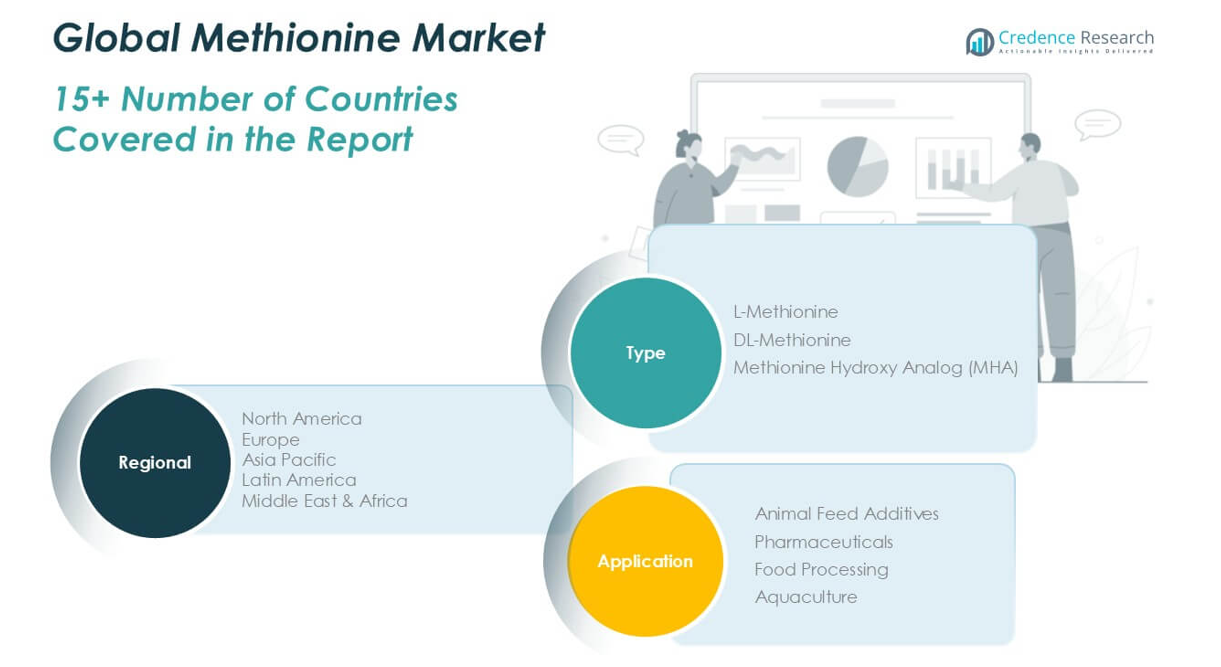
Methionine Market by Type (L- Methionine, DL-Methionine, MHA) by Application (Animal Feed Additives, Pharmaceuticals, Food Processing, Aquaculture): Growth, Future Prospects & Competitive Analysis, 2015 – 2027

Price: $4999

Published: | Report ID: 9498 | Report Format : PDF

Market Insights

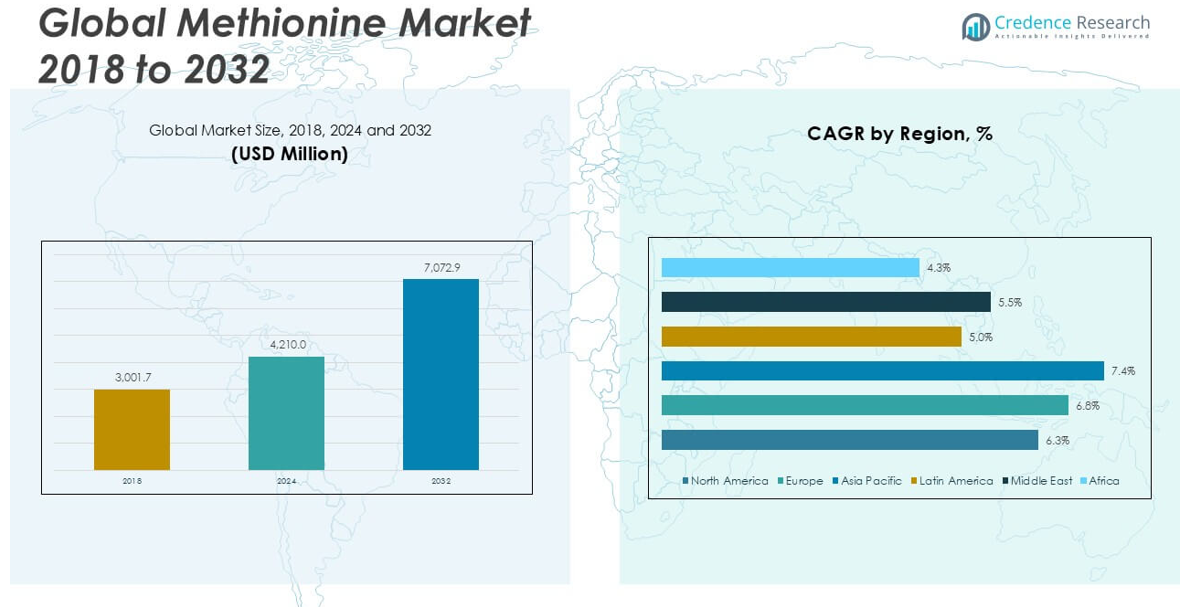
The global Methionine Market is likely to attain a market value of USD 4.80 billion in 2027 from USD 3.36 billion in 2020. The CAGR for this market is expected to reach over 6.1% during the forecast period.

The constant need for leading a healthy lifestyle coupled with the increasing adoption of dietary supplements among the end users, negligent healthcare spending, and the growing geriatric population is expected to boost product demand in the forthcoming years. Additionally, growing concerns about obesity among young people in many countries are anticipated to propel the growth of dietary supplements in the market. Also, the increased intake of sports supplements is cited as accompanying the high demand for methionine in the future. Furthermore, rising demand from the cosmetics and pharmaceutical industries extends future opportunities to the market players of methionine in the forecast period. Credence Research offers holistic information and absolute accuracy in the “Global Methionine Market report.”

Design Element 2

Access crucial information at unmatched prices!

Request your free sample report today & start making informed decisions powered by Credence Research!

Download Free Sample
CTA Design Element 3

Key Market Drivers and Restraints

Factors that greatly impact the market growth of industrial electric vehicles will be covered here. Also, covers factors that may challenge or act as an opportunity for the market will be discussed to identify revenue generation.

Various Factors Driving the Market Growth

The driving factors contributing to the growth of the global market are the spike in meat consumption as a source of protein globally, changing lifestyle patterns, increased usage of frozen meat and allied products, and operations of many meat outlets. Furthermore, the increasing consumption of sports supplements is also seen to complement the demand for methionine over the next few years. In addition, the growth of the middle-class population in many countries has caused increased spending in the healthcare industry, expanding the global methionine market. Considering the factors mentioned above, the global methionine market is about to see a favorable surge in the near future.

Asia-Pacific to lead the global market in geographic regions

On the geographic front, the global market comprises six regions with all key economies pertaining to it. Credence Research provides in-depth insight into prominent regions of the global market. Asia-Pacific topped the market by acquiring a 31.8% share in 2020.

The Powder leads Global Market in terms of Form.

Based on the methionine form, it is further divided into liquid and powdered Forms. Owing to the high stability and impressive shelf life, the powdered format is preferred over and above the liquid ingredients. Specialty carbohydrates, fish-derived collagen, carotenoids, fibers, and numerous plant extracts are present as powders that have application in methionine product production.

Shape Your Report to Specific Countries or Regions & Enjoy 30% Off!

Food processing to dominate the global market in the coming years

Animal Feed Additives, Pharmaceuticals, Food Applications, and Aquaculture are the various market applications. In the past few years, animal feed additives had the highest market share in the application segment in the methionine market, citing reasons such as mounting demand for animal feed supplements, owing to the increasing demand to sustain the metabolism rate in livestock. However, the stringent government regulations it has prohibited bone meal and fish meal usage for developing amino acids, posing a challenge for the animal feed share of the market in the previous years. However, food processing is anticipated to dominate the market in 2020 and is projected to do so in the forecast period.

1.Preface
1.1.Report Description
1.1.1.Purpose of the Report
1.1.2.Target Audience
1.1.3.USP and Key Offerings
1.2.Research Scope
1.3.Research Methodology
1.3.1.Phase I – Secondary Research
1.3.2.Phase II – Primary Research
1.3.3.Phase III – Expert Panel Review
1.3.4.Approach Adopted
1.3.4.1.Top-Down Approach
1.3.4.2.Bottom-Up Approach
1.3.5.Assumptions
1.4.Market Segmentation

2.Executive Summary
2.1.Market Snapshot: Global Methionine Market
3.Market Dynamics
3.1.Introduction
3.1.1. Global Methionine Market Value, 2015-2027, (US$ Bn)
3.2.Market Dynamics
3.2.1.Key Growth Trends
3.2.2.Major Industry Challenges
3.2.3.Key Growth Pockets
3.3.Attractive Investment Proposition, 2020
3.3.1.Type
3.3.2.Application
3.3.3.Form
3.3.4.Geography

4.Market Positioning of Key Players, 2020
4.1.Company market share of key players, 2020
4.2.Top 6 Players
4.3.Top 3 Players
4.4.Major Strategies Adopted by Key Players

5.COVID 19 Impact Analysis
5.1.Global Methionine Market Pre Vs Post COVID 19, 2019 – 2027
5.2.Impact on Import & Export
5.3.Impact on Demand & Supply

6.North America
6.1.North America Methionine Market, by Country, 2015-2027 (US$ Bn)
6.1.1.U.S.
6.1.2.Canada
6.1.3.Mexico
6.2.North America Methionine Market, By Type, 2015-2027 (US$ Bn)
6.2.1.Overview
6.2.2.L- Methionine
6.2.3.DL-Methionine
6.2.4.MHA
6.3.North America Methionine Market, By Form, 2015-2027 (US$ Bn)
6.3.1.Overview
6.3.2.Powder
6.3.3.Liquid
6.4.North America Methionine Market, by Application, 2015-2027 (US$ Bn)
6.4.1.Overview
6.4.2.Animal Feed Additives
6.4.3.Pharmaceuticals
6.4.4.Food Applicationing
6.4.5.Aquaculture

7.Europe
7.1.Europe Methionine Market, by Country, 2015-2027 (US$ Bn)
7.1.1.UK
7.1.2.France
7.1.3.Germany
7.1.4.Italy
7.1.5.Russia
7.1.6.Spain
7.1.7.Belgium
7.1.8.Netherland
7.1.9.Austria
7.1.10.Sweden
7.1.11.Poland
7.1.12.Denmark
7.1.13.Switzerland
7.1.14.Rest of Europe
7.2.Europe Methionine Market, By Type, 2015-2027 (US$ Bn)
7.2.1.Overview
7.2.2.L- Methionine
7.2.3.DL-Methionine
7.2.4.MHA
7.3. Europe Methionine Market, By Form, 2015-2027 (US$ Bn)
7.3.1.Overview
7.3.2.Powder
7.3.3.Liquid
7.4.Europe Methionine Market, by Application, 2015-2027 (US$ Bn)
7.4.1.Overview
7.4.2.Animal Feed Additives
7.4.3.Pharmaceuticals
7.4.4.Food Applicationing
7.4.5.Aquaculture

8.Asia Pacific
8.1.Asia Pacific Methionine Market, by Country, 2015-2027 (US$ Bn)
8.1.1.China
8.1.2.Japan
8.1.3.South Korea
8.1.4.India
8.1.5.Australia
8.1.6.New Zealand
8.1.7.Taiwan
8.1.8.Southeast Asia
8.1.9.Central Asia
8.1.10.Rest of Asia Pacific
8.2.Asia Pacific Methionine Market, By Type, 2015-2027 (US$ Bn)
8.2.1.Overview
8.2.2.L- Methionine
8.2.3.DL-Methionine
8.2.4.MHA
8.3.Asia Pacific Methionine Market, By Form, 2015-2027 (US$ Bn)
8.3.1.Overview
8.3.2.Powder
8.3.3.Liquid
8.4.Asia Pacific Methionine Market, by Application, 2015-2027 (US$ Bn)
8.4.1.Overview
8.4.2.Animal Feed Additives
8.4.3.Pharmaceuticals
8.4.4.Food Applicationing
8.4.5.Aquaculture
9.Latin America
9.1.Latin America Methionine Market, by Country, 2015-2027 (US$ Bn)
9.1.1.Brazil
9.1.2.Argentina
9.1.3.Peru
9.1.4.Chile
9.1.5.Colombia
9.1.6.Rest of Latin America
9.2.Latin America Methionine Market, By Type, 2015-2027 (US$ Bn)
9.2.1.Overview
9.2.2.L- Methionine
9.2.3.DL-Methionine
9.2.4.MHA
9.3.Latin America Methionine Market, By Form, 2015-2027 (US$ Bn)
9.3.1.Overview
9.3.2.Powder
9.3.3.Liquid
9.4.Latin America Methionine Market, by Application, 2015-2027 (US$ Bn)
9.4.1.Overview
9.4.2.Animal Feed Additives
9.4.3.Pharmaceuticals
9.4.4.Food Applicationing
9.4.5.Aquaculture
10.Middle East
10.1.Middle East Methionine Market, by Country, 2015-2027 (US$ Bn)
10.1.1.UAE
10.1.2.KSA
10.1.3.Israel
10.1.4.Turkey
10.1.5.Iran
10.1.6.Rest of Middle East
10.2.Middle East Methionine Market, By Type, 2015-2027 (US$ Bn)
10.2.1.Overview
10.2.2.L- Methionine
10.2.3.DL-Methionine
10.2.4.MHA
10.3.Middle East Methionine Market, By Form, 2015-2027 (US$ Bn)
10.3.1.Overview
10.3.2.Powder
10.3.3.Liquid
10.4.Middle East Methionine Market, by Application, 2015-2027 (US$ Bn)
10.4.1.Overview
10.4.2.Animal Feed Additives
10.4.3.Interior
10.4.4.Food Applicationing
10.4.5.Aquaculture
10.4.6.Others
11.Africa
11.1.Africa Methionine Market, by Country, 2015-2027 (US$ Bn)
11.1.1.South Africa
11.1.2.Egypt
11.1.3.Nigeria
11.1.4.Rest of Africa
11.2.Africa Methionine Market, By Type, 2015-2027 (US$ Bn)
11.2.1.Overview
11.2.2.L- Methionine
11.2.3.DL-Methionine
11.2.4.MHA
11.3.Africa Methionine Market, By Form, 2015-2027 (US$ Bn)
11.3.1.Overview
11.3.2.Powder
11.3.3.Liquid
11.4.Africa Methionine Market, by Application, 2015-2027 (US$ Bn)
11.4.1.Overview
11.4.2.Animal Feed Additives
11.4.3.Pharmaceuticals
11.4.4.Food Applicationing
11.4.5.Aquaculture
12.Global
12.1.Global Methionine Market, By Type, 2015-2027 (US$ Bn)
12.1.1.Overview
12.1.2.L- Methionine
12.1.3.DL-Methionine MHA
12.2.Global Methionine Market, By Form, 2015-2027 (US$ Bn)
12.2.1.Overview
12.2.2.Powder
12.2.3.Liquid
12.3.Global Methionine Market, by Application, 2015-2027 (US$ Bn)
12.3.1.Overview
12.3.2.Animal Feed Additives
12.3.3.Pharmaceuticals
12.3.4.Food Applicationing
12.3.5.Aquaculture
13.Company Profiles
13.1.Evonik Industries AG
13.2.Ajinomoto Group
13.3. BASF SE
13.4.Arkema Group
13.5.Novus International Inc.
13.6.Bluestar Adisseo Company
13.7.METabolic Explorer
10 Royal DSM

List of Figures

FIG. 1Global Methionine Market: Research Methodology
FIG. 2Market Size Estimation – Top Down & Bottom up Approach
FIG. 3Global Methionine Market Segmentation
FIG. 4Global Methionine Market, by Product, 2019 (US$ Bn)
FIG. 5Global Methionine Market, by Application, 2019 (US$ Bn)
FIG. 6Global Methionine Market, by Geography, 2019 (US$ Bn)
FIG. 7Attractive Investment Proposition, by Geography, 2019
FIG. 8Global Market Positioning of Key Methionine Market Manufacturers, 2019
FIG. 9Global Methionine Market Value Contribution, By Type, 2019 & 2027 (Value %)
FIG. 10Global Methionine Market, by Type 1, Value, 2015-2027 (US$ Bn)
FIG. 11Global Methionine Market, by Type 2, Value, 2015-2027 (US$ Bn)
FIG. 12Global Methionine Market, by Type 3, Value, 2015-2027 (US$ Bn)
FIG. 13Global Methionine Market, by Type 4, Value, 2015-2027 (US$ Bn)
FIG. 14Global Methionine Market, by Type 5, Value, 2015-2027 (US$ Bn)
FIG. 15Global Methionine Market, by Others, Value, 2015-2027 (US$ Bn)
FIG. 16Global Methionine Market Value Contribution, By Application, 2019 & 2027 (Value %)
FIG. 17Global Methionine Market, by Application 1, Value, 2015-2027 (US$ Bn)
FIG. 18Global Methionine Market, by Application 2, Value, 2015-2027 (US$ Bn)
FIG. 19Global Methionine Market, by Application 3, Value, 2015-2027 (US$ Bn)
FIG. 20U.S. Methionine Market, 2015-2027 (US$ Bn)
FIG. 21Rest of North America Methionine Market, 2015-2027 (US$ Bn)
FIG. 22U.K. Methionine Market, 2015-2027 (US$ Bn)
FIG. 23Germany Methionine Market, 2015-2027 (US$ Bn)
FIG. 24France Methionine Market, 2015-2027 (US$ Bn)
FIG. 25Rest of Europe Methionine Market, 2015-2027 (US$ Bn)
FIG. 26Japan Methionine Market, 2015-2027 (US$ Bn)
FIG. 27China Methionine Market, 2015-2027 (US$ Bn)
FIG. 28India Methionine Market, 2015-2027 (US$ Bn)
FIG. 29Rest of Asia Pacific Methionine Market, 2015-2027 (US$ Bn)
FIG. 30Middle East & Africa Methionine Market, 2015-2027 (US$ Bn)
Latin America Methionine Market, 2015-2027 (US$ Bn)

List of Tables

TABLE 1Market Snapshot: Global Methionine Market
TABLE 2Global Methionine Market, by Type, 2015-2027 (US$ Bn)
TABLE 3Global Methionine Market, by Type, 2015-2027 (US$ Bn)
TABLE 4Global Methionine Market, by Application, 2015-2027 (US$ Bn)
TABLE 5Global Methionine Market, by Geography, 2015-2027 (US$ Bn)
TABLE 6North America Methionine Market, by Type, 2015-2027 (US$ Bn)
TABLE 7North America Methionine Market, by Type, 2015-2027 (US$ Bn)
TABLE 8North America Methionine Market, by Country, 2015-2027 (US$ Bn)
TABLE 9Europe Methionine Market, by Type, 2015-2027 (US$ Bn)
TABLE 10Europe Methionine Market, by Type, 2015-2027 (US$ Bn)
TABLE 11Europe Methionine Market, by Country/Region, 2015-2027 (US$ Bn)
TABLE 12Asia Pacific Methionine Market, by Type, 2015-2027 (US$ Bn)
TABLE 13Asia Pacific Methionine Market, by Type, 2015-2027 (US$ Bn)
TABLE 14Asia Pacific Methionine Market, by Country/Region, 2015-2027 (US$ Bn)
TABLE 15Latin America Methionine Market, by Type, 2015-2027 (US$ Bn)
TABLE 16Latin America Methionine Market, by Type, 2015-2027 (US$ Bn)
TABLE 17Latin America Methionine Market, by Country/Region, 2015-2027 (US$ Bn)
TABLE 18Middle East Methionine Market, by Type, 2015-2027 (US$ Bn)
TABLE 19Middle East Methionine Market, by Type, 2015-2027 (US$ Bn)
TABLE 20Middle East Methionine Market, by Country/Region, 2015-2027 (US$ Bn)
TABLE 21Africa Methionine Market, by Type, 2015-2027 (US$ Bn)
TABLE 22Africa Methionine Market, by Type, 2015-2027 (US$ Bn)
TABLE 23Africa Methionine Market, by Country/Region, 2015-2027 (US$ Bn)
TABLE 24Company 01: Company Snapshot (Company Overview; Product Portfolio; Financial Information; Key Developments)
TABLE 25Company 2: Company Snapshot (Company Overview; Product Portfolio; Financial Information; Key Developments)
TABLE 26 Company 3: Company Snapshot (Company Overview; Product Portfolio; Financial Information; Key Developments)
TABLE 27Company 4.: Company Snapshot (Company Overview; Product Portfolio; Financial Information; Key Developments)
TABLE 28Company 5: Company Snapshot (Company Overview; Product Portfolio; Financial Information; Key Developments)
TABLE 29 Company 6: Company Snapshot (Company Overview; Product Portfolio; Financial Information; Key Developments
TABLE 30Company 7: Company Snapshot (Company Overview; Product Portfolio; Financial Information; Key Developments
TABLE 31Company 8: Company Snapshot (Company Overview; Product Portfolio; Financial Information; Key Developments
TABLE 32Company 9: Company Snapshot (Company Overview; Product Portfolio; Financial Information; Key Developments
TABLE 33Company 10: Company Snapshot (Company Overview; Product Portfolio; Financial Information; Key Developments
TABLE 34Company 11: Company Snapshot (Company Overview; Product Portfolio; Financial Information; Key Developments
TABLE 35Company 12: Company Snapshot (Company Overview; Product Portfolio; Financial Information; Key Developments
TABLE 36Company 13: Company Snapshot (Company Overview; Product Portfolio; Financial Information; Key Developments

Frequently Asked Questions

What is the size of Methionine Market?

The market for Methionine is expected to reach US$ 6.56 Bn in 2028.

What is the Methionine Market CAGR?

The Methionine market is expected to see significant CAGR growth over the coming years, at 15.0%.

What is the Forecast period considered for Methionine Market?

The report is forecasted from 2019-2027.

What is the base year considered for Methionine Market?

The base year of this report is 2021.

Who are the major players in this market?

Capgemini S.A., EMC Corporation, Hitachi, Ltd., Hewlett-Packard, IBM Corporation, Newgen Software, Inc., Cisco Systems, Inc., SAP SE, SAS Institute, Tata Consultancy Services Ltd. are some of the major players in the global market.

South Africa Graphene Market

Published:
Report ID: 36617

Specialty Nitrile Butadiene Rubber Market

Published:
Report ID: 36614

Roofing Chemicals Market

Published:
Report ID: 36599

Radiation Curable Coatings Market

Published:
Report ID: 36596

1,4 Butanediol Market

Published:
Report ID: 36581

Palm Kernel Fatty Acids Market

Published:
Report ID: 36574

Crop Protection Chemicals Market

Published:
Report ID: 36441

Cosmetic Ingredients Market

Published:
Report ID: 3703

Hydrocolloids Market

Published:
Report ID: 36265

Ion Exchange Resins Market

Published:
Report ID: 36220

Herbal Extract Market

Published:
Report ID: 36211

Fiber Reinforced Polymer (FRP) Composites Market

Published:
Report ID: 36197

Purchase Options

$2999
Delivery Format: Excel.
$4999
Designed for the individual purchaser.
$6999
Users located at a single corporate site or regional office.
$7999
Allowed for unlimited sharing globally within one company.
Smallform of Sample request

Have a question?

User Profile

Don’t settle for less – trust Mitul to help you find the best solution.

Report delivery within 24 to 48 hours

– Other Info –

What people say?-

User Review

I am very impressed with the information in this report. The author clearly did their research when they came up with this product and it has already given me a lot of ideas.

Jana Schmidt
CEDAR CX Technologies

– Connect with us –

Phone

+91 6232 49 3207


support

24/7 Research Support


sales@credenceresearch.com

– Research Methodology –

Going beyond the basics: advanced techniques in research methodology

– Trusted By –

Pepshi, LG, Nestle
Motorola, Honeywell, Johnson and johnson
LG Chem, SIEMENS, Pfizer
Unilever, Samsonite, QIAGEN