| REPORT ATTRIBUTE | DETAILS |
|---|---|
| Historical Period | 2019-2022 |
| Base Year | 2023 |
| Forecast Period | 2024-2032 |
| Atomic Absorption Spectrometer (AAS) Market Size 2024 | USD 6299 Million |
| Atomic Absorption Spectrometer (AAS) Market, CAGR | 6.4% |
| Atomic Absorption Spectrometer (AAS) Market Size 2032 | USD 10346.76 Million |
Market Overview
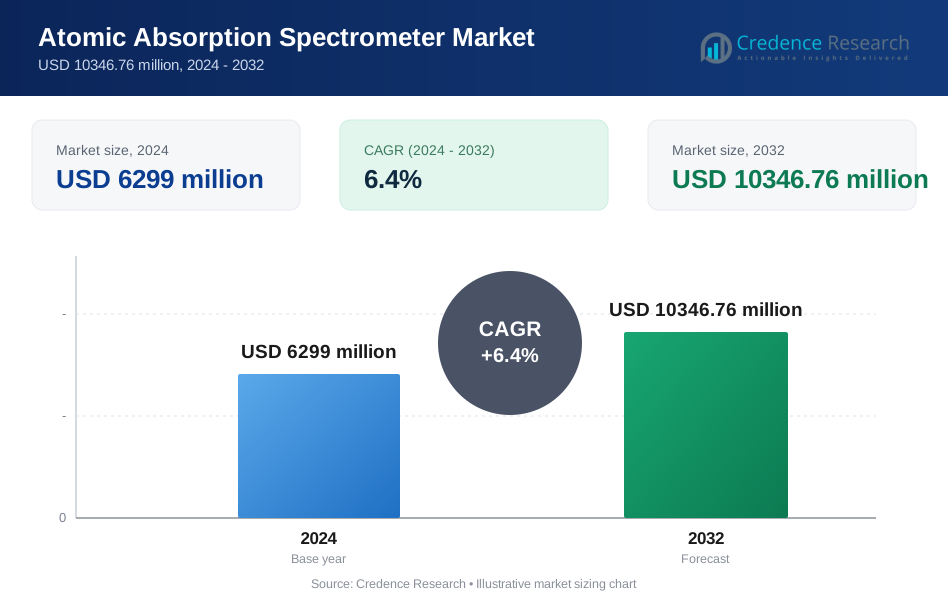
The Atomic Absorption Spectrometer (AAS) Market is projected to grow from USD 6299 million in 2024 to an estimated USD 10346.76 million by 2032, with a compound annual growth rate (CAGR) of 6.4% from 2024 to 2032.
Key drivers of the AAS market include the increasing demand for precise and accurate analytical techniques across various industries, including environmental testing, pharmaceuticals, and food & beverages. The growing need for quality control and regulatory compliance is further propelling market growth, particularly in the sectors that require trace element analysis, such as healthcare, agriculture, and water quality testing. Technological advancements in AAS systems, such as improved sensitivity, faster analysis times, and enhanced automation, are also contributing to the market’s expansion. The rise of environmental concerns and the need for monitoring pollution levels in air, water, and soil are fueling the demand for AAS devices, particularly in regulatory agencies and environmental monitoring sectors. In addition, the increasing focus on safety standards and regulations in industries such as food production and pharmaceuticals is driving the adoption of AAS technologies for detecting heavy metals and other contaminants.
Regionally, North America and Europe are leading the Atomic Absorption Spectrometer market, driven by strong investments in research and development and stringent environmental regulations that mandate precise testing. The United States, Canada, and European countries are witnessing high demand for AAS systems in industrial, academic, and governmental applications. The Asia Pacific region is expected to experience substantial growth, led by countries such as China and India, where industrial expansion and environmental monitoring initiatives are boosting the demand for AAS devices. Additionally, the Middle East and Latin America are experiencing increasing adoption of AAS technologies, particularly in the fields of oil & gas and mining industries, which require accurate trace element analysis.
Market Insights
- The Atomic Absorption Spectrometer (AAS) market is projected to grow from USD 6299 million in 2024 to USD 10346.76 million by 2032, with a CAGR of 6.4%.
- Increasing demand for precise analytical techniques in industries like pharmaceuticals, food & beverage, and environmental testing is driving market growth.
- Technological advancements in AAS systems, such as enhanced sensitivity and automation, are further boosting adoption across various sectors.
- Environmental concerns and stringent regulations regarding pollution monitoring are propelling demand for AAS devices in environmental and industrial applications.
- High initial costs of AAS instruments and the need for skilled professionals to operate them may hinder market growth.
- North America and Europe dominate the AAS market due to strong R&D investments and regulatory requirements in environmental testing and industrial quality control.
- The Asia Pacific region is expected to witness significant growth, with rising industrialization in countries like China and India, while the Middle East and Latin America are also adopting AAS technology in industries like oil & gas.
Market Drivers
Growing Demand for Precise Analytical Solutions in Various Industries
The increasing need for accurate and precise analytical techniques across industries such as pharmaceuticals, food & beverage, environmental testing, and healthcare is driving the demand for Atomic Absorption Spectrometers (AAS). For instance, the U.S. Environmental Protection Agency (EPA) has set specific regulations for monitoring heavy metals in drinking water. Under the Safe Drinking Water Act (SDWA), the EPA has established maximum contamination levels (MCLs) for hazardous substances such as lead (0.015 mg/L) and mercury (0.002 mg/L). This regulatory framework pushes industries to invest in reliable testing technologies like AAS. According to the World Health Organization (WHO), over 400 million people are exposed to unsafe levels of lead, which underscores the importance of advanced testing methods.
Technological Advancements in AAS Systems
Technological improvements in AAS, such as enhanced sensitivity, quicker analysis times, and increased automation, are further expanding the market. For instance, the National Institute of Standards and Technology (NIST) regularly updates its reference materials to improve the precision of atomic absorption spectroscopy. These improvements enable more accurate detection of trace metals at lower concentrations, which is crucial for industries such as food safety and pharmaceuticals. The U.S. Department of Energy (DOE) spent over $20 million in 2020 on advancing instrumentation technologies, which includes innovations in AAS systems for enhanced industrial and environmental monitoring.
Regulatory Compliance and Environmental Monitoring
Government regulations and initiatives aimed at reducing pollution have spurred the demand for AAS systems. For example, the European Union’s REACH regulation requires companies to test chemicals in products, mandating strict monitoring of heavy metals like arsenic and cadmium. The European Environment Agency (EEA) also allocates substantial funds to pollution control efforts, including the monitoring of hazardous substances. In 2020, the EEA allocated €15 million to projects aimed at improving air and water quality monitoring. Such regulatory initiatives drive the adoption of accurate testing technologies like AAS, particularly in the environmental sector, as companies seek to comply with these rigorous standards.
Rising Environmental Concerns and Pollution Control Initiatives
The global focus on pollution control is pushing governments to invest heavily in environmental monitoring, further driving the demand for AAS. The World Bank has allocated over $1 billion in funding for projects aimed at improving water quality in developing countries, particularly in Asia. For instance, the Indian government has committed to a $2 billion investment under the National Clean Water Mission to reduce industrial pollutants and heavy metals in rivers and lakes, driving the need for advanced testing technologies like AAS.
Market Trends
Increased Adoption of Automated AAS Systems
A key trend in the Atomic Absorption Spectrometer (AAS) market is the growing adoption of automated systems that offer higher efficiency and reduced human error. Automation is increasingly used to streamline the process of sample preparation, analysis, and data collection, particularly in industries requiring high throughput testing. For instance, the U.S. Department of Energy’s Advanced Manufacturing Office has allocated over $50 million in 2021 for the development of automated technologies to enhance production capabilities and environmental monitoring systems, including AAS devices. The integration of automation with AAS systems helps improve laboratory productivity and reduce operational costs.
Integration of AAS with Digital and AI Technologies
The integration of digital technologies and artificial intelligence (AI) with AAS systems is another significant trend. This fusion allows for real-time analysis, more accurate results, and improved decision-making processes. For example, the U.S. National Science Foundation (NSF) has invested over $10 million in 2020 to support research into AI-driven technologies to enhance scientific instrumentation, including AAS. By leveraging AI algorithms, AAS systems are becoming more capable of predictive maintenance and optimizing the performance of equipment, thus improving overall operational efficiency and minimizing downtime.
Expansion of Environmental Testing Regulations
Environmental monitoring regulations are evolving, pushing industries to enhance their testing capabilities. For instance Governments worldwide, including the European Commission, are setting stricter rules for monitoring pollutants, which has increased demand for accurate and reliable AAS systems. In 2020, the European Commission allocated €5 million towards environmental monitoring projects to assess heavy metal contamination across member states. These regulations compel companies in sectors like agriculture, food safety, and water quality to incorporate more advanced testing systems to comply with the updated environmental standards.
Focus on Trace Metal Detection for Health and Safety
The growing awareness of the health risks posed by trace metals in food, water, and air is further driving the adoption of AAS technology. For instance In the U.S., the Centers for Disease Control and Prevention (CDC) has invested $30 million in 2021 in public health initiatives targeting the reduction of lead exposure in communities. This initiative includes funding for advanced testing methods to detect trace metals in residential environments, water supplies, and food, where AAS technology is critical in ensuring compliance with safety standards.
Market Challenges Analysis
High Initial Investment and Operational Costs
One of the key challenges facing the Atomic Absorption Spectrometer (AAS) market is the high initial investment and operational costs associated with acquiring and maintaining these sophisticated instruments. The cost of AAS systems can be prohibitive for smaller laboratories and businesses, limiting widespread adoption. Additionally, the maintenance, calibration, and operational expenses related to ensuring optimal performance of AAS systems contribute significantly to the overall cost burden. For instance, the U.S. National Institutes of Health (NIH) reported in 2020 that the average cost of purchasing an AAS system ranges between $30,000 and $80,000, depending on the model and features. For smaller research institutions or laboratories with limited budgets, these upfront costs can act as a deterrent, delaying or preventing the implementation of necessary testing capabilities.
Requirement for Skilled Labor and Expertise
Another significant challenge in the AAS market is the need for highly skilled labor to operate these instruments and interpret the results accurately. AAS systems require proper calibration and fine-tuning, and the analysis of data requires expertise in chemistry and instrumental analysis. With the growing complexity of modern AAS technologies, the demand for trained professionals who can handle, maintain, and troubleshoot the systems is increasing. However, there is a global shortage of qualified personnel in this field. For example, in 2021, the U.S. Bureau of Labor Statistics reported a shortage of trained laboratory technicians, with a projected 11% increase in demand for laboratory professionals by 2030. This lack of qualified professionals further exacerbates the adoption challenges, as businesses must either invest in expensive training programs or hire external experts, leading to increased operational costs.
Market Opportunities
The Atomic Absorption Spectrometer (AAS) market presents significant growth opportunities driven by increasing regulatory requirements across various industries, including environmental testing, pharmaceuticals, and food safety. As governments and international organizations continue to implement stringent regulations for monitoring pollutants and contaminants, there is a growing demand for accurate analytical tools like AAS. For example, the European Union’s REACH regulation mandates rigorous testing for chemical substances, including heavy metals, which is boosting the adoption of AAS systems in industries seeking compliance. Similarly, the U.S. Environmental Protection Agency (EPA) enforces strict guidelines for detecting pollutants in air, water, and soil, creating a substantial market for AAS solutions. These regulatory pressures are expected to continue expanding the market as industries strive to meet the increasing demand for environmental and health safety testing.
Furthermore, advancements in AAS technology present opportunities for expansion, particularly with the integration of automation and artificial intelligence. These technological innovations enhance the precision, efficiency, and speed of analysis, making AAS more accessible to a broader range of industries and research institutions. The integration of AI-driven analysis tools can optimize performance, reduce human error, and enable real-time decision-making, further boosting market demand. In addition, emerging economies in Asia Pacific and Latin America, where industrialization and regulatory frameworks are rapidly evolving, represent untapped markets for AAS systems. As these regions invest more in environmental monitoring and quality control, they offer considerable growth potential for AAS manufacturers and solution providers.
Market Segmentation Analysis
By Type
The Atomic Absorption Spectrometer (AAS) market is primarily segmented into flame AAS, graphite furnace AAS, and others. Flame AAS is commonly used in environmental and agricultural testing due to its cost-effectiveness and simplicity for routine analysis. Graphite furnace AAS, offering higher sensitivity, is preferred for trace element analysis, particularly in the pharmaceutical and food industries. Other types, such as hydride generation AAS, are specifically designed for analyzing elements like arsenic and selenium.
By Technology
Technological advancements in automation, digital integration, and AI-driven analysis tools are shaping the AAS market. Automation improves the efficiency of testing procedures while reducing human error, making AAS more accessible and effective across different industries. The integration of digital technologies streamlines data collection and analysis, while AI technologies allow real-time monitoring and predictive maintenance, enhancing performance and reducing operational downtime.
By End-User
The AAS market is driven by end-users in sectors such as environmental testing, pharmaceuticals, food & beverage, and agriculture. Environmental agencies rely on AAS for monitoring pollution and hazardous substances in water and air. In pharmaceuticals and food industries, AAS is essential for quality control and detecting contaminants. Agriculture sectors utilize AAS for analyzing soil and water quality, ensuring nutrient levels and identifying pollutants. With increasing regulatory standards, the demand for AAS systems is expected to rise in these industries.
Segmentations
Based on Type:
- Flame AAS
- Graphite Furnace AAS
- Hydride Generation AAS
- Other AAS Types
Based on Technology:
- Automated AAS Systems
- AI-Integrated AAS Systems
- Digital AAS Systems
- Traditional AAS Systems
Based on End-User:
- Environmental Testing
- Pharmaceuticals
- Food & Beverage
- Agriculture
- Healthcare
- Mining & Metals
Based on Region:
- North America
- U.S.
- Canada
- Mexico
- Europe
- UK
- France
- Germany
- Italy
- Spain
- Russia
- Belgium
- Netherlands
- Austria
- Sweden
- Poland
- Denmark
- Switzerland
- Rest of Europe
- Asia Pacific
- China
- Japan
- South Korea
- India
- Australia
- Thailand
- Indonesia
- Vietnam
- Malaysia
- Philippines
- Taiwan
- Rest of Asia Pacific
- Latin America
- Brazil
- Argentina
- Peru
- Chile
- Colombia
- Rest of Latin America
- Middle East
- UAE
- KSA
- Israel
- Turkey
- Iran
- Rest of Middle East
- Africa
- Egypt
- Nigeria
- Algeria
- Morocco
- Rest of Africa
Regional Analysis
North America
North America holds a significant share of the Atomic Absorption Spectrometer (AAS) market, accounting for 35% of the global market. The dominance of this region is driven by stringent environmental regulations and the presence of key industries such as pharmaceuticals, environmental testing, and food & beverage. The U.S. Environmental Protection Agency (EPA) and other regulatory bodies continue to enforce rigorous standards for monitoring pollutants in water, air, and soil, pushing the adoption of AAS systems in environmental testing. In addition, the growing focus on precision and quality control in the pharmaceutical and food industries further boosts the demand for AAS technologies. For instance, in 2020, the U.S. allocated over $30 million for the advancement of analytical technologies, including AAS, to improve the detection of heavy metals in food and water sources.
Europe
Europe is another key region in the AAS market, contributing roughly 30% to the global market share. The region’s strong focus on environmental sustainability and health safety drives demand for AAS systems, particularly in environmental monitoring and industrial applications. The European Union's REACH (Registration, Evaluation, Authorization, and Restriction of Chemicals) regulation and other directives, such as the Water Framework Directive, mandate the monitoring of hazardous substances, including heavy metals, leading to a high adoption of AAS in various industries. For instance, the European Commission allocated €5 million in 2020 to fund projects aimed at improving pollution monitoring in European member states. Additionally, the increasing emphasis on food safety and contamination detection in agricultural products further supports the market growth.
Asia Pacific
Asia Pacific represents a rapidly growing market for AAS, with the region expected to capture around 25% of the global market share. Countries like China, India, and Japan are at the forefront of industrial expansion and are experiencing a rising demand for environmental testing and quality control in industries such as agriculture, pharmaceuticals, and manufacturing. For instance, in China, the government’s extensive environmental protection initiatives, including the "Air Pollution Prevention and Control Action Plan," have resulted in significant investments in pollution control and monitoring technologies. In India, the government’s National Clean Water Mission, with an investment of $2 billion, is driving the demand for advanced testing solutions like AAS to monitor water quality and heavy metal contamination. These initiatives, along with the ongoing industrialization in the region, position Asia Pacific as a key growth driver for the AAS market, with continued growth expected over the coming years.
Key Player Analysis
- PerkinElmer Inc.
- Agilent Technologies, Inc.
- Thermo Fisher Scientific Inc.
- Horiba Ltd.
- Analytik Jena AG
- Fluorometrics, Inc.
- SCHIMADZU Corporation
- Teledyne Leeman Labs
- Seiko Instruments Inc.
- Metler Toledo
Competitive Analysis
The Atomic Absorption Spectrometer (AAS) market is highly competitive, with key players like PerkinElmer, Agilent Technologies, Thermo Fisher Scientific, and Horiba Ltd. leading the industry. These companies focus on innovation, offering a wide range of AAS products tailored to diverse applications, from environmental testing to pharmaceuticals and food safety. With advancements in automation, AI integration, and improved sensitivity, these market leaders maintain a competitive edge by continually enhancing their product offerings. Strategic partnerships, acquisitions, and investments in R&D are common tactics employed to expand market reach and improve technological capabilities. Smaller players often focus on niche markets or specific regions, while large corporations leverage their global presence to meet the growing demand for AAS systems. Regulatory compliance and technological advancements, such as real-time data analysis and digital integration, further shape the competitive landscape, creating opportunities for both established and emerging players.
Recent Developments
- January 2023, Teledyne Leeman Labs introduced the Hydra IIAA and QuickTrace M-7600, Cold Vapor Atomic Absorption Mercury Analysis Systems, which feature ultra-trace detection limits for precise mercury analysis.
- October 2022, Teledyne Leeman Labs continued to focus on trace elemental analysis, offering specialized instruments for a range of industries requiring highly accurate elemental detection.
- June 2022, Shimadzu launched the AA-7800 series, known for being the world's smallest dual-system models compatible with two measurement systems, offering flexible expandability and ease of operation.
- May 2023, Fluorometrics made significant advancements in atomic spectrometry, particularly in developing new methods and instruments such as flame atomizers and high-resolution spectrometers.
Market Concentration & Characteristics
The Atomic Absorption Spectrometer (AAS) market exhibits moderate concentration, with a few dominant players like PerkinElmer, Thermo Fisher Scientific, and Agilent Technologies holding significant market share. These companies leverage their advanced technology, broad product portfolios, and established global presence to lead the market. While the market is driven by innovation and technological advancements, particularly in automation, AI integration, and improved sensitivity, smaller companies still play a vital role by catering to niche segments and specific regional demands. The market is characterized by high research and development investments, with companies focusing on improving performance, accuracy, and user-friendliness. As the demand for AAS grows across industries like pharmaceuticals, environmental testing, and food safety, key players continually strive to expand their market share through strategic acquisitions, partnerships, and the introduction of new, advanced solutions. The competitive landscape is dynamic, with a blend of large, well-established firms and smaller, agile innovators.
Report Coverage
The research report offers an in-depth analysis based on By product type, Technology, End-User, Region. It details leading market players, providing an overview of their business, product offerings, investments, revenue streams, and key applications. Additionally, the report includes insights into the competitive environment, SWOT analysis, current market trends, as well as the primary drivers and constraints. Furthermore, it discusses various factors that have driven market expansion in recent years. The report also explores market dynamics, regulatory scenarios, and technological advancements that are shaping the industry. It assesses the impact of external factors and global economic changes on market growth. Lastly, it provides strategic recommendations for new entrants and established companies to navigate the complexities of the market.
Future Outlook
- The demand for Atomic Absorption Spectrometers (AAS) will continue to grow due to increasing regulatory pressure across industries.
- Advancements in automation and digital integration will drive efficiency and reduce human error in AAS operations.
- The rise of AI-powered AAS systems will enhance real-time analysis and predictive maintenance capabilities.
- Emerging markets in Asia Pacific and Latin America will experience significant growth in AAS adoption due to industrialization and stricter regulations.
- The need for precise environmental monitoring will boost AAS demand in sectors such as water quality testing and pollution control.
- Increasing food safety regulations will drive the need for advanced AAS systems in the food and beverage industry.
- Pharmaceutical industries will continue to rely on AAS for trace metal detection and quality control in drug formulations.
- Agricultural applications for soil and water analysis will become a key area for AAS adoption, particularly in developing regions.
- Investment in research and development by key players will result in continuous improvements in AAS system sensitivity and accuracy.
- Collaborative efforts between industry leaders and government bodies will support the expansion of AAS technologies in compliance-driven sectors globally.
Request a Free Sample
Fill in your details and we'll send you a free sample report.
- Sample data tables & charts
- Research methodology
Market Dynamics
Stringent Regulatory Compliance and Environmental Monitoring
Increasingly strict regulations for pollution control and trace metal detection in water, air, and soil are compelling industries to adopt advanced AAS systems to ensure compliance and avoid penalties, especially in North America and Europe.
Technological Advancements in Sensitivity and Automation
Continuous improvements in AAS technology, such as enhanced sensitivity, faster analysis, and automation, are making these systems more efficient and attractive for high-throughput laboratories, reducing human error and operational costs.
Expansion of Industrialization and Environmental Initiatives in Emerging Markets
Rapid industrial growth and government-led environmental monitoring programs in Asia Pacific and Latin America are driving significant new demand for AAS systems for quality control and pollution assessment.
Rising Focus on Food Safety and Pharmaceutical Quality Control
Stricter safety standards in the food & beverage and pharmaceutical sectors are increasing the need for precise trace metal analysis, with AAS systems being essential for detecting contaminants and ensuring product safety.
Integration of Digital and AI Technologies
The adoption of digital platforms and AI-driven analytics in AAS systems is enabling real-time data analysis, predictive maintenance, and improved operational efficiency, further accelerating market growth across multiple industries.
Need a Custom Version of This Report?
Tailor the scope, geography, or segments to your exact requirements.
- Custom geography or segment scope
- Direct access to our analyst team
Frequently Asked Questions
What is the current size of Atomic Absorption Spectrometer?
What factors are driving the Atomic Absorption Spectrometer?
What are the key segments within the Atomic Absorption Spectrometer?
What are some challenges faced by the Atomic Absorption Spectrometer?
Who are the major players in the Top Atomic Absorption Spectrometer?
Which segment is leading the market share?
Table of Content
Chapter 1 Market Segmentation
- 1.1 Segmentation Framework
- 1.1.1 Product and Service Classification
- 1.1.2 Application and End-Use Classification
- 1.1.3 Technology and Solution Classification
- 1.1.4 Customer and Distribution Channel Classification
- 1.1.5 Geographic Segmentation
- 1.1.6 Market Segment Definitions and Boundaries
- 1.2 By Type
- 1.2.1 Flame AAS
- 1.2.2 Graphite Furnace AAS
- 1.2.3 Hydride Generation AAS
- 1.2.4 Other AAS Types
- 1.3 By End-User
- 1.3.1 Environmental Testing
- 1.3.2 Pharmaceuticals
- 1.3.3 Food & Beverage
- 1.3.4 Agriculture
- 1.3.5 Healthcare
- 1.3.6 Mining & Metals
- 1.4 By Technology
- 1.4.1 Automated AAS Systems
- 1.4.2 AI-Integrated AAS Systems
- 1.4.3 Digital AAS Systems
- 1.4.4 Traditional AAS Systems
Chapter 2 Introduction
- 2.1 Report Objectives and Scope
- 2.2 Product Definition and Industry Terminology
- 2.3 Market Inclusions and Exclusions
- 2.4 Research Process
- 2.4.1 Primary Research and Expert Interviews
- 2.4.2 Secondary Research and Source Review
- 2.4.3 Top-Down and Bottom-Up Estimation
- 2.4.4 Data Triangulation and Verification
- 2.5 Market Size Measurement Basis
- 2.5.1 2024: USD 6299 million → 2032: USD 10346.76 million
- 2.6 Historical and Forecast Reference Periods
- 2.6.1 Base Year: 2024
- 2.6.2 Forecast Period: 2024-2032
- 2.7 Research Assumptions and Limitations
Chapter 3 Executive Summary
- 3.1 Market Snapshot and Key Findings
- 3.2 Base-Year Market Size, 2024
- 3.3 Forecast Market Size, 2032
- 3.4 Revenue and Volume Growth Outlook
- 3.5 Key Demand and Supply Indicators
- 3.6 Leading Market Segments
- 3.7 Fastest-Growing Market Opportunities
- 3.8 Regional Performance Highlights
- 3.9 Technology and Industry Transformation
- 3.10 Competitive Landscape Summary
- 3.11 Analyst View and Strategic Implications
Chapter 4 Global Atomic Absorption Spectrometer Market Trends and Developments
- 4.1 Historical Industry Development
- 4.2 Recent Market Trends and Developments
- 4.3 Demand and Customer Behavior Trends
- 4.4 Technology and Product Innovation
- 4.5 Artificial Intelligence, Automation and Digitalization
- 4.6 Local Manufacturing and Supply Chain Realignment
- 4.7 Industry Partnerships, Mergers and Acquisitions
- 4.8 Sustainability and Circular Economy Developments
- 4.9 Government and Private Sector Investment Trends
- 4.10 Emerging Business Models and Commercialization
- 4.11 Industry Developments and Announcements
Chapter 5 Global Atomic Absorption Spectrometer Market Production, Supply and Demand Analysis
- 5.1 Demand Trend and Consumption Analysis
- 5.2 Demand Forecast, 2024-2032
- 5.3 Production and Output Trend
- 5.4 Production and Output Forecast, 2024-2032
- 5.5 Installed Capacity and Capacity Utilization
- 5.6 Company-Wise Production Plants and Statistics
- 5.6.1 Installed Production Capacity
- 5.6.2 Actual Production
- 5.6.3 Planned Capacity and Expansion Targets
- 5.7 Supply Chain Structure and Procurement Trends
- 5.8 Supply-Demand Gap and Bottlenecks
- 5.9 Import Dependence and Sourcing Structure
- 5.10 Contract Manufacturing and Outsourcing
- 5.11 Regional Supply and Demand Concentration
Chapter 6 Global Atomic Absorption Spectrometer Market Pricing Analysis
- 6.1 Pricing Structure and Measurement
- 6.2 Historical Pricing Trends
- 6.3 Pricing Outlook, 2024-2032
- 6.4 Average Selling Price and Unit Economics
- 6.5 Pricing by Product and Market Segment
- 6.6 Geographic Pricing Differences
- 6.7 Key Input, Energy, Labor and Logistics Costs
- 6.8 Contract Pricing and Purchasing Models
- 6.9 Pricing Sensitivity and Competitive Positioning
- 6.10 Price, Margin and Profitability Implications
Chapter 7 Global Atomic Absorption Spectrometer Market Dynamics
- 7.1 Market Growth Drivers
- 7.1.1 Demand-Side Drivers
- 7.1.2 Technology and Innovation Drivers
- 7.1.3 Infrastructure and Investment Drivers
- 7.1.4 Regulatory and Policy Drivers
- 7.2 Market Restraints
- 7.2.1 Cost and Affordability Constraints
- 7.2.2 Technology and Adoption Barriers
- 7.2.3 Supply Chain and Operational Constraints
- 7.3 Market Challenges
- 7.3.1 Competitive Pressure and Margin Erosion
- 7.3.2 Skills, Infrastructure and Implementation Gaps
- 7.4 Emerging Market Opportunities
- 7.5 Market Dynamics Impact and Time-Horizon Assessment
Chapter 8 Global Atomic Absorption Spectrometer Value Chain Analysis
- 8.1 Industry Value Chain Overview
- 8.2 Upstream Suppliers and Critical Inputs
- 8.3 Technology and Component Providers
- 8.4 Manufacturing or Service Delivery
- 8.5 Distribution, Channel Partners and Integrators
- 8.6 Downstream Applications and End Users
- 8.7 Value Addition and Profit Pools
- 8.8 Vertical Integration and Outsourcing
- 8.9 Supplier Concentration and Risk
- 8.10 Supply Chain Localization and Resilience
Chapter 9 Global Atomic Absorption Spectrometer Market Regulations and Policies
- 9.1 Relevant Laws, Standards and Compliance Frameworks
- 9.2 Product, Service, Safety and Quality Requirements
- 9.3 Government Policies, Incentives and Subsidies
- 9.4 Imports, Exports and Trade Barriers
- 9.5 Public Procurement and Local Content Requirements
- 9.6 Environmental and Sustainability Compliance
- 9.7 Upcoming Policy Changes and Market Implications
Chapter 10 Global Atomic Absorption Spectrometer Market Hotspots and Opportunities
- 10.1 Market Opportunity Mapping and Growth Hotspots
- 10.2 High-Growth Applications and Customer Groups
- 10.3 Underserved Markets and White-Space Opportunities
- 10.4 Emerging Technology and Product Opportunities
- 10.5 New Capacity and Investment Hotspots
- 10.6 Market Entry and Expansion Opportunities
- 10.7 Distribution and Partnership Opportunities
- 10.8 Near-Term and Long-Term Commercial Potential
- 10.9 Opportunity Attractiveness and Execution Risks
Chapter 11 Global Atomic Absorption Spectrometer Market Outlook, 2024-2032
- 11.1 Market Size and Analysis
- 11.1.1 Revenue (Market Measurement: 2024: USD 6299 million → 2032: USD 10346.76 million)
- 11.1.2 Market Volume and Quantity Sold
- 11.1.3 Historical Market Size
- 11.1.4 Base-Year Market Size, 2024
- 11.2 Market Forecast, 2024-2032
- 11.2.1 Revenue Forecast to 2032
- 11.2.2 Volume Forecast to 2032
- 11.2.3 CAGR and Year-on-Year Growth
- 11.2.4 Incremental Revenue Opportunity
- 11.3 Forecast Assumptions and Scenario Analysis
- 11.3.1 Base-Case Forecast
- 11.3.2 Optimistic and Conservative Scenarios
- 11.3.3 Technology, Pricing and Policy Sensitivities
- 11.4 Market Attractiveness and Growth Outlook
Chapter 12 Global Atomic Absorption Spectrometer Market Segmentation and Outlook
- 12.1 Segmentation Summary and Market Shares, 2024
- 12.2 Largest and Fastest-Growing Segments
- 12.3 By Type - Market Size and Forecast, 2024-2032
- 12.3.1 Segment Definition and Scope
- 12.3.2 Historical Market Size
- 12.3.3 Revenue Forecast, 2024-2032
- 12.3.4 Volume Forecast, 2024-2032
- 12.3.5 Base-Year Market Share, 2024
- 12.3.6 Segment CAGR and Growth Drivers
- 12.3.7 Subsegment Market Size and Forecast
- 12.3.7.1 Flame AAS
- 12.3.7.2 Graphite Furnace AAS
- 12.3.7.3 Hydride Generation AAS
- 12.3.7.4 Other AAS Types
- 12.3.8 Subsegment Pricing and Adoption Trends
- 12.3.9 Leading Suppliers and Competition
- 12.3.10 Regional Demand and Opportunities
- 12.4 By End-User - Market Size and Forecast, 2024-2032
- 12.4.1 Segment Definition and Scope
- 12.4.2 Historical Market Size
- 12.4.3 Revenue Forecast, 2024-2032
- 12.4.4 Volume Forecast, 2024-2032
- 12.4.5 Base-Year Market Share, 2024
- 12.4.6 Segment CAGR and Growth Drivers
- 12.4.7 Subsegment Market Size and Forecast
- 12.4.7.1 Environmental Testing
- 12.4.7.2 Pharmaceuticals
- 12.4.7.3 Food & Beverage
- 12.4.7.4 Agriculture
- 12.4.7.5 Healthcare
- 12.4.7.6 Mining & Metals
- 12.4.8 Subsegment Pricing and Adoption Trends
- 12.4.9 Leading Suppliers and Competition
- 12.4.10 Regional Demand and Opportunities
- 12.5 By Technology - Market Size and Forecast, 2024-2032
- 12.5.1 Segment Definition and Scope
- 12.5.2 Historical Market Size
- 12.5.3 Revenue Forecast, 2024-2032
- 12.5.4 Volume Forecast, 2024-2032
- 12.5.5 Base-Year Market Share, 2024
- 12.5.6 Segment CAGR and Growth Drivers
- 12.5.7 Subsegment Market Size and Forecast
- 12.5.7.1 Automated AAS Systems
- 12.5.7.2 AI-Integrated AAS Systems
- 12.5.7.3 Digital AAS Systems
- 12.5.7.4 Traditional AAS Systems
- 12.5.8 Subsegment Pricing and Adoption Trends
- 12.5.9 Leading Suppliers and Competition
- 12.5.10 Regional Demand and Opportunities
- 12.6 Segment Growth Comparison
- 12.7 Segment Attractiveness and Priority Matrix
Chapter 13 Global Atomic Absorption Spectrometer End-Use and Application Market Outlook
- 13.1 End-Use Industry and Customer Demand Structure
- 13.2 Leading Applications and Customer Groups
- 13.3 End-Use Market Size, Share and Forecast
- 13.4 Major End-Use Industry Deep Dives
- 13.4.1 Customer Requirements and Use Cases
- 13.4.2 Demand and Replacement Cycles
- 13.4.3 Technical and Regulatory Considerations
- 13.4.4 Purchasing and Procurement Models
- 13.4.5 Leading Vendors and Distribution Channels
- 13.4.6 Forecast and Commercial Opportunities
- 13.5 Emerging Applications and Cross-Segment Demand
- 13.6 End-Use Industry Investment Priorities
Chapter 14 Global Atomic Absorption Spectrometer Geographic Market Outlook, 2024-2032
- 14.1 Regional Market Size and Share, 2024
- 14.2 Regional Market Forecast, 2024-2032
- 14.3 Regional Pricing, Production and Demand Differences
- 14.4 North America
- 14.4.1 United States
- 14.4.2 Canada
- 14.4.3 Mexico
- 14.5 Europe
- 14.5.1 Germany
- 14.5.2 France
- 14.5.3 Italy
- 14.5.4 United Kingdom
- 14.5.5 Spain
- 14.5.6 Poland
- 14.5.7 Russia
- 14.5.8 Netherlands
- 14.5.9 Belgium
- 14.5.10 Sweden
- 14.5.11 Denmark
- 14.5.12 Norway
- 14.5.13 Rest of Europe
- 14.6 Asia Pacific
- 14.6.1 China
- 14.6.2 India
- 14.6.3 Japan
- 14.6.4 South Korea
- 14.6.5 Thailand
- 14.6.6 Indonesia
- 14.6.7 Vietnam
- 14.6.8 Malaysia
- 14.6.9 Australia
- 14.6.10 Rest of Asia Pacific
- 14.7 Latin America
- 14.7.1 Brazil
- 14.7.2 Argentina
- 14.7.3 Colombia
- 14.7.4 Chile
- 14.7.5 Rest of Latin America
- 14.8 Middle East
- 14.8.1 Saudi Arabia
- 14.8.2 United Arab Emirates
- 14.8.3 Turkey
- 14.8.4 Israel
- 14.8.5 Iran
- 14.8.6 Rest of the Middle East
- 14.9 Africa
- 14.9.1 South Africa
- 14.9.2 Egypt
- 14.9.3 Nigeria
- 14.9.4 Morocco
- 14.9.5 Rest of Africa
- 14.10 Regional Investment, Policy and Supply Chain Differences
- 14.11 Regional Competitive Landscape
- 14.12 Geographic Growth Hotspots
Chapter 15 Global Atomic Absorption Spectrometer Technology, Innovation and Sustainability Outlook
- 15.1 Technology Landscape and Maturity
- 15.2 Product, Process and Service Innovation
- 15.3 AI, Automation and Digital Tools in the Industry
- 15.4 Technology Adoption and Performance Benchmarking
- 15.5 Innovation Pipeline and R&D Investment
- 15.6 Patent and Intellectual Property Trends
- 15.7 Energy Efficiency and Resource Management
- 15.8 Sustainability, Recycling and Circularity
- 15.9 Technology Roadmap, 2024-2032
- 15.10 Risks of Obsolescence and Technology Substitution
Chapter 16 Global Atomic Absorption Spectrometer Market Key Strategic Imperatives
- 16.1 Growth and Market Entry Priorities
- 16.2 High-Return Products and Segments
- 16.3 Pricing, Profitability and Cost Optimization
- 16.4 Technology Investment and Product Differentiation
- 16.5 Supply Chain Localization and Resilience
- 16.6 Distribution and Customer Acquisition
- 16.7 Partnership, Acquisition and Capacity Strategy
- 16.8 Regional Expansion Priorities
- 16.9 Short-, Medium- and Long-Term Actions
Chapter 17 Competition Outlook
- 17.1 Industry Competition Characteristics
- 17.2 Market Structure and Concentration
- 17.3 Market Share and Competitive Positioning, 2024
- 17.4 Company-Wise Revenue and Product Benchmarking
- 17.5 Production and Service Capacity Benchmarking
- 17.6 Technology, Pricing and Differentiation
- 17.7 Regional Footprint and Distribution Strength
- 17.8 Mergers, Acquisitions and Strategic Alliances
- 17.9 New Entrants and Competitive Threats
- 17.10 Porter's Five Forces and Industry Attractiveness
- 17.11 Competitive Outlook, 2024-2032
Chapter 18 Company Profiles
- 18.1 Company Coverage and Selection Criteria
- 18.2 PerkinElmer Inc.
- 18.2.1 Business Description
- 18.2.2 Company Ownership and Geographic Presence
- 18.2.3 Product and Service Portfolio
- 18.2.4 Manufacturing and Operating Footprint
- 18.2.5 Production Capacity and Expansion Plans
- 18.2.6 Financial Performance and Investment
- 18.2.7 Market Share and Competitive Position
- 18.2.8 Technology and Innovation Capabilities
- 18.2.9 Strategic Alliances or Partnerships
- 18.2.10 Recent Developments
- 18.2.11 Growth Strategy and Outlook
- 18.3 Agilent Technologies, Inc.
- 18.4 Thermo Fisher Scientific Inc.
- 18.5 Horiba Ltd.
- 18.6 Analytik Jena AG
- 18.7 Fluorometrics, Inc.
- 18.8 Shimadzu Corporation
- 18.9 Teledyne Leeman Labs
- 18.10 Seiko Instruments Inc.
- 18.11 Mettler Toledo
- 18.12 Other Relevant Market Participants
Note: Every listed company is profiled on the structure shown under the first company. The company list is preliminary and may change based on research findings, market developments, data availability and client requirements.
Chapter 19 Disclaimer
- 19.1 Research and Forecast Disclaimer
- 19.2 Data Source and Estimation Limitations
Note: The depth of individual sections depends on data availability for this market. Volume, capacity, trade and other unit-based metrics are included where applicable.