
Market Overview
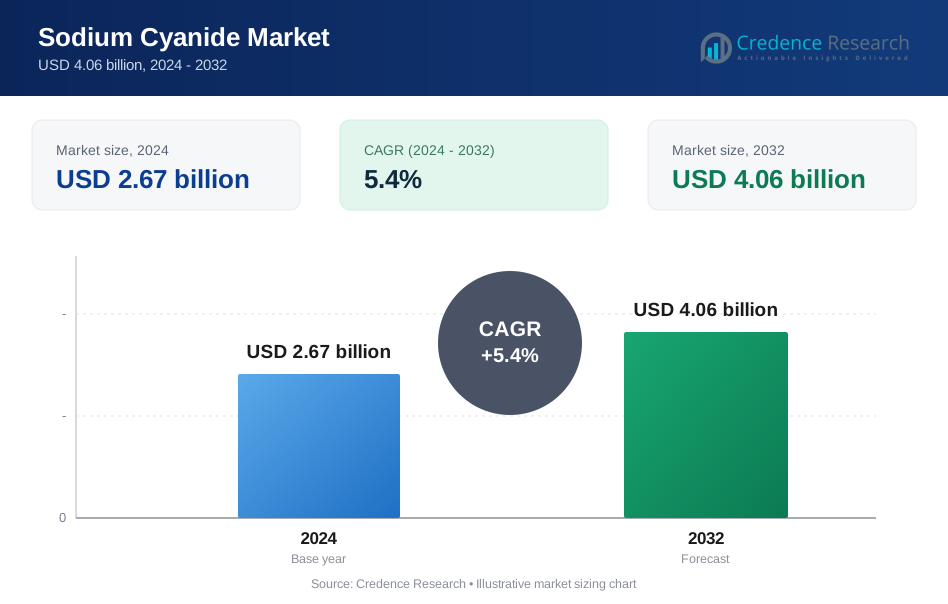
Sodium cyanide Market system market size was valued USD 2.67 billion in 2024 and is anticipated to reach USD 4.06 billion by 2032, at a CAGR of 5.4% during the forecast period.
| REPORT ATTRIBUTE | DETAILS |
|---|---|
| Historical Period | 2020-2023 |
| Base Year | 2024 |
| Forecast Period | 2025-2032 |
| Sodium cyanide Market Size 2024 | USD 2.67 Billion |
| Sodium cyanide Market, CAGR | 5.4% |
| Sodium cyanide Market Size 2032 | USD 4.06 Billion |
The sodium cyanide market is dominated by key players such as Orica, Taekwang Industrial Co. Ltd, The Chemours Company, CyPlus GmbH, Anhui Shuguang Chemical Group, Cyanco International LLC, Tongsuh Petrochemical Corp. Ltd, Australian Gold Reagents Pty Ltd, Ynnovate Sanzheng (Yingkou) Fine Chemicals Co. Ltd, and Korund. These companies focus on large-scale production, advanced process technologies, and compliance with international safety standards. Strategic collaborations with mining firms and investments in sustainable manufacturing enhance their competitive strength. Asia-Pacific leads the global market with a 41% share, driven by extensive mining operations in China and Australia and rising chemical production across emerging economies.
Market Insights
- The Sodium Cyanide Market was valued at USD 2.67 billion in 2024 and is projected to reach USD 4.06 billion by 2032, growing at a CAGR of 5.4%.
- Rising demand from the gold and silver mining industry remains the key market driver, with the mining segment holding the largest share due to its essential role in metal extraction.
- Technological advancements, including digital monitoring systems and eco-friendly production methods, are shaping new market trends and improving process safety.
- The market is highly competitive, with major players such as Orica, The Chemours Company, and Cyanco International LLC focusing on capacity expansion and sustainable manufacturing.
- Asia-Pacific leads with a 41% regional share, followed by North America at 32%, while the solid sodium cyanide segment dominates the product category owing to its stability, ease of transport, and strong use in large-scale mining operations.
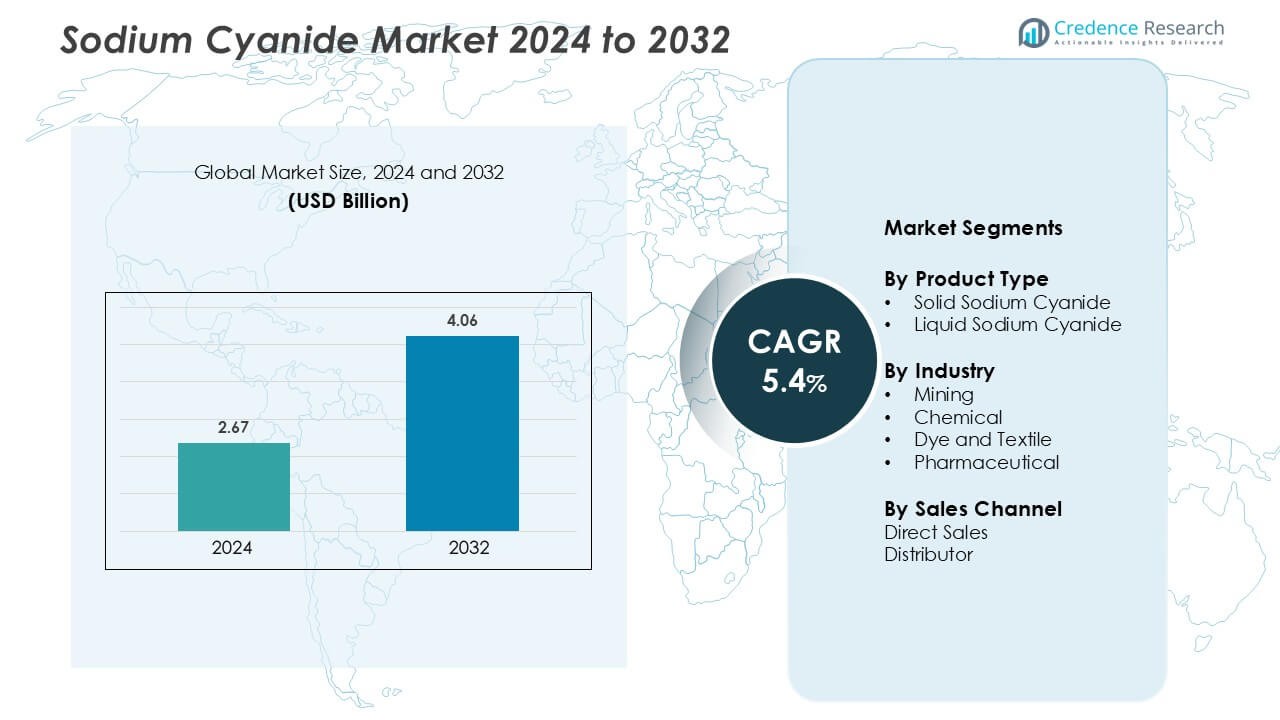
Market Segmentation Analysis:
By Product Type
Solid sodium cyanide dominates the market, capturing the largest share due to its stability, ease of transport, and extended shelf life. The solid form is preferred by gold mining operations for leaching processes that require precise dosage and minimal spillage risk. Liquid sodium cyanide, while offering handling convenience, faces limitations in long-distance transport and storage safety. The high adoption of solid variants in regions with extensive gold extraction activities supports consistent market demand. Growing use in bulk packaging systems further strengthens its dominance in large-scale mining applications.
- For instance, Taekwang Industrial Co Ltd operates a solid-sodium-cyanide plant in Ulsan with an annual capacity of 65,000 metric tons of briquette product.
By Industry
The mining segment holds the dominant share of the sodium cyanide market, accounting for most global consumption. Its strong demand stems from widespread use in gold and silver extraction through cyanidation processes. The chemical and dye industries also contribute steadily, utilizing sodium cyanide as an intermediate in chemical synthesis and pigment production. The pharmaceutical sector employs smaller volumes for specialized synthesis reactions. Ongoing expansion of gold mining projects across Asia-Pacific and Africa remains a major driver, enhancing consumption patterns across both established and emerging economies.
- For instance, Orica Limited expanded its sodium-cyanide production capacity to approximately 240,000 metric tons per year, underscoring its commitment to global gold-mining supply.
By Sales Channel
Direct sales lead the sodium cyanide market, securing the largest share due to bulk demand from large mining corporations and industrial users. Producers prefer direct sales to ensure quality control, reliable delivery, and compliance with hazardous chemical handling regulations. Distributors serve smaller buyers, providing localized access and customized quantities, mainly in chemical and dye sectors. Strong supply partnerships between manufacturers and mining firms support consistent contract-based supply. The preference for long-term procurement contracts in resource-intensive industries continues to reinforce the dominance of the direct sales channel.
Key Growth Drivers
Expansion of Gold and Silver Mining Activities
The growing demand for gold and silver is a major factor driving sodium cyanide consumption. The compound plays a vital role in the cyanidation process, which extracts precious metals from low-grade ores efficiently. Rising exploration and production activities in countries like China, Australia, and Indonesia are increasing the need for reliable cyanide supply. Mining companies are adopting advanced heap leaching and carbon-in-pulp technologies that rely heavily on sodium cyanide. Moreover, the reopening of dormant mines and new investments in mineral extraction projects are contributing to consistent product demand. This expansion in mining capacity continues to strengthen the market’s long-term growth trajectory.
- For instance, Orica’s sodium cyanide manufacturing facility at Yarwun, Queensland, has a production capacity of 95,000 metric tons annually, supporting its supply to major mining markets.
Rising Use in Chemical and Industrial Manufacturing
Sodium cyanide serves as a key precursor in manufacturing various organic and inorganic chemicals. Its role in producing cyanuric chloride, nitriles, and dyes has broadened industrial applications across chemical processing and dye manufacturing. Growing demand for specialty chemicals and pigments, particularly in emerging economies, is driving higher consumption levels. Industries are also using sodium cyanide in electroplating, heat treatment, and surface finishing processes that enhance metal durability. The compound’s versatility and reactivity make it essential for synthesizing high-value intermediates. Expanding industrial output and chemical production in Asia-Pacific and Latin America further fuel market growth, making the chemical sector a secondary yet strong growth pillar.
- For instance, CyPlus GmbH operates a plant in Mexico with an annual production capacity of 40,000 metric tons, supporting chemical-industry applications beyond mining.
Technological Advancements in Production and Safety Handling
Innovations in sodium cyanide production technologies have improved yield efficiency and reduced environmental impact. Modernized plants use advanced ammonia oxidation and hydrogen cyanide synthesis systems to enhance process safety and minimize emissions. Key manufacturers are also integrating digital monitoring systems for continuous tracking of pressure and temperature conditions, ensuring optimal operation. Enhanced packaging solutions, such as IBC containers and ISO tanks, have improved transport safety. These advancements align with global regulatory standards and strengthen trust among large industrial buyers. Additionally, investment in closed-loop production systems helps reduce waste generation and promotes sustainable manufacturing practices, further supporting market growth through operational excellence.
Key Trends & Opportunities
Shift Toward Environmentally Sustainable Production
Growing environmental concerns are pushing manufacturers to adopt eco-friendly sodium cyanide production techniques. Companies are focusing on developing low-emission manufacturing units that comply with international environmental regulations, including the International Cyanide Management Code (ICMC). The trend toward closed-system cyanide recovery and reuse minimizes waste discharge and enhances sustainability. This transition not only improves brand reputation but also attracts partnerships with responsible mining companies. Regulatory incentives for sustainable chemical production and the global push toward green mining practices present new growth opportunities for compliant producers, creating a competitive edge in a regulated industry.
- For instance, Orica’s facility in Queensland operates under the International Cyanide Management Institute code and lists a nameplate annual capacity of 95,000 metric tons for solid sodium cyanide.
Expanding Market Opportunities in Emerging Economies
Emerging economies in Asia-Pacific, Africa, and Latin America are becoming key consumers of sodium cyanide due to increased mining investments. Governments are prioritizing mineral resource development to strengthen export revenues, creating a favorable environment for chemical suppliers. Infrastructure expansion, growing industrial capacity, and supportive trade policies further drive sodium cyanide demand. Local production facilities are emerging to reduce import dependency and improve supply chain efficiency. These developments open new market opportunities for both established and regional players, especially in regions with abundant mineral reserves and limited domestic manufacturing capabilities.
- For instance, Orica expanded its global sodium cyanide production capacity to approximately 240,000 metric tons per year following its acquisition of Cyanco International, LLC enhancing supply into Latin America and Africa.
Integration of Digital Monitoring in Cyanide Management
Digitization in supply and storage management is reshaping how sodium cyanide is handled across industries. Advanced tracking technologies and IoT-enabled systems enable real-time monitoring of inventory, leakage detection, and compliance reporting. Mining companies are adopting smart logistics solutions that ensure safe transport and reduce human exposure risks. Integration of automation in cyanide dosing systems improves precision and efficiency in mineral extraction processes. This trend not only enhances operational safety but also reduces costs and waste, positioning technology adoption as a strategic advantage for market participants.
Key Challenges
Stringent Environmental and Safety Regulations
Sodium cyanide’s high toxicity poses major regulatory and operational challenges. Governments and environmental agencies have imposed strict rules on its production, storage, transport, and disposal to prevent contamination. Compliance with the ICMC and other safety standards increases production costs and limits small-scale manufacturer participation. Non-compliance can result in plant shutdowns or export bans, affecting profitability. Managing hazardous waste and preventing leakage during transit require advanced containment systems and specialized personnel. These stringent norms slow market expansion but also drive the need for sustainable and safer production methods.
Fluctuating Raw Material Prices and Supply Chain Disruptions
The sodium cyanide market faces price volatility due to fluctuations in raw materials like hydrogen cyanide, ammonia, and natural gas. Sudden supply disruptions or geopolitical tensions can inflate input costs, impacting production margins. Transport restrictions for hazardous materials further complicate supply logistics. Dependence on mining activity cycles also adds instability to market demand. Manufacturers must maintain strong supplier networks and invest in local production capabilities to mitigate risks. Addressing these challenges requires effective procurement strategies and diversification to maintain steady output and long-term competitiveness in volatile global markets.
Regional Analysis
North America
North America holds a significant share of the sodium cyanide market, accounting for 32% of global revenue. The region’s dominance stems from the presence of large-scale gold mining operations in the United States and Canada. Strong industrial infrastructure, stringent regulatory frameworks, and high adoption of cyanide management standards support steady demand. Mining companies in Nevada, Alaska, and Ontario remain key consumers due to ongoing mineral extraction projects. Additionally, the region benefits from established chemical manufacturing capabilities and advanced logistics networks, ensuring consistent production and safe distribution across major industrial sectors.
Europe
Europe accounts for 18% of the global sodium cyanide market, driven by steady demand from the chemical and dye industries. Countries such as Germany, Poland, and Finland contribute significantly due to advanced manufacturing bases. Stringent environmental regulations have encouraged producers to adopt cleaner technologies and comply with the International Cyanide Management Code. The region’s focus on sustainable chemical production and limited mining activity shifts consumption toward industrial and research applications. Increasing import of sodium cyanide from Asia-Pacific and North America balances regional supply, ensuring steady availability for downstream industries.
Asia-Pacific
Asia-Pacific leads the global sodium cyanide market with a 41% share, driven by expanding mining and industrial sectors. China, Australia, and Indonesia dominate regional consumption due to extensive gold and silver mining operations. The rapid growth of chemical, dye, and textile manufacturing further enhances demand. Strong local production capacity and favorable government policies promote self-sufficiency in sodium cyanide manufacturing. Ongoing investments in mineral processing infrastructure and export-oriented production strengthen Asia-Pacific’s leadership. Additionally, rising safety awareness and adoption of digital monitoring technologies are improving operational efficiency across mining and industrial applications.
Latin America
Latin America captures 6% of the global sodium cyanide market, supported by expanding mining activities in Mexico, Peru, and Chile. The region’s increasing gold and silver output drives steady product demand. Local producers and international suppliers are focusing on partnerships to meet the growing consumption from metal extraction industries. Government initiatives promoting mining investments and favorable trade policies boost market growth. However, limited domestic production capacities and dependency on imports from North America and Asia-Pacific present supply challenges, encouraging regional manufacturers to enhance cyanide production and distribution networks.
Middle East & Africa
The Middle East and Africa hold a 3% share of the sodium cyanide market, with South Africa leading consumption due to its strong gold mining industry. Emerging mining projects in Ghana and Tanzania are increasing cyanide demand across the region. Limited local production and reliance on imported materials remain key challenges. However, investments in mineral processing infrastructure and growing partnerships with international chemical suppliers support gradual market expansion. Rising government efforts to regulate hazardous chemical handling and promote mining safety are also contributing to the region’s long-term growth potential.
Market Segmentations:
By Product Type
- Solid Sodium Cyanide
- Liquid Sodium Cyanide
By Industry
- Mining
- Chemical
- Dye and Textile
- Pharmaceutical
By Sales Channel
- Direct Sales
- Distributor
By Geography
- North America
- U.S.
- Canada
- Mexico
- Europe
- Germany
- France
- U.K.
- Italy
- Spain
- Rest of Europe
- Asia Pacific
- China
- Japan
- India
- South Korea
- South-east Asia
- Rest of Asia Pacific
- Latin America
- Brazil
- Argentina
- Rest of Latin America
- Middle East & Africa
- GCC Countries
- South Africa
- Rest of the Middle East and Africa
Competitive Landscape
The sodium cyanide market is moderately consolidated, with major producers emphasizing safety compliance, production efficiency, and supply reliability. Orica and Cyanco International, LLC lead globally through large-scale manufacturing capacities and robust logistics networks supporting gold mining and chemical processing industries. The Chemours Company and CyPlus GmbH focus on high-purity sodium cyanide production using advanced membrane technologies to ensure consistent quality and reduced environmental impact. Taekwang Industrial Co. Ltd and Tongsuh Petrochemical Corp. Ltd strengthen Asia-Pacific’s presence with cost-efficient production and regional distribution networks. Australian Gold Reagents Pty Ltd and Anhui Shuguang Chemical Group focus on localized production models that reduce import dependency and enhance sustainability. Ynnovate Sanzheng (Yingkou) Fine Chemicals Co. Ltd and Korund serve niche markets through customized formulations and flexible supply chains. Strategic alliances, capacity expansions, and adoption of closed-loop cyanide recovery systems remain key strategies to ensure competitiveness and regulatory compliance across global operations.
Key Player Analysis
- Orica
- Taekwang Industrial Co Ltd
- The Chemours Company
- CyPlus GmbH
- Anhui Shuguang Chemical Group
- Cyanco International, LLC
- Tongsuh Petrochemical Corp. Ltd
- Australian Gold Reagents Pty Ltd
- Ynnovate Sanzheng (Yingkou) Fine Chemicals Co Ltd
- Korund
Recent Developments
- In January 2025, Australian Gold Reagents approved a 30% capacity expansion at its Kwinana facility, lifting solution output to 130,000 tons/y and reinforcing supply security for Western Australian mines.
- In April 2024, DGTR recommended anti-dumping duties on Chinese, EU, Japanese, and Korean sodium cyanide (NaCN).
- In February 2024, Orica closed the USD 640 million Cyanco acquisition, raising consolidated capacity to 240,000 t/y and broadening its global distribution grid.
Report Coverage
The research report offers an in-depth analysis based on Product Type, Industry, Sales channel and Geography. It details leading market players, providing an overview of their business, product offerings, investments, revenue streams, and key applications. Additionally, the report includes insights into the competitive environment, SWOT analysis, current market trends, as well as the primary drivers and constraints. Furthermore, it discusses various factors that have driven market expansion in recent years. The report also explores market dynamics, regulatory scenarios, and technological advancements that are shaping the industry. It assesses the impact of external factors and global economic changes on market growth. Lastly, it provides strategic recommendations for new entrants and established companies to navigate the complexities of the market.
Future Outlook
- The demand for sodium cyanide will continue to grow with expanding global gold and silver mining projects.
- Adoption of environmentally sustainable production technologies will gain momentum among leading manufacturers.
- Asia-Pacific will remain the dominant regional market due to strong mining and chemical sector growth.
- Investments in digital monitoring systems will improve operational safety and transport efficiency.
- Increasing regulatory compliance will push producers toward closed-loop and low-emission manufacturing systems.
- Partnerships between mining firms and cyanide suppliers will strengthen long-term supply stability.
- Emerging markets in Africa and Latin America will create new opportunities for regional manufacturing.
- Advancements in storage and packaging will enhance product handling and reduce leakage risks.
- Diversification of applications in chemicals and dyes will support consistent market expansion.
- Strategic mergers and capacity expansions will define competitive growth and global market positioning.
Request a Free Sample
Fill in your details and we'll send you a free sample report.
- Sample data tables & charts
- Research methodology
Need a Custom Version of This Report?
Tailor the scope, geography, or segments to your exact requirements.
- Custom geography or segment scope
- Direct access to our analyst team
Frequently Asked Questions
What is the current market size for Sodium Cyanide Market, and what is its projected size in 2032?
At what Compound Annual Growth Rate is the Sodium Cyanide Market projected to grow between 2025 and 2032?
Which Sodium Cyanide Market segment held the largest share in 2024?
What are the primary factors fueling the growth of the Sodium Cyanide Market?
Who are the leading companies in the Sodium Cyanide Market?
Which region commanded the largest share of the Sodium Cyanide Market in 2024?
Table of Content
Chapter 1. Report Introduction
- 1.1 Report Description & Purpose
- 1.1.1 Report Title & Market Definition
- 1.1.2 Unique Selling Propositions (USP) & Key Differentiators
- 1.1.3 Value Proposition for Stakeholders
- 1.2 Research Objectives
- 1.2.1 Market Sizing Objectives (Volume & Revenue)
- 1.2.2 Segmentation Objectives
- 1.2.3 Competitive Intelligence Objectives
- 1.2.4 Forecast & Scenario Objectives
- 1.3 Report Scope
- 1.3.1 Sodium Cyanide Scope – Types & Subtypes Covered
- 1.3.2 Geographic Scope – Regions & Countries Covered
- 1.3.3 Historical Period, Base Year & Forecast Period (2024; forecast to 2032)
- 1.3.4 Inclusions & Exclusions
- 1.4 HS Code & Classification Framework
- 1.5 Currency, Units & Pricing Basis
- 1.6 Target Stakeholders
- 1.7 Limitations & Assumptions
Chapter 2. Executive Summary
- 2.1 Global Sodium Cyanide Market Snapshot
- 2.1.1 Market Size – Historical (2024) & Forecast (2024-2032) (2024: USD 2.67 billion → 2032: USD 4.06 billion)
- 2.1.2 Volume & Revenue – Global Totals
- 2.1.3 Key Market Highlights – Top Five Facts
- 2.2 Sodium Cyanide Market Segmentation Snapshot
- 2.2.1 Market Split by Region – 2024 vs. 2032
- 2.3 Competitive Snapshot
- 2.3.1 Top 10 Players by Revenue Share – 2024
- 2.3.2 Top 10 Players by Volume Share – 2024
- 2.3.3 Recent Strategic Developments (18-Month Summary)
- 2.4 Key Investment Highlights & Strategic Conclusions
Chapter 3. Sodium Cyanide Market Dynamics & Industry Analysis
- 3.1 Market Overview & Context
- 3.1.1 Sodium Cyanide Market Position in the Broader Automotive Value Chain
- 3.1.2 OEM vs. Replacement Market Dynamics
- 3.1.3 Market Maturity & Development Stage by Region
- 3.2 Sodium Cyanide Market Drivers
- 3.3 Sodium Cyanide Market Restraints & Challenges
- 3.4 Sodium Cyanide Market Opportunities
- 3.5 Porter's Five Forces Analysis
- 3.5.1 Threat of New Entrants
- 3.5.2 Bargaining Power of Suppliers
- 3.5.3 Bargaining Power of Buyers
- 3.5.4 Threat of Substitutes
- 3.5.5 Competitive Rivalry – Intensity Assessment
- 3.6 Sodium Cyanide Value Chain Analysis
- 3.6.1 Upstream – Raw Material/Input Suppliers
- 3.6.1.1 Raw Material/Input 1
- 3.6.1.2 Raw Material/Input 2
- 3.6.1.3 Raw Material/Input 3
- 3.6.2 Midstream – Production/Manufacturing/Service Delivery
- 3.6.2.1 Production/Process Overview
- 3.6.2.2 Key Facility Locations & Capacity by Manufacturer
- 3.6.3 Downstream – Distribution & End Consumer
- 3.6.3.1 Primary Channel – B2B/OEM
- 3.6.3.2 Secondary Channels – Dealer, Retail, Online, Direct
- 3.6.4 Value Chain Profitability Analysis
- 3.6.1 Upstream – Raw Material/Input Suppliers
- 3.7 PESTEL Analysis
- 3.7.1 Political Factors
- 3.7.2 Economic Factors
- 3.7.3 Social Factors
- 3.7.4 Technological Factors
- 3.7.5 Environmental Factors
- 3.7.6 Legal Factors
- 3.8 Sodium Cyanide Supply Chain Analysis
- 3.8.1 Raw Material/Input Supply Risk Assessment
- 3.8.2 Manufacturing Concentration Risk (Geographic Exposure)
- 3.8.3 Trade Disruption Impact Analysis
- 3.9 Regulatory & Policy Landscape
Note: The regulatory and policy landscape section covers regulations based on their applicability to the market, Sodium Cyanide category, geography, and scope of the study. Only regulatory frameworks with a material impact on operations, compliance, trade, sustainability, or market access are analyzed in detail.
Chapter 4. Key Investment Pockets & Opportunity Analysis
- 4.1 Sodium Cyanide Market Attractiveness Analysis
- 4.1.1 By Region – Investment Attractiveness Matrix (Volume × CAGR)
- 4.2 Absolute Revenue Growth Opportunity
- 4.2.1 By Region – Absolute USD Growth Through 2032
- 4.3 Incremental Volume Opportunity
- 4.3.1 By Region – Incremental Volume Through 2032
- 4.3.2 Segment – Incremental Volume
- 4.4 Emerging Submarket Opportunity Deep Dive (Subject to Applicability)
- 4.5 Emerging Market Opportunity Scorecards
- 4.5.1 United States
- 4.5.2 Europe
- 4.5.3 Asia
- 4.5.4 Middle East & Africa
Note: Emerging Market Opportunity Scorecards will be included based on relevance and strategic importance. Regions listed are indicative and may vary depending on data availability and market dynamics.
Chapter 5. Sodium Cyanide Import-Export Analysis & Trade Flows
- 5.1 Global Trade Overview
- 5.1.1 Global Export Value by Country (2024)
- 5.1.2 Global Export Volume by Country (2024)
- 5.1.3 Global Import Value by Country (2024)
- 5.1.4 Global Import Volume by Country (2024)
- 5.1.5 Net Trade Balance by Country (2024)
- 5.2 Export Analysis – Segment
- 5.2.1 Type 1 (HS Code)
- 5.2.2 Type 2 (HS Code)
- 5.2.3 Type 3 (HS Code)
- 5.2.4 Type 4 (HS Code)
- 5.2.5 Type 5 (HS Code)
- 5.3 Import Analysis – Segment
- 5.3.1 Type 1 (HS Code)
- 5.3.2 Type 2 (HS Code)
- 5.3.3 Type 3 (HS Code)
- 5.3.4 Type 4 (HS Code)
- 5.3.5 Type 5 (HS Code)
- 5.4 Average Unit Trade Prices
- 5.4.1 Average Export Price – Segment & Country
- 5.4.2 Average Import Price – Segment & Source Country
- 5.4.3 Price Trends (2024)
- 5.5 Key Trade Route Analysis
- 5.5.1 Trade Route 1
- 5.5.2 Trade Route 2
- 5.5.3 Trade Route 3
- 5.5.4 Trade Route 4
- 5.5.5 Trade Route 5
- 5.6 Trade Policy Impact Assessment
- 5.6.1 US Anti-Dumping & Section 301 Tariffs
- 5.6.2 EU Customs Union Impact
- 5.6.3 Major Free Trade Agreements
- 5.6.4 USMCA Rules of Origin
Note: Trade policy analysis will be included only where relevant to the Sodium Cyanide market.
Chapter 6. Competitive Landscape & Company Benchmarking
- 6.1 Sodium Cyanide Market Concentration & Structure
- 6.1.1 Herfindahl-Hirschman Index (HHI) – vs. 2024
- 6.1.2 Tier 1, Tier 2 & Tier 3 Market Structure
- 6.1.3 Global, Regional & Local Player Dynamics
- 6.2 Sodium Cyanide Market Share Analysis – 2024
- 6.2.1 Global Revenue Share by Company
- 6.2.2 Global Volume Share by Company
- 6.2.3 Regional Revenue Share
- 6.2.4 Market Share Evolution ( vs. 2024)
- 6.2.5 OEM Segment Share by Company
- 6.2.6 Replacement Segment Share by Company
- 6.3 Production/Delivery Capacity & Facility Analysis
- 6.3.1 Global Installed Capacity
- 6.3.2 Capacity Utilization Rates
- 6.3.3 Production/Output Volume
- 6.3.4 Facility Locations & Capacity Map
- 6.3.5 Planned Capacity Additions
- 6.4 Sodium Cyanide Competitive Benchmarking Matrix
- 6.4.1 Revenue, Volume, CAGR & Profitability Comparison
- 6.4.2 Channel Revenue Mix
- 6.4.3 Geographic Revenue Exposure
- 6.4.4 R&D Intensity
- 6.4.5 Sustainability Maturity
- 6.5 Strategic Developments in Sodium Cyanide (Last 24 Months)
- 6.5.1 Mergers, Acquisitions & Divestments
- 6.5.2 New Sodium Cyanide Launches
- 6.5.3 Facility Expansions
- 6.5.4 Strategic Alliances, Joint Ventures & Partnerships
- 6.5.5 Distribution Expansion & Market Entry
- 6.5.6 Sustainability & ESG Initiatives
- 6.6 Competitive Strategy Mapping
- 6.6.1 Leader, Challenger, Follower & Niche Classification
- 6.6.2 Pricing Strategy Comparison
- 6.6.3 Channel Strategy Matrix
Note: Strategic developments are included based on their materiality and the availability of reliable information.
Chapter 7. Global Sodium Cyanide Market – By Distribution Channel
- 7.1 Segment Overview
- 7.1.1 Volume & Revenue Split by Channel (2024 & 2032)
- 7.1.2 Channel Mix Evolution (2024-2032)
Chapter 8. Regional Market Analysis – Global Overview
- 8.1 Global Regional Overview
- 8.1.1 Regional Volume Share
- 8.1.2 Regional Revenue Share
- 8.1.3 Regional Volume by Region
- 8.1.4 Regional Revenue by Region
- 8.1.5 Regional Forecast Through 2032
- 8.2 Cross-Regional Segment Analysis
- 8.2.1 By Distribution Channel
- 8.2.2 By Brand/Price Tier
Chapter 9. North America Sodium Cyanide Market
- 9.1 United States
- 9.2 Canada
- 9.3 Mexico
Chapter 10. Europe Sodium Cyanide Market
- 10.1 Germany
- 10.2 France
- 10.3 Italy
- 10.4 United Kingdom
- 10.5 Spain
- 10.6 Poland
- 10.7 Russia
- 10.8 Netherlands
- 10.9 Belgium
- 10.10 Sweden
- 10.11 Denmark
- 10.12 Norway
- 10.13 Rest of Europe
Chapter 11. Asia Pacific Sodium Cyanide Market
- 11.1 China
- 11.2 India
- 11.3 Japan
- 11.4 South Korea
- 11.5 Thailand
- 11.6 Indonesia
- 11.7 Vietnam
- 11.8 Malaysia
- 11.9 Australia
- 11.10 Rest of Asia Pacific
Chapter 12. Latin America Sodium Cyanide Market
- 12.1 Brazil
- 12.2 Argentina
- 12.3 Colombia
- 12.4 Chile
- 12.5 Rest of Latin America
Chapter 13. Middle East Sodium Cyanide Market
- 13.1 Saudi Arabia
- 13.2 United Arab Emirates
- 13.3 Turkey
- 13.4 Israel
- 13.5 Iran
- 13.6 Rest of the Middle East
Chapter 14. Africa Sodium Cyanide Market
- 14.1 South Africa
- 14.2 Egypt
- 14.3 Nigeria
- 14.4 Morocco
- 14.5 Rest of Africa
Chapter 15. Sodium Cyanide Company Profiles
- 15.1 [Company 01]
- 15.1.1 Company Overview
- 15.1.2 Key Management Personnel
- 15.1.3 Products & Services Portfolio
- 15.1.4 Financial Performance
- 15.1.5 Key Market Focus & Geographic Presence
- 15.1.6 Recent Developments & Strategic Initiatives
Note: The company profile list is preliminary and may change based on research findings, market developments, data availability, and client requirements.
Chapter 16. Appendices
- Appendix A – List of Abbreviations & Acronyms
- Appendix B – Industry Classification Code Reference – Full Series
- Appendix C – Production & Capacity Data Tables
- Appendix D – End-Use & Demand Base Tables
- Appendix E – Consumption & Replacement Rate Assumptions
- Appendix F – ASP Reference Tables
- Appendix G – Manufacturing & Facility Database
- Appendix H – Import-Export Data Tables
- Appendix I – Regulatory Summary Tables
- Appendix J – Primary Research Participant List (Anonymized)
- Appendix K – Primary Research Questionnaire Framework
- Appendix L – Data Sources & Bibliography
- Appendix M – Market Size Divergence & Source Comparison
Chapter 17. Research Methodology
- 17.1 Research Framework & Philosophy
- 17.2 Secondary Research – Sources, Hierarchy & Data Extraction
- 17.3 Data Modeling – Bottom-Up & Top-Down Market Sizing
- 17.4 Primary Research – Stakeholder Framework, LOI & Sample Sizes
- 17.5 Forecast Methodology – Regression, Scenario & Sensitivity Analysis
- 17.6 Quality Control – Four-Layer Validation Framework
- 17.7 Limitations & Standard Assumptions
- 17.8 Disclaimer
