
Meat volumes and new trade lanes shape export logistics
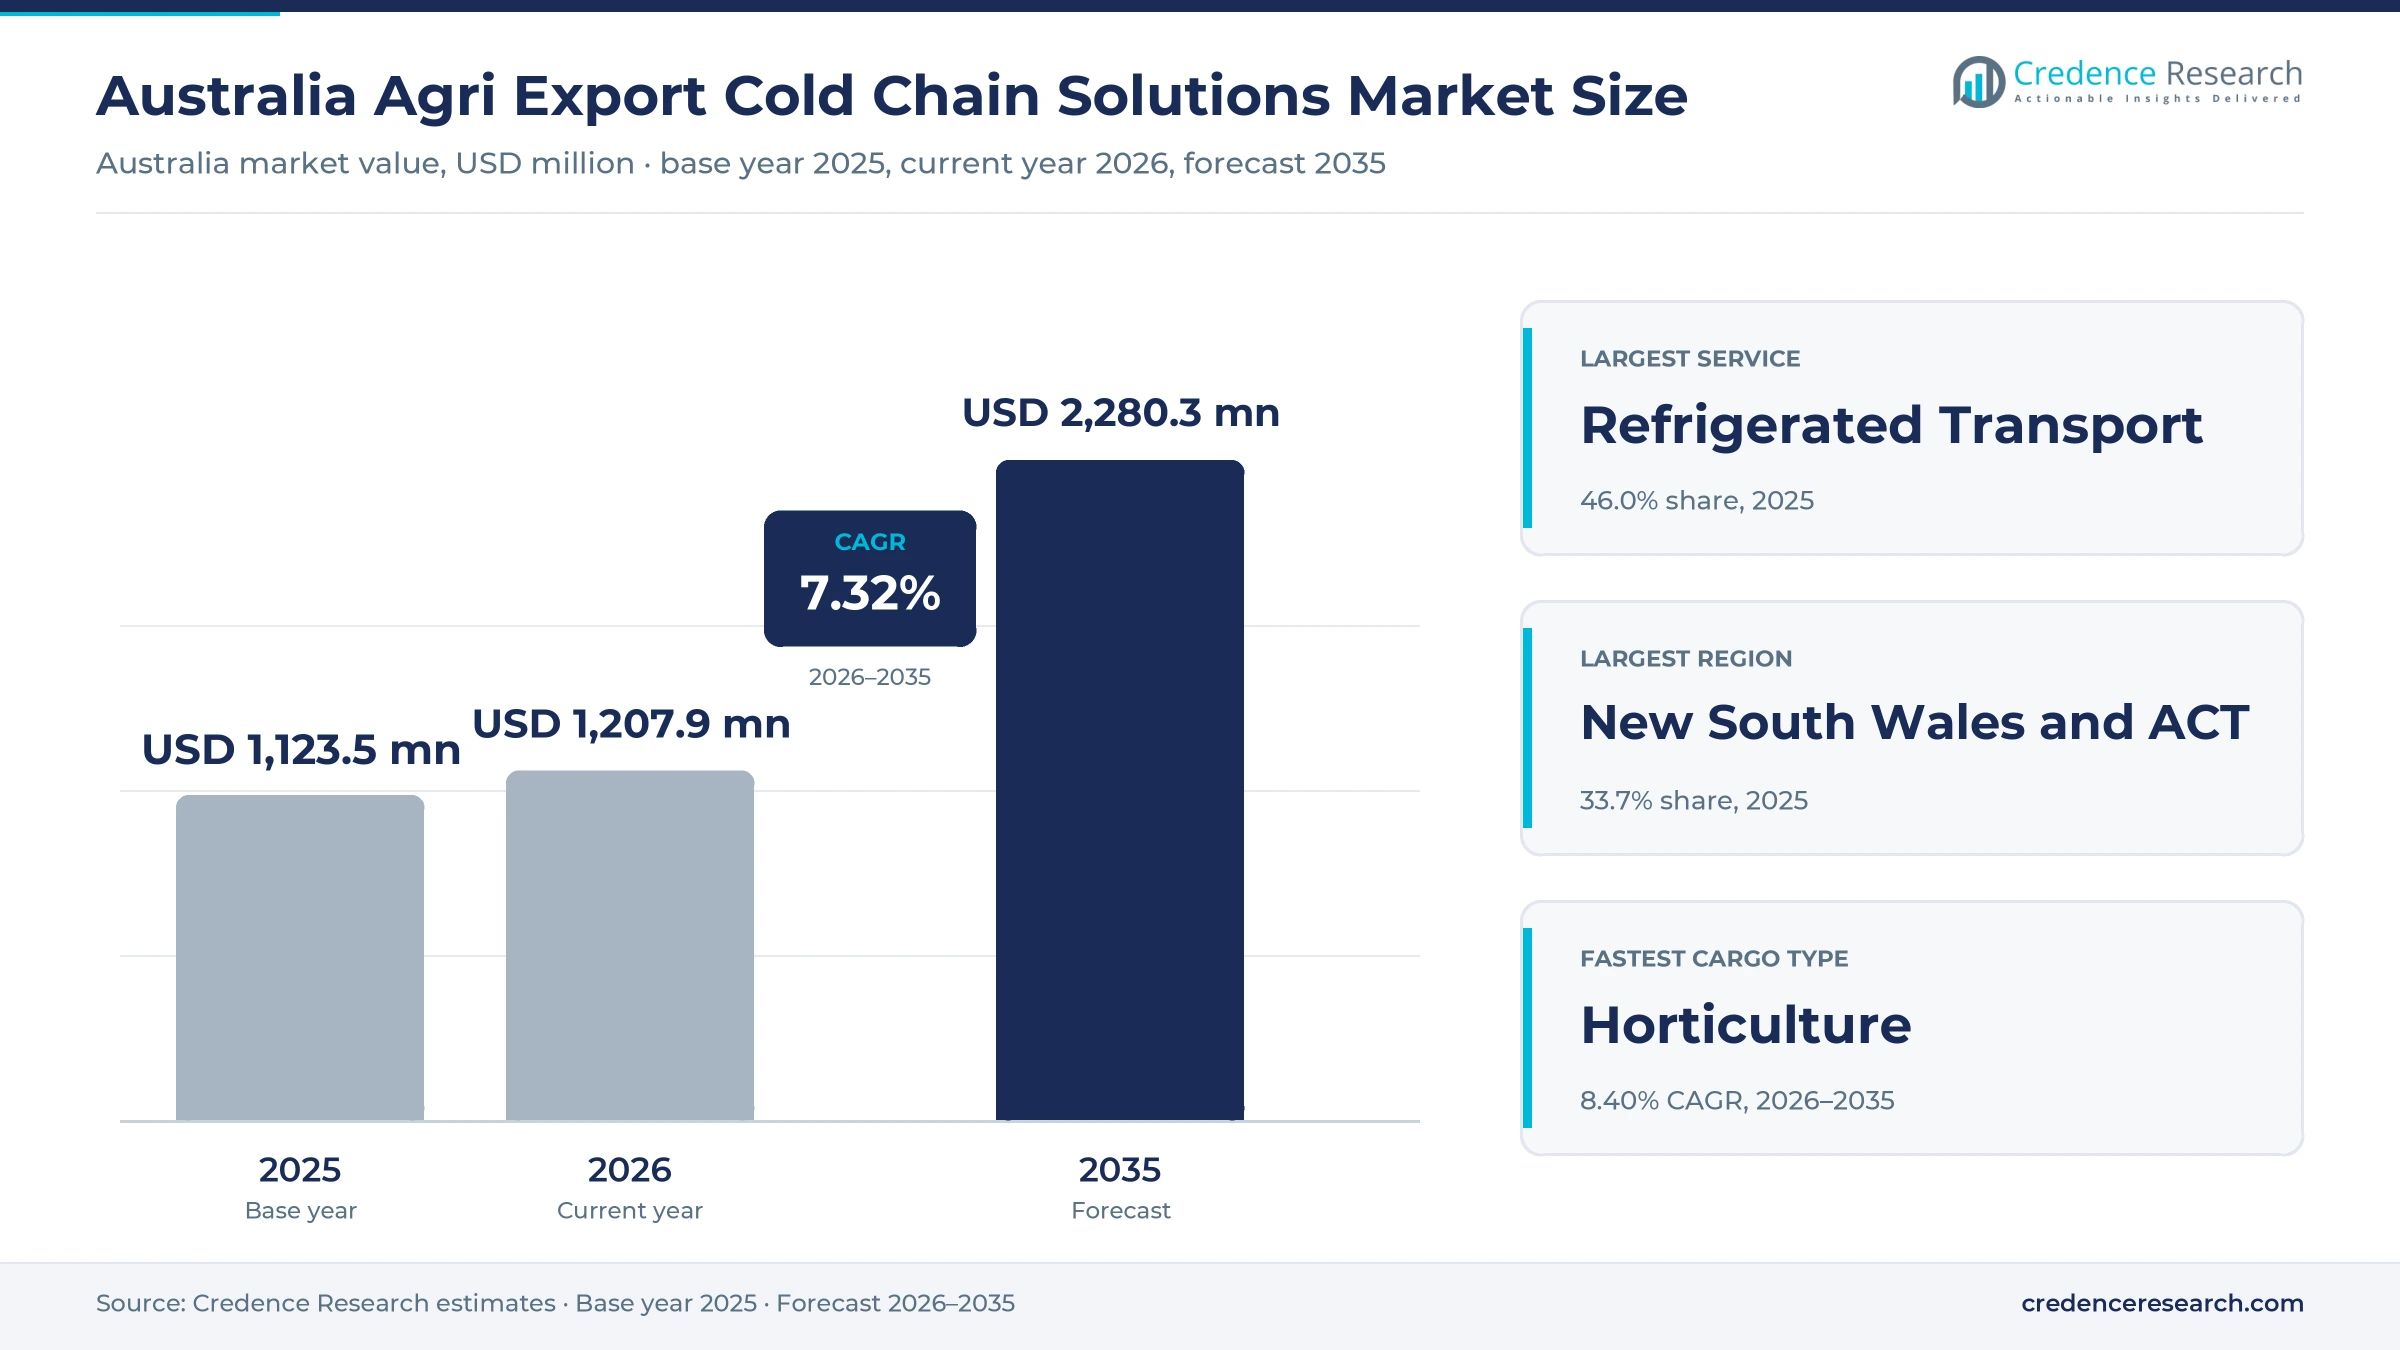
The Australia agri export cold chain solutions market was valued at USD 1.12 billion in 2025 and is projected to increase from USD 1.21 billion in 2026 to USD 2.28 billion by 2035, registering a CAGR of 7.32% during 2026–2035. Demand comes from meat processors, grower groups and merchant exporters that must keep product within temperature limits from plant to wharf or airport. New South Wales and ACT held the largest regional share, 33.7% in 2025, and it is also the fastest-growing region at 7.70% a year, helped by new Western Sydney capacity. Beef Central counted a record 1,545,759 metric tons of beef exports in 2025, which kept reefer and storage networks busy across the eastern states. ABARES expects export values to soften in 2026-27 after that peak, so providers are looking beyond volume toward treatment, documentation and consolidation work. Western Sydney International began cargo flights in July 2026, adding a second major air option for chilled meat and seafood from the state.
What does an agri export cold chain contract actually cover in Australia?
The agri export cold chain solutions market counts fees paid in Australia for moving, staging and preparing chilled and frozen farm, meat, dairy and seafood cargo for export. This covers refrigerated road, rail and airport linehaul, export-registered storage, blast freezing, container packing, pre-trip container checks, inspection support and documentation handling, bought through dedicated, shared-user or spot contracts.
Ocean and international air freight charges, the value of the goods themselves, domestic retail distribution and pharmaceutical logistics fall outside the estimate. The value chain runs from the abattoir, dairy plant or packhouse through a cold store or consolidation hub to the container terminal or airport cargo shed, where the exporter hands over custody.
Australia Agri Export Cold Chain Solutions Market Insights
- The market moves from USD 1.12 billion in 2025 to USD 2.28 billion by 2035, a 7.32% annual pace built on service depth as much as on cargo volume.
- New South Wales and ACT held 33.7% of 2025 value, supported by Port Botany reefer services and the opening of the Western Sydney International cargo precinct in July 2026.
- Meat and Poultry accounted for 60.0% of 2025 value, reflecting record 2025 beef shipments to the United States of 453,305 metric tons reported by Beef Central.
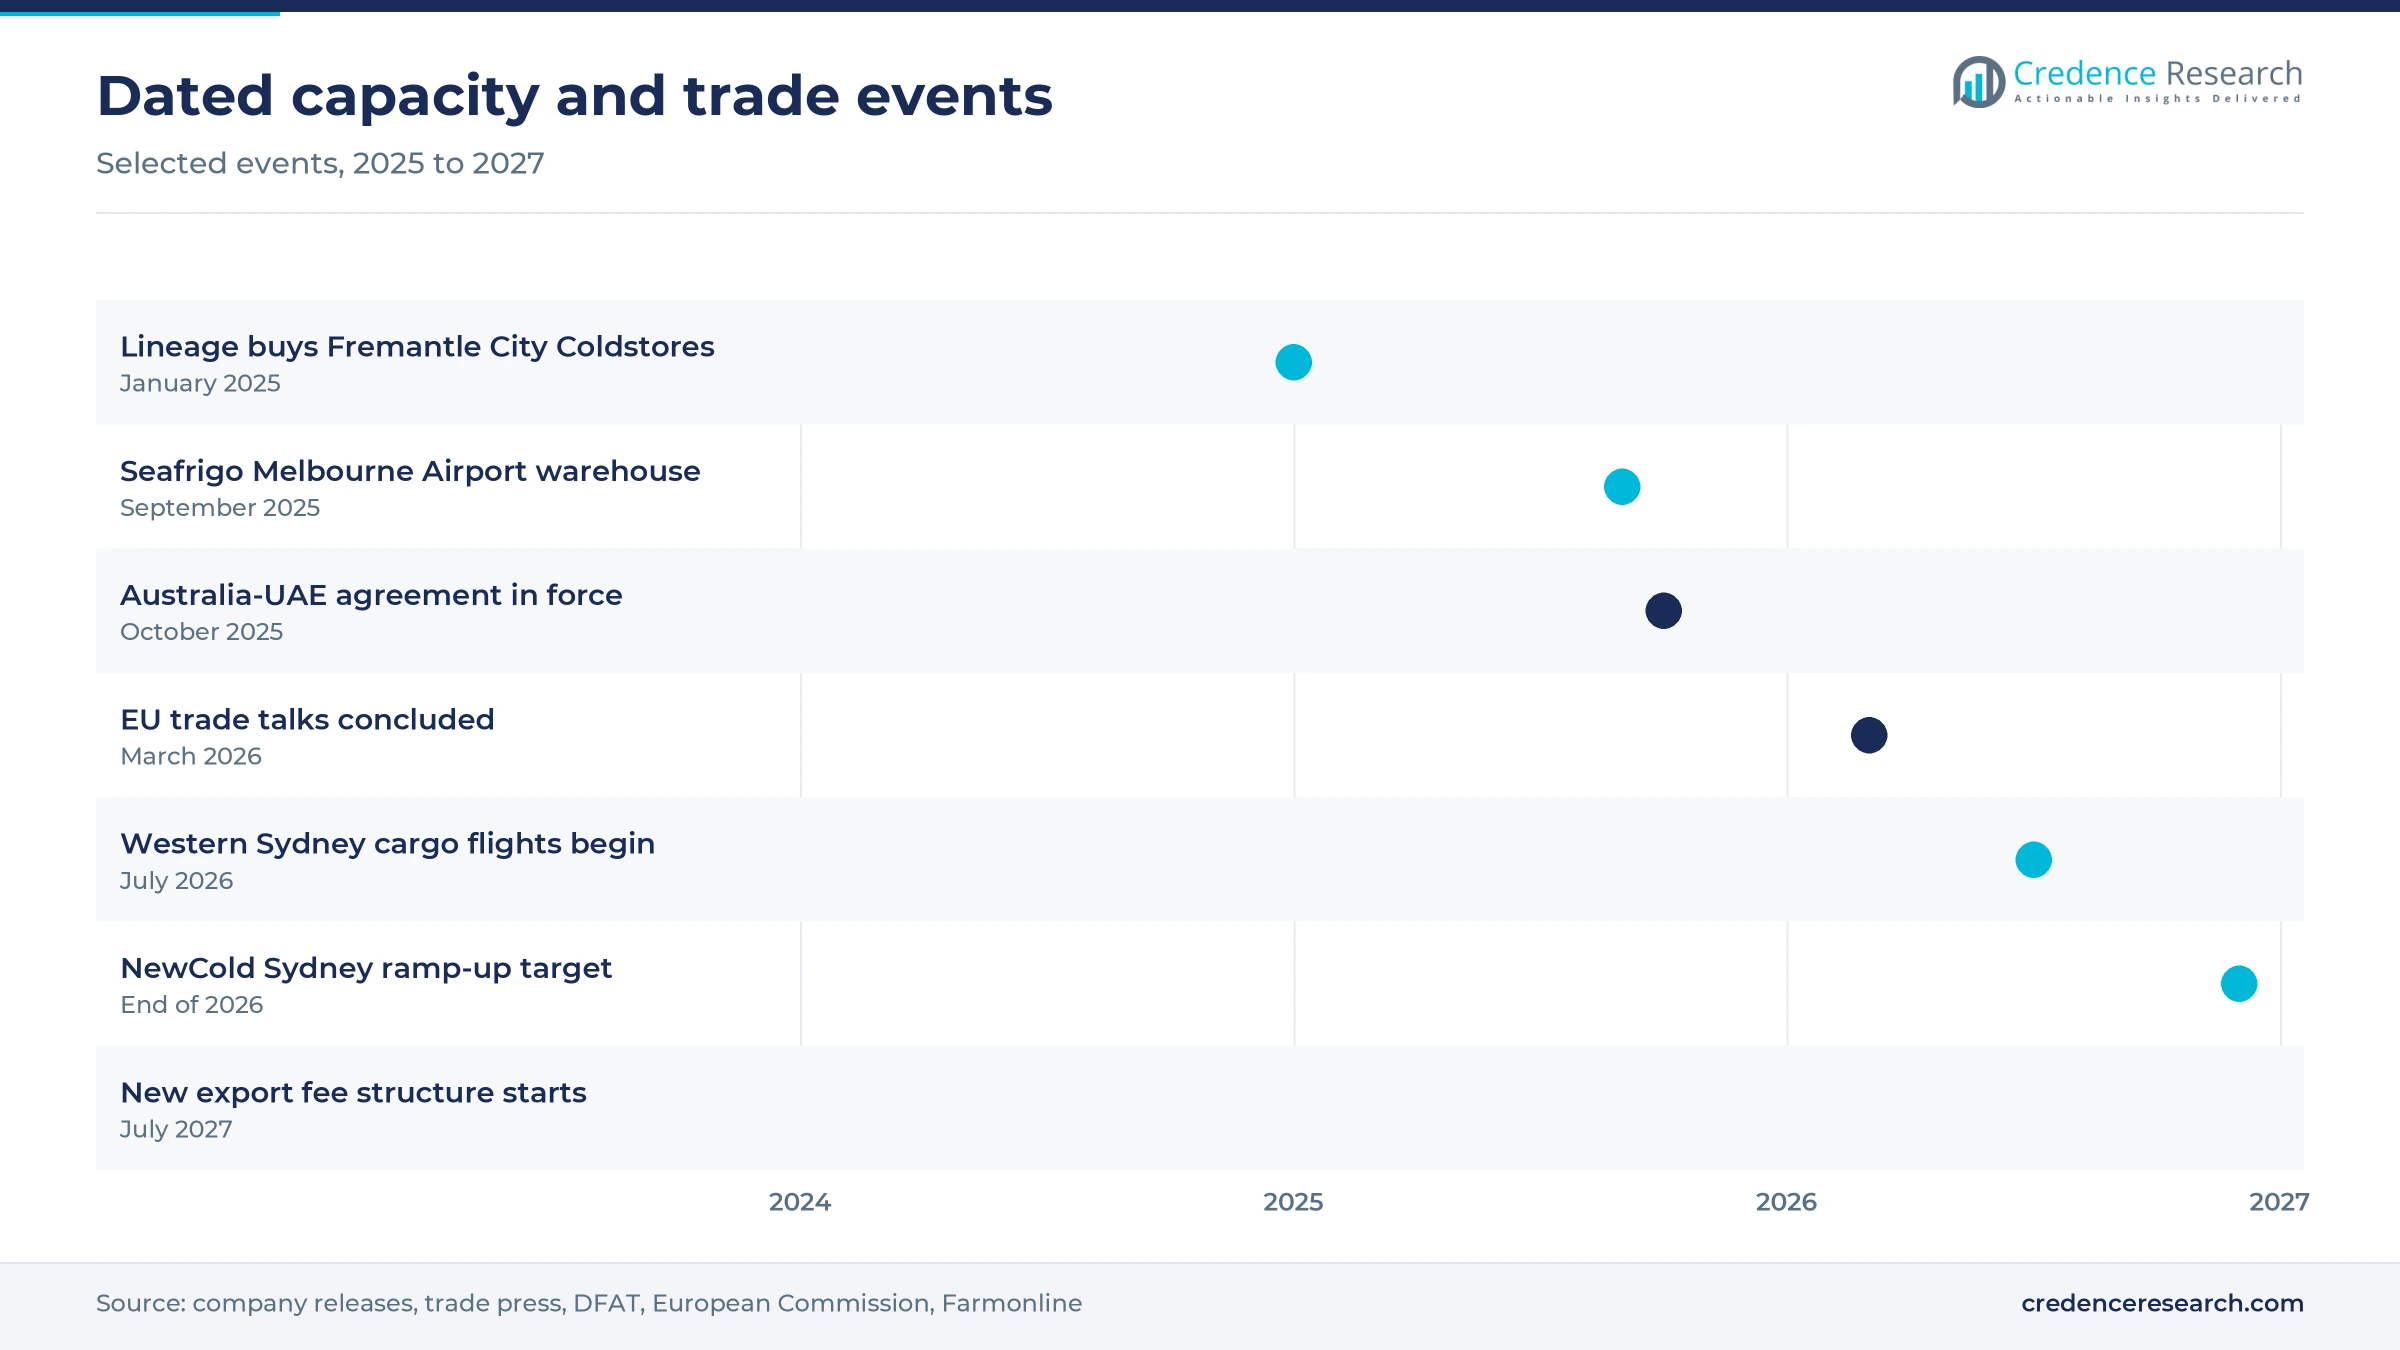
- Automation is resetting storage economics, with NewCold operating over 327,800 Melbourne pallet positions and preparing a 100,000-pallet Sydney site for ramp-up by the end of 2026.
- Scale operators and port specialists compete on compliance-ready capacity, with export charges due to rise from July 2027 and registered sites facing new regulatory cost lines.
Refrigerated transport and meat cargo set the revenue base
Why does refrigerated transport still earn the largest service share?
Based on service type, the market is categorized into Refrigerated Transport, Export Staging Storage and Export Handling and Compliance. Refrigerated Transport led with 46.0% of 2025 value because every export pallet needs at least one temperature-controlled move, and Beef Central recorded beef exports above 1.5 million metric tons in 2025. Export Handling and Compliance grows fastest at 7.98% a year as regulatory work deepens, with Farmonline reporting the horticulture protocol charge rising from A$2.56 to A$4.56 per metric ton. Export Staging Storage gains from the NewCold Sydney project, which Refindustry reported as nearing ramp-up on Feb. 18, 2026.
How do road, rail and air chains divide export cargo?
Based on mode of transport, the market is categorized into Road-led Chains, Rail-linked Chains and Air Gateway Chains. Road-led Chains led with 68.0% of 2025 value because road connects regional plants with five main ports, and FreshPlaza described Lineage sites along the Hume, Pacific, Western, Eyre and Stuart highways in April 2026. Air Gateway Chains grow fastest at 8.09% a year as Western Sydney International opened with capacity of about 250,000 metric tons annually in July 2026. Rail-linked Chains hold a focused role through three weekly Seaway trains between Mildura and the Port of Melbourne.
Which shipment flow adds the most handling value?
Based on shipment flow, the market is categorized into Direct Export Dispatch, Consolidated Export Staging and Treatment-led Export Dispatch. Consolidated Export Staging led with 48.0% of 2025 value because exporters pool part-loads near ports, and FreshPlaza reported Lineage offering multivendor consolidation around 295,000 Victorian pallet positions in April 2026. Treatment-led Export Dispatch grows fastest at 8.16% a year as protocol markets need certified steps, with Seaway packing cold-treatment containers at Mildura. Direct Export Dispatch suits daily air loads, including fresh produce sent by the Freshmax team at Epping through Melbourne Airport.
Why does meat dominate while horticulture grows faster?
Based on end-use industry, the market is categorized into Meat and Poultry, Horticulture, Dairy and Seafood and Aquaculture. Meat and Poultry led with 60.0% of 2025 value because ABARES estimates that 75% of beef and 80% of lamb and mutton output is exported, although only 6% of pigs and poultry output is. Horticulture grows fastest at 8.40% a year as Hort Innovation reported exports of A$3.5 billion in 2024/25, up 13%, and targets A$7 billion by 2031. Dairy Australia recorded about 714,000 metric tons of dairy exports in 2024-25, a steady base for reefer and freezer services.
| Segment Group | Leading Sub-segment | Share, 2025 | Fastest-growing Sub-segment | CAGR, 2026–2035 |
|---|---|---|---|---|
| By Service Type | Refrigerated Transport | 46.0% | Export Handling and Compliance | 7.98% |
| By Mode of Transport | Road-led Chains | 68.0% | Air Gateway Chains | 8.09% |
| By Shipment Flow | Consolidated Export Staging | 48.0% | Treatment-led Export Dispatch | 8.16% |
| By End-Use Industry | Meat and Poultry | 60.0% | Horticulture | 8.40% |
Request a Free Sample
Fill in your details and we'll send you a free sample report.
- Sample data tables & charts
- Research methodology
Trade access and automated capacity lift export services
Export access diversification spreads cargo across more lanes
More destinations mean more temperature profiles, label sets and consolidation runs for each exporter, which lifts demand for services per metric ton. The Department of Foreign Affairs and Trade states that the Australia-UAE agreement took effect Oct. 1, 2025, removing tariffs on frozen beef, sheep meat and dairy products. The European Commission factsheet on the deal concluded March 24, 2026, sets beef quotas of 30,600 metric tons and sheep and goat quotas of 25,000 metric tons, although these still await ratification. Argus reported UAE beef shipments of 14,375 metric tons carcass weight in 2025, up 35%, a sign of demand beyond traditional lanes. Beef Central also recorded Canadian volumes of 52,796 metric tons, the highest since 2002, showing that lanes beyond the traditional North Asian buyers already matter.
Automated gateway capacity expansion resets storage supply
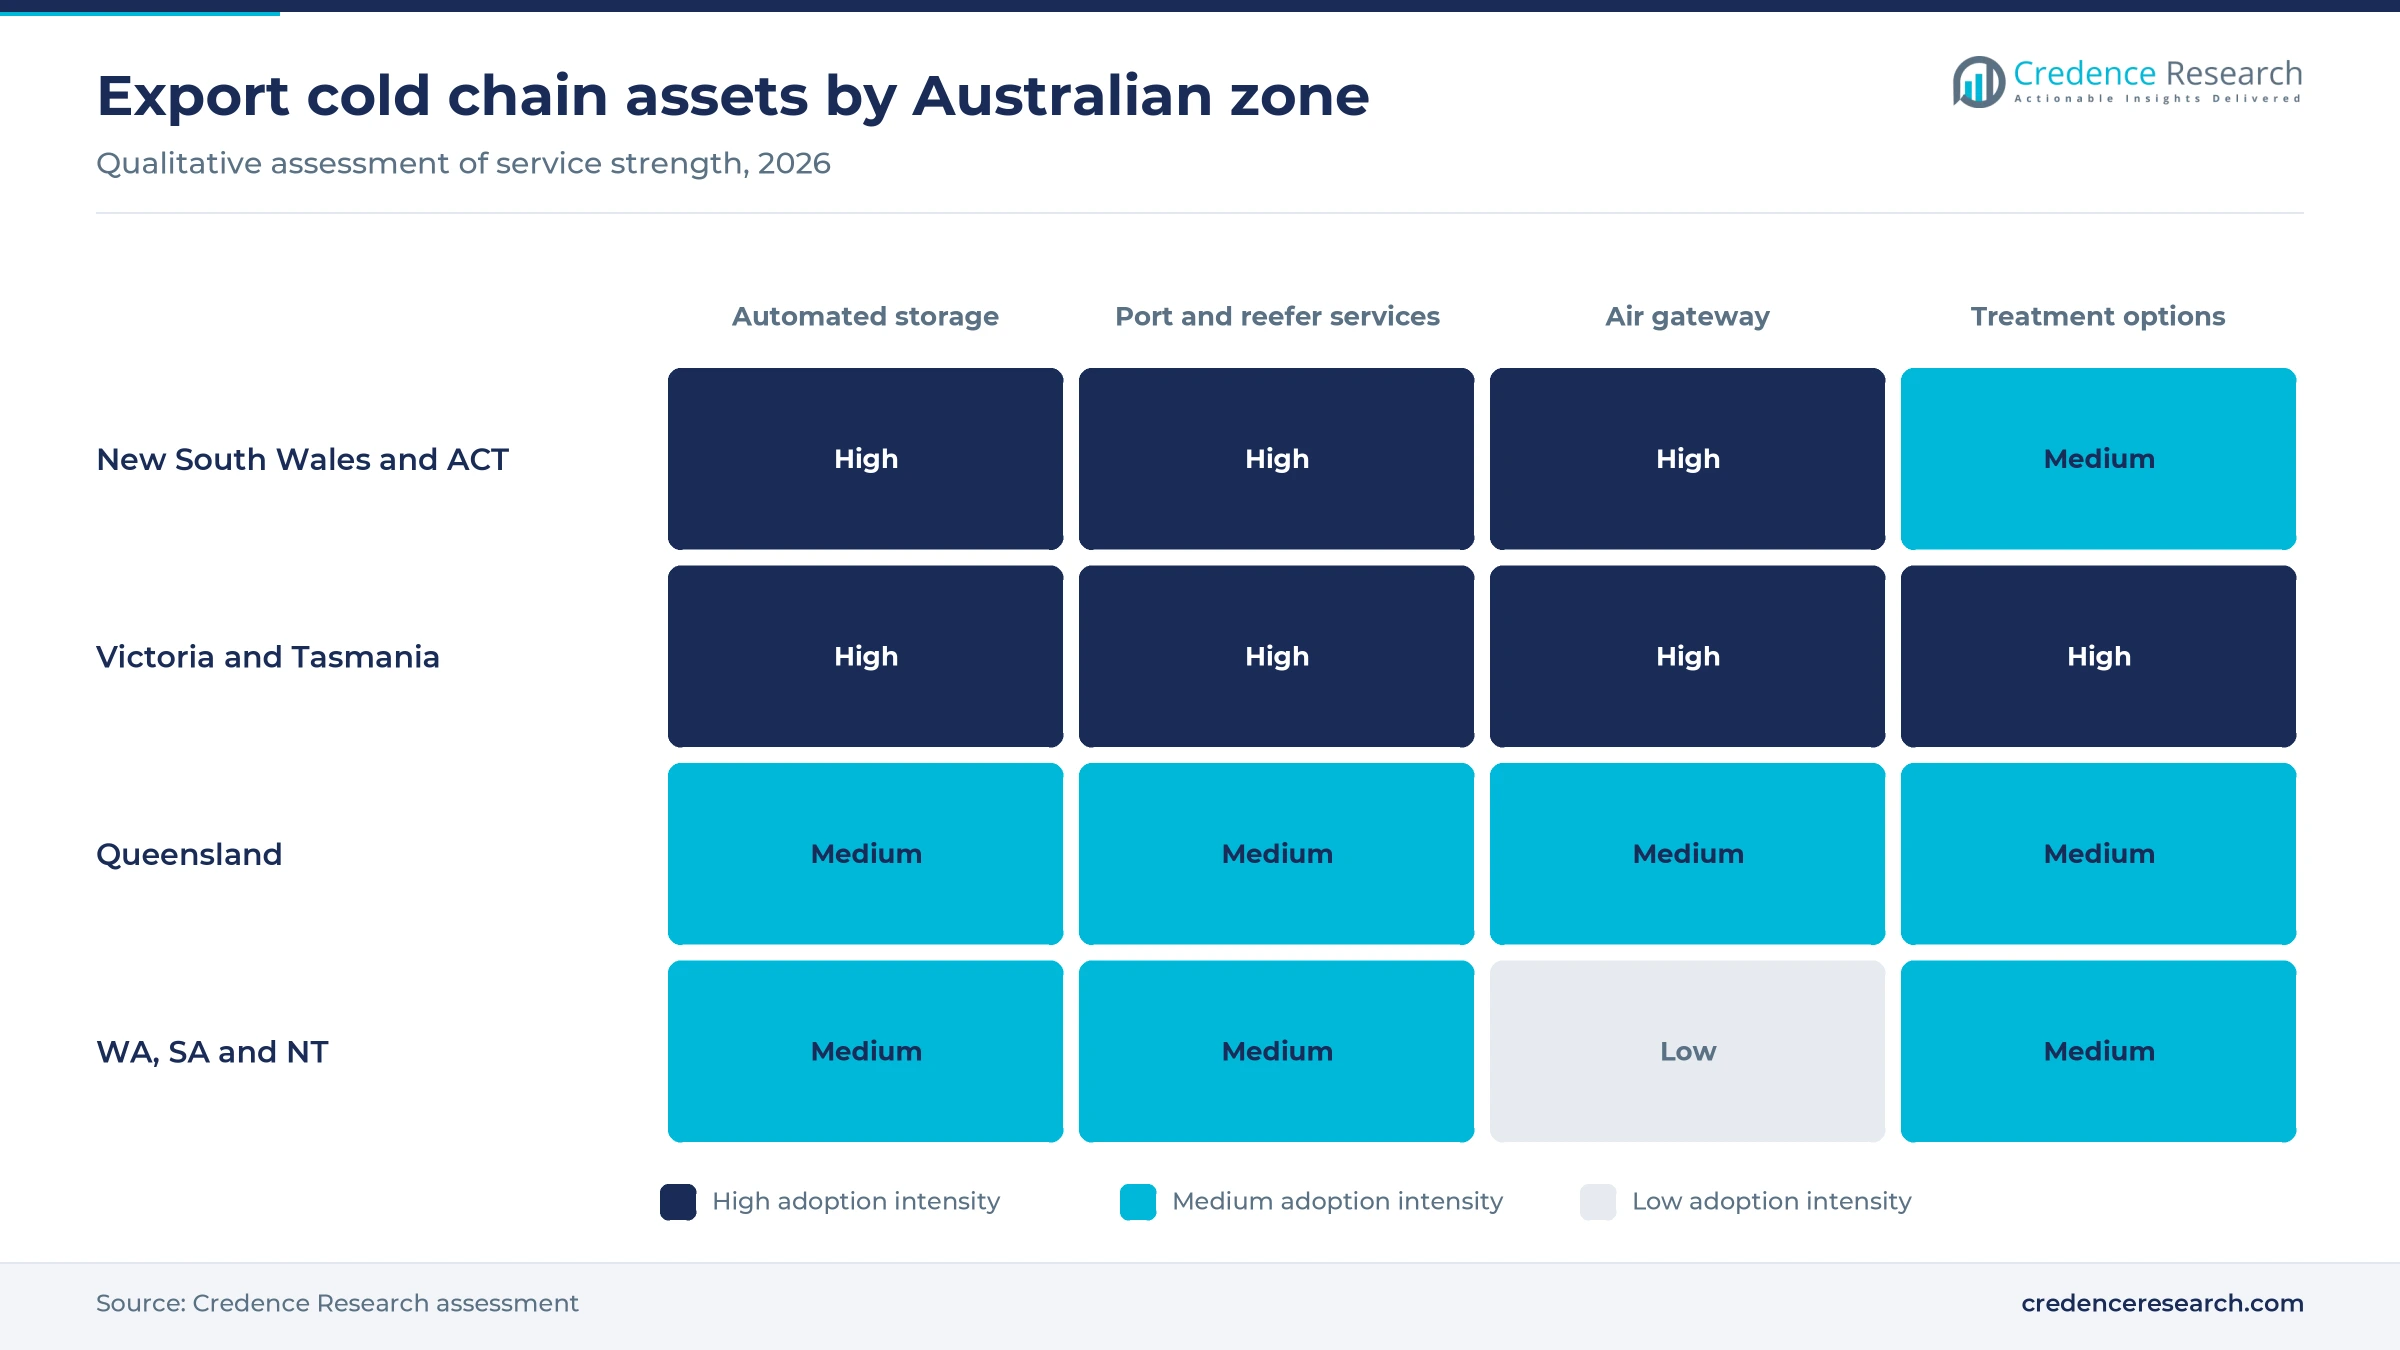
High-bay automated stores near ports let exporters hold more pallets on less land and stage containers closer to vessel cutoffs. Austrade reports that NewCold has grown from a first Truganina warehouse opened in 2017 to two Melbourne sites with more than 327,800 pallets, including a building about 43 meters tall. Refindustry reported on Feb. 18, 2026, that its 100,000-pallet Sydney site was on track to begin ramp-up by the end of 2026. Food Processing described an Americold building at Spearwood, Western Australia, as a 48-meter, A$65 million automated facility. FreshPlaza listed Lineage at more than 500,000 pallet positions across over 20 facilities in April 2026. Together these projects give Consolidated Export Staging providers a larger, more automated base.
Export compliance service intensity raises handling value
Compliance work is becoming a paid service line because exporters now face higher regulatory charges and more certified steps before cargo can leave. Farmonline reported that annual export fees will rise from A$152 million to A$209 million as full cost recovery moves toward industry by 2029-30. The same report shows electronic dairy export document fees rising from A$42 to A$108. Providers are investing to meet this workload, with AJOT reporting fumigation chambers and an enclosed dock system at the 10,000-square-meter Seafrigo site at Melbourne Airport in September 2025. DP World said its Reefer World site at Port Botany can pre-trip and wash more than 100 refrigerated containers a day, which keeps equipment ready for inspected loads.
Record protein and fruit volumes keep networks utilized
Sustained cargo volume remains the base of the market because storage and linehaul contracts follow the seasonal kill and harvest. Beef Central reported on Jan. 7, 2026, that beef exports reached 1,545,759 metric tons in 2025, with the United States taking a record 453,305 metric tons and South Korea a record 221,350 metric tons. Meat & Livestock Australia reported 363,109 metric tons of lamb and a record 256,104 metric tons of mutton shipped in the year to June 2025. Export demand stayed strong overall, as Bendigo Bank put 2024-25 agricultural exports at A$77.2 billion, the second-highest year on record. These flows explain why Meat and Poultry holds 60.0% of market value, while refrigerated transport fleets stay committed through peak season.
Air gateways and treatment corridors reshape service design
Shift toward airport-based chilled export hubs
Airport cold capacity is moving from small sheds to purpose-built export hubs, as premium chilled cargo seeks faster routes to Asia and the Gulf. AJOT reported in September 2025 that Seafrigo, trading as Mode Logistics, opened a Melbourne Airport warehouse about four times its previous size, with about 90% of current business in exports. STAT Times reported that Western Sydney International started cargo flights in July 2026, with fresh meat and seafood named among target cargoes, and long-term capacity of up to 1.8 million metric tons. FreshPlaza, citing government figures, put South Australian air-freight exports at US$231.7 million in the latest year. These moves support air cargo volumes for Air Gateway Chains, which is rising at 8.09% a year.
Rise of lower-diesel refrigeration on export routes
Fuel volatility is pushing operators to separate the refrigeration load from the diesel engine, because reefer units burn fuel around the clock. Australian Roadtrains reported on March 11, 2026, that diesel in Sydney and Melbourne was climbing back toward A$2.20 a liter, with parts of the Northern Territory approaching A$4. The same report described a Protran trailer with a Sunswap solar and battery system completing a Sydney-Brisbane-Sydney trip on solar power alone. Warehouses are following, with Refindustry noting rooftop solar at Fremantle City Coldstores and FreshPlaza reporting that solar panels should offset 35% of annual energy use at the DHL Brisbane airport facility. Exporters that contract these assets reduce their fuel exposure, and they also gain a measurable energy record for buyers.
Opportunity in treatment corridors for protocol fruit
Treatment capacity is an opening because fruit exporters cannot reach many protocol markets without a certified cold or irradiation step. HortiDaily reported in September 2026 that Hort Innovation Strategy 2031 aims for A$7 billion in horticulture exports, roughly double the A$3.5 billion earned in 2024/25. Bendigo Bank recorded horticulture exports of A$194 million to Vietnam in 2024-25, a market that Fruitnet says accepts irradiation for Australian table grapes, along with Indonesia. Fruitnet also places Steritech treatment sites in Melbourne and Brisbane, while FreshPlaza lists 32,000 Lineage pallet positions with cold treatment in South Australia. Operators that combine these steps with staging can capture growth in Treatment-led Export Dispatch, which is rising at 8.16% a year.
Opportunity in regional rail links to container ports
Regional rail offers providers a way to reduce road exposure while keeping reefer cargo tied to fixed vessel windows. Seaway runs three weekly trains from Mildura to the Port of Melbourne with refrigerated containers on rail, plus daily services from Warrnambool, where it holds over 24,000 square meters of warehousing, to the same port. Its Toowoomba terminal moves over 20,000 TEU a year on a daily rail service to the Port of Brisbane. The Department of Infrastructure says Inland Rail construction from Beveridge to Parkes and Narromine is prioritized for 2027, which could open new long-haul paths. DP World also lists on-dock rail at its Port Botany park and a 6,000-TEU container park with reefer monitoring at Melbourne, giving rail-served packhouses a practical route to vessels.
Fees, port charges and diesel squeeze export margins
Rising government charges hit smaller exporters first
Federal cost recovery is the clearest margin risk for the coming years. Farmonline reported that the annual meat export license fee rises from A$345 to A$1,486 from July 2027, while total export costs for seafood and egg exporters rise 77%, and China-registered meat sites face a new monthly charge of A$1,037 to A$1,251 from 2027-28. Grower exporters and smaller storage sites have the least room to absorb these increases. Providers can respond by bundling audit preparation and documents into shared-user contracts, spreading fixed fees across more clients.
Landside port charges remain hard to avoid
Container terminal costs keep rising with limited alternatives for exporters. The Australian Competition and Consumer Commission reported on Dec. 20, 2024, that real stevedoring revenue per lift rose A$72.16 between 2016-17 and 2023-24, and that Sydney empty park notification fees reached A$179.40 per container. The ACCC found that exporters have limited ability to respond to rising charges, so reefer carriers often pass them on. Consolidating movements into fewer, fuller container runs is the main mitigation available to staging operators.
Diesel swings erode reefer contract margins
Refrigerated fleets carry unusual fuel exposure because trucks and reefer units both burn diesel. Australian Roadtrains reported on March 11, 2026, that Australia imports about 90% of its liquid fuel and that remote Northern Territory prices neared A$4 a liter during the Strait of Hormuz disruption. Fixed-price spot contracts suffer most, and long-haul Western Australia, South Australia and Northern Territory lanes face the largest bills. Fuel-linked clauses and solar-assisted trailers reduce this risk over time.
Sudden lane closures strand chilled inventory
Route shocks can quickly turn scheduled chilled loads into storage problems. Meat & Livestock Australia reported on May 7, 2026, that red meat shipments to the Middle East fell about 50% in March compared with February, and April stayed 23% below that level. ABARES also forecasts beef and live cattle exports down 18% to A$16.3 billion in 2026-27, a fall in export value that can tighten storage and linehaul budgets. Providers need flexible staging space and freezer conversion options to absorb these swings.
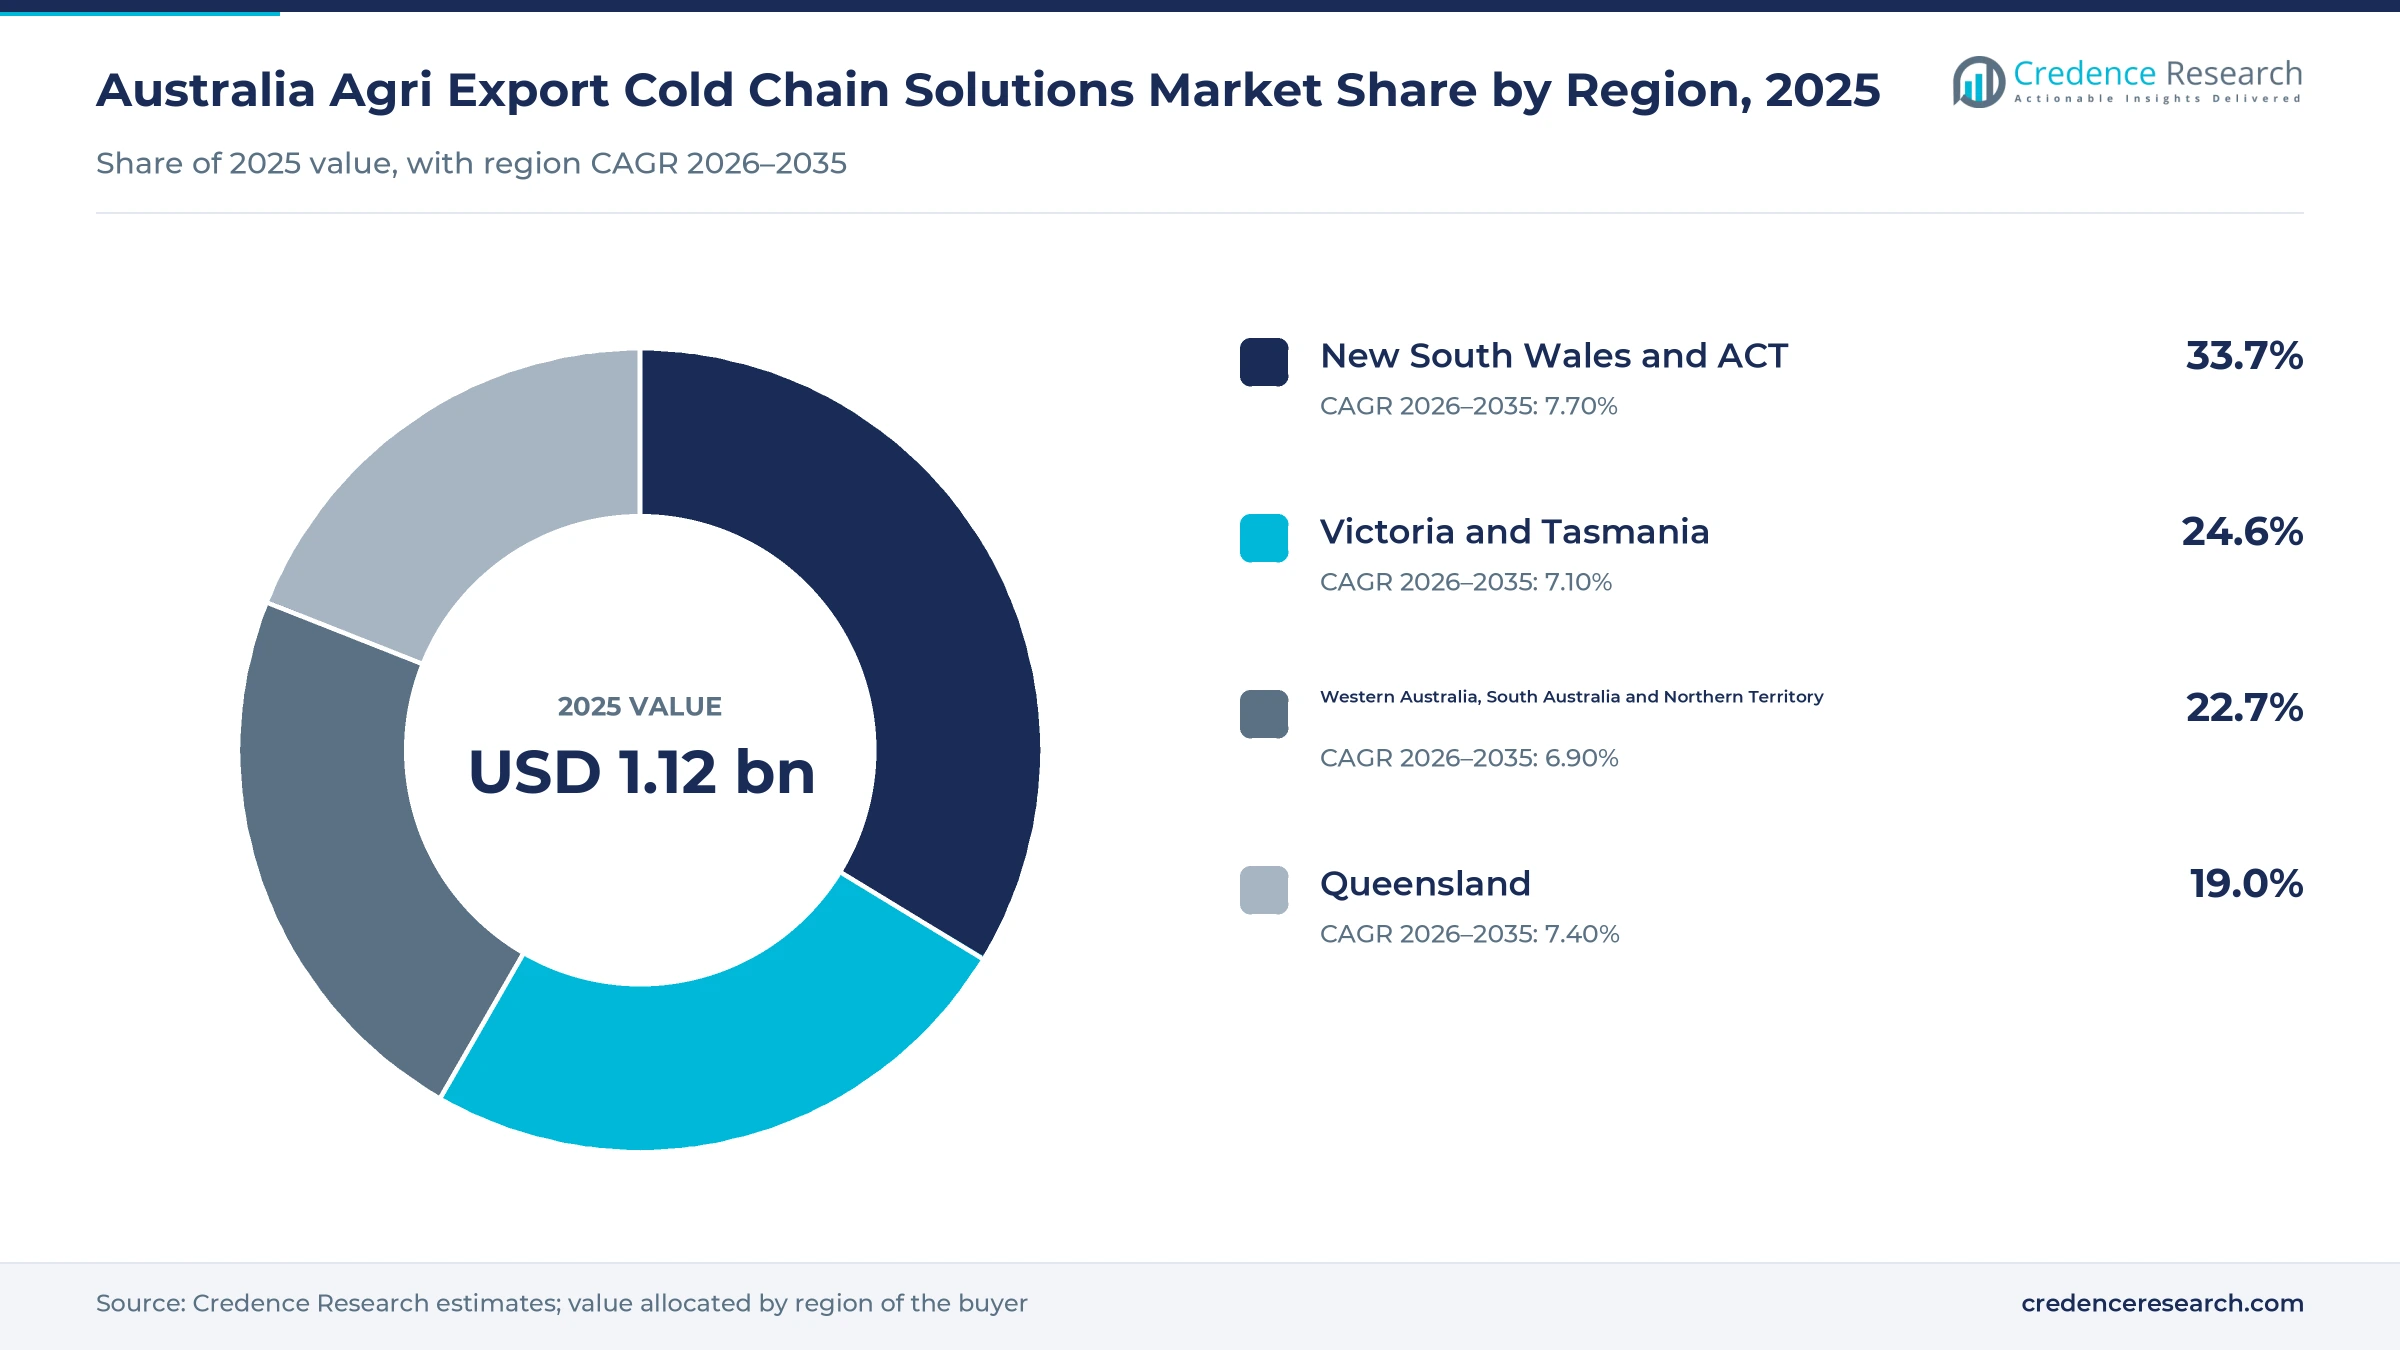
Sydney gateways and Melbourne staging split regional value
| Region | Value, 2025 (USD billion) | Share, 2025 | CAGR, 2026–2035 |
|---|---|---|---|
| New South Wales and ACT | 0.38 | 33.7% | 7.70% |
| Victoria and Tasmania | 0.28 | 24.6% | 7.10% |
| Western Australia, South Australia and Northern Territory | 0.26 | 22.7% | 6.90% |
| Queensland | 0.21 | 19.0% | 7.40% |
New South Wales and ACT lead through Sydney gateway growth
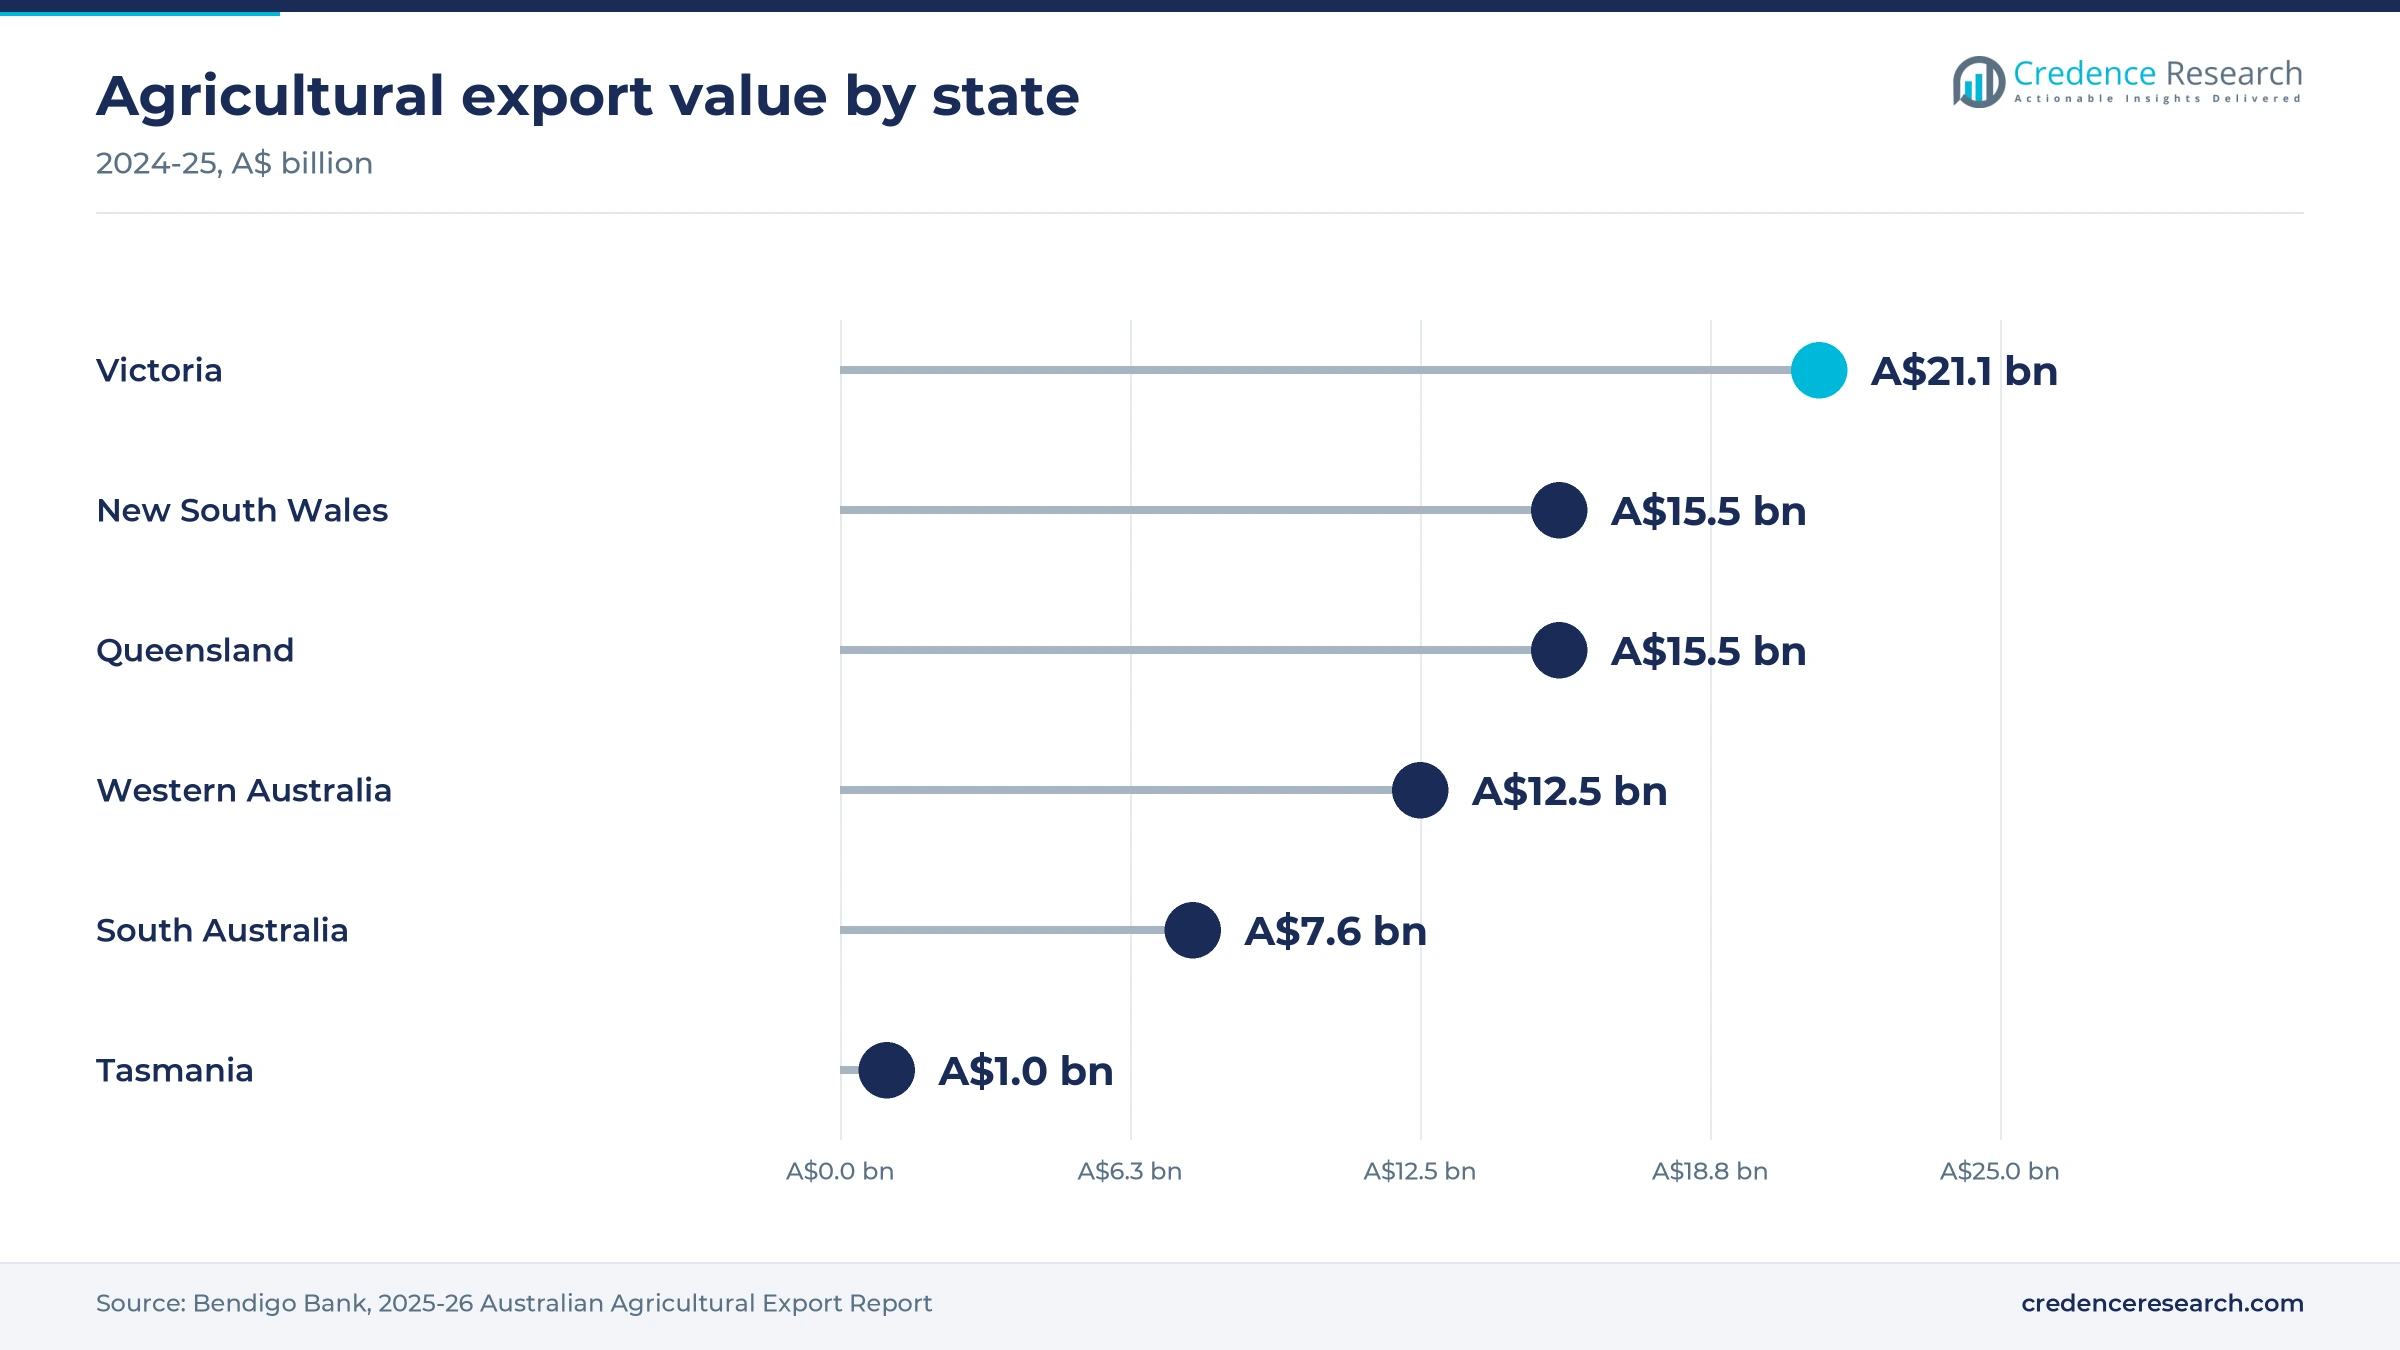
New South Wales and ACT held 33.7% of 2025 value and grow at 7.70% a year, the fastest rate of the four regions. Bendigo Bank reported record New South Wales agricultural exports of A$15.5 billion in 2024-25, up 25%, the largest dollar rise of any region. Service demand also concentrates around Port Botany, where DP World Reefer World handles reefer preparation, and around Western Sydney, where NewCold and the new airport cargo precinct are adding automated storage and freighter capacity for meat and seafood.
Victoria and Tasmania anchor dairy and port-side staging
Victoria and Tasmania held 24.6% of 2025 value and grow at 7.10% a year. Victoria posted the largest regional export value, A$21.1 billion in 2024-25, according to Bendigo Bank, while Dairy Australia shows the two states producing 74.1% of national milk. FreshPlaza listed over 295,000 Lineage pallet positions near the Port of Melbourne, and Laverton Cold Storage, established in 1975, serves import and export clients with blast freezing. These assets support a large container staging base, although the Credence Research regional model places the zone second to New South Wales and ACT despite its larger export value.
Western Australia, South Australia and Northern Territory rely on long haul
Western Australia, South Australia and Northern Territory held 22.7% of 2025 value and grow at 6.90% a year. Bendigo Bank put Western Australian exports at A$12.5 billion and South Australian exports at A$7.6 billion in 2024-25, both lower than a year earlier. Lineage added Fremantle City Coldstores in January 2025, with six blast cells for meat and seafood clients, and the Americold Spearwood site adds automated height. Northern Territory exports rose 44.4%, although long distances raise regional linehaul cost.
Queensland builds on cattle cargo and Brisbane links
Queensland held 19.0% of 2025 value and grows at 7.40% a year. Bendigo Bank reported state exports of A$15.5 billion in 2024-25, with the cattle sector making up 59% of that value, which ties regional cold logistics closely to the beef cycle. Food Processing reported Americold capacity above 70,000 pallets in the state after buying a site at Ormeau, and DHL Global Forwarding built a 1,700-square-meter cold section at Brisbane Airport. Seaway rail from Toowoomba adds an inland container option for exporters.
Dated capacity and trade moves from 2025 to 2026
| Development | Status and market relevance |
|---|---|
| In January 2025, Lineage acquired Fremantle City Coldstores near Fremantle Port, adding more than 8,000 pallet positions and six blast cells. | Completed; it strengthens meat and seafood handling in Western Australia. |
| In September 2025, Seafrigo, trading as Mode Logistics, opened a 10,000-square-meter cold chain warehouse at Melbourne Airport. | Operating; about 90% of the business is export cargo. |
| In October 2025, the Australia-UAE trade agreement entered into force, removing tariffs on frozen beef, sheep meat and dairy. | In force; it supports premium Gulf lanes that were later disrupted by the 2026 conflict. |
| In March 2026, the European Union and Australia concluded trade talks with new beef and sheep meat quotas. | Awaiting ratification; volumes phase in after entry into force. |
| In July 2026, Western Sydney International started cargo flights from its 24-hour precinct. | Operating; initial capacity is about 250,000 metric tons a year. |
Automation and lower-diesel refrigeration change costs
- Automated high-bay stores reduce land use and labor at gateway sites, and Austrade reports that NewCold sites are generally at least 50% more energy efficient than traditional warehousing.
- Blast freezing cells bring meat and seafood to export temperature quickly, and Refindustry counted six cells at Fremantle City Coldstores when Lineage bought it in January 2025.
- Solar-assisted reefer trailers reduce diesel use on linehaul, and operators can pair them with telematics to document the temperature record of each load.
- Lower-impact refrigerants are gaining attention because HVACR News reported a total 2026-27 import quota of 4.25 million carbon dioxide equivalent metric tons for hydrofluorocarbons.
Need a Custom Version of This Report?
Tailor the scope, geography, or segments to your exact requirements.
- Custom geography or segment scope
- Direct access to our analyst team
Global warehouse groups meet port and freight specialists
Competition in agri export cold chain solutions splits between global temperature-controlled warehouse groups, port operators and specialist freight firms. Lineage and Americold compete on national coverage, with FreshPlaza listing more than 20 Lineage facilities and Food Processing reporting 14 Americold sites across five states in 2023. NewCold competes on automation and scale, serving large single sites rather than a dense network. DP World links reefer preparation and monitoring directly to its terminals, which gives shippers a close tie between equipment and vessel. Seaway Intermodal competes through regional rail terminals and export packing at Mildura and Toowoomba, and Laverton Cold Storage offers a family-owned Melbourne alternative. Freshmax Australia runs its own air export team for produce, while Wiseway Logistics lists perishables among its air and sea freight services. Contract wins usually turn on export registration, port proximity and blast capacity rather than storage price alone, particularly for meat processing clients.
Companies profiled and their roles in this market
| Company | Type | Role in the market |
|---|---|---|
| Lineage | Cold storage network | Staging, blast freezing and cold treatment near five ports, over 500,000 pallet positions |
| NewCold | Automated warehouse operator | Two high-bay Melbourne sites and a Sydney project of 100,000 pallets |
| Americold | Cold storage network | Blast freeze and meat export services in Queensland and Western Australia |
| DP World | Port and logistics operator | Reefer World pre-trip services at Port Botany and reefer monitoring at Melbourne |
| Seaway Intermodal | Intermodal and freight provider | Reefer rail from Mildura, cold-treatment packing and export terminals |
| Laverton Cold Storage | Family-owned storage provider | Blast freezing and storage for import and export clients in Melbourne |
| Freshmax Australia | Produce marketer and exporter | Daily air export loads of fruit, vegetables and herbs through Melbourne Airport |
| Wiseway Logistics | Freight forwarder | Air and sea cargo services that include a perishables line |
Compliance-ready capacity will decide contract wins
Credence Research's view is that in agri export cold chain solutions, compliance-ready capacity, rather than raw pallet count, will decide who wins export contracts over the next decade. New automated space is arriving in Sydney and Melbourne just as ABARES expects softer export values in 2026-27, so storage pricing could tighten for operators without treatment or documentation capability. Federal fee changes from July 2027 favor providers able to spread those costs across shared-user clients. Buyers should test whether a provider can show export registration, reefer plug access and contingency freezer space before signing multi-year capacity deals.
How the export logistics estimates were built
The agri export cold chain solutions estimates use 2025 as the base year and 2026 to 2035 as the forecast period. Market values come from the Credence Research model, and regional and segment splits are Credence Research estimates informed by public data. Source types used include government and statistical publications, trade agreement documents, company announcements and trade press. No interviews or surveys were conducted in preparing this report.
Protocol fruit and air cargo add growth through 2035
The market should reach USD 2.28 billion by 2035, rising at 7.32% a year from USD 1.21 billion in 2026. Early years may look uneven because ABARES forecasts lower beef values in 2026-27 and the European Union quotas still await ratification. Later growth in agri export cold chain solutions depends on delivery of the Hort Innovation 2031 goal, the full use of Western Sydney cargo space and steady meat demand from North Asia and the United States. Operators combining staging, treatment and rail or air access should capture the most value.
Frequently Asked Questions
How big is the Australia agri export cold chain solutions market?
Which region leads the market?
Which end-use industry holds the largest share?
Which service type is growing fastest?
How is air cargo changing the market?
Which trade agreements matter most for exporters?
What is the largest challenge for service providers?
Which companies are active in the market?
Table of Content
Chapter 1 Market Segmentation
- 1.1 Segmentation Framework
- 1.1.1 Product and Service Classification
- 1.1.2 Application and End-Use Classification
- 1.1.3 Technology and Solution Classification
- 1.1.4 Customer and Distribution Channel Classification
- 1.1.5 Geographic Segmentation
- 1.1.6 Market Segment Definitions and Boundaries
- 1.2 By Service Type
- 1.2.1 Refrigerated Transport
- 1.2.2 Export Staging Storage
- 1.2.3 Export Handling and Compliance
- 1.3 By Mode of Transport
- 1.3.1 Road-led Chains
- 1.3.2 Rail-linked Chains
- 1.3.3 Air Gateway Chains
- 1.4 By Shipment Flow
- 1.4.1 Consolidated Export Staging
- 1.4.2 Direct Export Dispatch
- 1.4.3 Treatment-led Export Dispatch
- 1.5 By End-Use Industry
- 1.5.1 Meat and Poultry
- 1.5.2 Horticulture
- 1.5.3 Dairy
- 1.5.4 Seafood and Aquaculture
Chapter 2 Introduction
- 2.1 Report Objectives and Scope
- 2.2 Product Definition and Industry Terminology
- 2.3 Market Inclusions and Exclusions
- 2.4 Research Process
- 2.4.1 Primary Research and Expert Interviews
- 2.4.2 Secondary Research and Source Review
- 2.4.3 Top-Down and Bottom-Up Estimation
- 2.4.4 Data Triangulation and Verification
- 2.5 Market Size Measurement Basis
- 2.5.1 2025: USD 1.12 billion → 2035: USD 2.28 billion
- 2.6 Historical and Forecast Reference Periods
- 2.6.1 Historical Period: 2018-2025
- 2.6.2 Base Year: 2025
- 2.6.3 Forecast Period: 2025-2035
- 2.7 Research Assumptions and Limitations
Chapter 3 Executive Summary
- 3.1 Market Snapshot and Key Findings
- 3.2 Base-Year Market Size, 2025
- 3.3 Forecast Market Size, 2035
- 3.4 Revenue and Volume Growth Outlook
- 3.5 Key Demand and Supply Indicators
- 3.6 Leading Market Segments
- 3.7 Fastest-Growing Market Opportunities
- 3.8 Regional Performance Highlights
- 3.9 Technology and Industry Transformation
- 3.10 Competitive Landscape Summary
- 3.11 Analyst View and Strategic Implications
Chapter 4 Australia Agri Export Cold Chain Solutions Market Trends and Developments
- 4.1 Historical Industry Development, 2018-2025
- 4.2 Recent Market Trends and Developments
- 4.3 Demand and Customer Behavior Trends
- 4.4 Technology and Product Innovation
- 4.5 Artificial Intelligence, Automation and Digitalization
- 4.6 Local Manufacturing and Supply Chain Realignment
- 4.7 Industry Partnerships, Mergers and Acquisitions
- 4.8 Sustainability and Circular Economy Developments
- 4.9 Government and Private Sector Investment Trends
- 4.10 Emerging Business Models and Commercialization
- 4.11 Industry Developments and Announcements
Chapter 5 Australia Agri Export Cold Chain Solutions Market Production, Supply and Demand Analysis
- 5.1 Demand Trend and Consumption Analysis, 2018-2025
- 5.2 Demand Forecast, 2025-2035
- 5.3 Production and Output Trend, 2018-2025
- 5.4 Production and Output Forecast, 2025-2035
- 5.5 Installed Capacity and Capacity Utilization
- 5.6 Company-Wise Production Plants and Statistics
- 5.6.1 Installed Production Capacity
- 5.6.2 Actual Production
- 5.6.3 Planned Capacity and Expansion Targets
- 5.7 Supply Chain Structure and Procurement Trends
- 5.8 Supply-Demand Gap and Bottlenecks
- 5.9 Import Dependence and Sourcing Structure
- 5.10 Contract Manufacturing and Outsourcing
- 5.11 Regional Supply and Demand Concentration
Chapter 6 Australia Agri Export Cold Chain Solutions Market Pricing Analysis
- 6.1 Pricing Structure and Measurement
- 6.2 Historical Pricing Trends, 2018-2025
- 6.3 Pricing Outlook, 2025-2035
- 6.4 Average Selling Price and Unit Economics
- 6.5 Pricing by Product and Market Segment
- 6.6 Geographic Pricing Differences
- 6.7 Key Input, Energy, Labor and Logistics Costs
- 6.8 Contract Pricing and Purchasing Models
- 6.9 Pricing Sensitivity and Competitive Positioning
- 6.10 Price, Margin and Profitability Implications
Chapter 7 Australia Agri Export Cold Chain Solutions Market Dynamics
- 7.1 Market Growth Drivers
- 7.1.1 Demand-Side Drivers
- 7.1.2 Technology and Innovation Drivers
- 7.1.3 Infrastructure and Investment Drivers
- 7.1.4 Regulatory and Policy Drivers
- 7.2 Market Restraints
- 7.2.1 Cost and Affordability Constraints
- 7.2.2 Technology and Adoption Barriers
- 7.2.3 Supply Chain and Operational Constraints
- 7.3 Market Challenges
- 7.3.1 Competitive Pressure and Margin Erosion
- 7.3.2 Skills, Infrastructure and Implementation Gaps
- 7.4 Emerging Market Opportunities
- 7.5 Market Dynamics Impact and Time-Horizon Assessment
Chapter 8 Australia Agri Export Cold Chain Solutions Value Chain Analysis
- 8.1 Industry Value Chain Overview
- 8.2 Upstream Suppliers and Critical Inputs
- 8.3 Technology and Component Providers
- 8.4 Manufacturing or Service Delivery
- 8.5 Distribution, Channel Partners and Integrators
- 8.6 Downstream Applications and End Users
- 8.7 Value Addition and Profit Pools
- 8.8 Vertical Integration and Outsourcing
- 8.9 Supplier Concentration and Risk
- 8.10 Supply Chain Localization and Resilience
Chapter 9 Australia Agri Export Cold Chain Solutions Market Regulations and Policies
- 9.1 Relevant Laws, Standards and Compliance Frameworks
- 9.2 Product, Service, Safety and Quality Requirements
- 9.3 Government Policies, Incentives and Subsidies
- 9.4 Imports, Exports and Trade Barriers
- 9.5 Public Procurement and Local Content Requirements
- 9.6 Environmental and Sustainability Compliance
- 9.7 Upcoming Policy Changes and Market Implications
Chapter 10 Australia Agri Export Cold Chain Solutions Market Hotspots and Opportunities
- 10.1 Market Opportunity Mapping and Growth Hotspots
- 10.2 High-Growth Applications and Customer Groups
- 10.3 Underserved Markets and White-Space Opportunities
- 10.4 Emerging Technology and Product Opportunities
- 10.5 New Capacity and Investment Hotspots
- 10.6 Market Entry and Expansion Opportunities
- 10.7 Distribution and Partnership Opportunities
- 10.8 Near-Term and Long-Term Commercial Potential
- 10.9 Opportunity Attractiveness and Execution Risks
Chapter 11 Australia Agri Export Cold Chain Solutions Market Outlook, 2025-2035
- 11.1 Market Size and Analysis
- 11.1.1 Revenue (Market Measurement: 2025: USD 1.12 billion → 2035: USD 2.28 billion)
- 11.1.2 Market Volume and Quantity Sold
- 11.1.3 Historical Market Size, 2018-2025
- 11.1.4 Base-Year Market Size, 2025
- 11.2 Market Forecast, 2025-2035
- 11.2.1 Revenue Forecast to 2035
- 11.2.2 Volume Forecast to 2035
- 11.2.3 CAGR and Year-on-Year Growth
- 11.2.4 Incremental Revenue Opportunity
- 11.3 Forecast Assumptions and Scenario Analysis
- 11.3.1 Base-Case Forecast
- 11.3.2 Optimistic and Conservative Scenarios
- 11.3.3 Technology, Pricing and Policy Sensitivities
- 11.4 Market Attractiveness and Growth Outlook
Chapter 12 Australia Agri Export Cold Chain Solutions Market Segmentation and Outlook
- 12.1 Segmentation Summary and Market Shares, 2025
- 12.2 Largest and Fastest-Growing Segments
- 12.3 By Service Type - Market Size and Forecast, 2025-2035
- 12.3.1 Segment Definition and Scope
- 12.3.2 Historical Market Size, 2018-2025
- 12.3.3 Revenue Forecast, 2025-2035
- 12.3.4 Volume Forecast, 2025-2035
- 12.3.5 Base-Year Market Share, 2025
- 12.3.6 Segment CAGR and Growth Drivers
- 12.3.7 Subsegment Market Size and Forecast
- 12.3.7.1 Refrigerated Transport
- 12.3.7.2 Export Staging Storage
- 12.3.7.3 Export Handling and Compliance
- 12.3.8 Subsegment Pricing and Adoption Trends
- 12.3.9 Leading Suppliers and Competition
- 12.3.10 Regional Demand and Opportunities
- 12.4 By Mode of Transport - Market Size and Forecast, 2025-2035
- 12.4.1 Segment Definition and Scope
- 12.4.2 Historical Market Size, 2018-2025
- 12.4.3 Revenue Forecast, 2025-2035
- 12.4.4 Volume Forecast, 2025-2035
- 12.4.5 Base-Year Market Share, 2025
- 12.4.6 Segment CAGR and Growth Drivers
- 12.4.7 Subsegment Market Size and Forecast
- 12.4.7.1 Road-led Chains
- 12.4.7.2 Rail-linked Chains
- 12.4.7.3 Air Gateway Chains
- 12.4.8 Subsegment Pricing and Adoption Trends
- 12.4.9 Leading Suppliers and Competition
- 12.4.10 Regional Demand and Opportunities
- 12.5 By Shipment Flow - Market Size and Forecast, 2025-2035
- 12.5.1 Segment Definition and Scope
- 12.5.2 Historical Market Size, 2018-2025
- 12.5.3 Revenue Forecast, 2025-2035
- 12.5.4 Volume Forecast, 2025-2035
- 12.5.5 Base-Year Market Share, 2025
- 12.5.6 Segment CAGR and Growth Drivers
- 12.5.7 Subsegment Market Size and Forecast
- 12.5.7.1 Consolidated Export Staging
- 12.5.7.2 Direct Export Dispatch
- 12.5.7.3 Treatment-led Export Dispatch
- 12.5.8 Subsegment Pricing and Adoption Trends
- 12.5.9 Leading Suppliers and Competition
- 12.5.10 Regional Demand and Opportunities
- 12.6 By End-Use Industry - Market Size and Forecast, 2025-2035
- 12.6.1 Segment Definition and Scope
- 12.6.2 Historical Market Size, 2018-2025
- 12.6.3 Revenue Forecast, 2025-2035
- 12.6.4 Volume Forecast, 2025-2035
- 12.6.5 Base-Year Market Share, 2025
- 12.6.6 Segment CAGR and Growth Drivers
- 12.6.7 Subsegment Market Size and Forecast
- 12.6.7.1 Meat and Poultry
- 12.6.7.2 Horticulture
- 12.6.7.3 Dairy
- 12.6.7.4 Seafood and Aquaculture
- 12.6.8 Subsegment Pricing and Adoption Trends
- 12.6.9 Leading Suppliers and Competition
- 12.6.10 Regional Demand and Opportunities
- 12.7 Segment Growth Comparison
- 12.8 Segment Attractiveness and Priority Matrix
Chapter 13 Australia Agri Export Cold Chain Solutions End-Use and Application Market Outlook
- 13.1 End-Use Industry and Customer Demand Structure
- 13.2 Leading Applications and Customer Groups
- 13.3 End-Use Market Size, Share and Forecast
- 13.4 Major End-Use Industry Deep Dives
- 13.4.1 Customer Requirements and Use Cases
- 13.4.2 Demand and Replacement Cycles
- 13.4.3 Technical and Regulatory Considerations
- 13.4.4 Purchasing and Procurement Models
- 13.4.5 Leading Vendors and Distribution Channels
- 13.4.6 Forecast and Commercial Opportunities
- 13.5 Emerging Applications and Cross-Segment Demand
- 13.6 End-Use Industry Investment Priorities
Chapter 14 Australia Agri Export Cold Chain Solutions Geographic Market Outlook, 2025-2035
- 14.1 Domestic Market Distribution and Demand Clusters
- 14.2 State- or Province-Wise Market Size and Forecast, 2025-2035
- 14.3 City and Metropolitan Market Outlook
- 14.4 Industrial, Manufacturing and Commercial Clusters
- 14.5 Geographic Concentration of Key End Users
- 14.6 Local Pricing and Purchasing Differences
- 14.7 Domestic Production Facilities and Capacity Map
- 14.8 Local Infrastructure and Project Pipeline
- 14.9 State-Level Policy and Incentive Differences
- 14.10 Subnational Investment Hotspots and Opportunities
- 14.11 Distribution and Logistics Networks
- 14.12 Domestic Competitive Footprint
Chapter 15 Australia Agri Export Cold Chain Solutions Technology, Innovation and Sustainability Outlook
- 15.1 Technology Landscape and Maturity
- 15.2 Product, Process and Service Innovation
- 15.3 AI, Automation and Digital Tools in the Industry
- 15.4 Technology Adoption and Performance Benchmarking
- 15.5 Innovation Pipeline and R&D Investment
- 15.6 Patent and Intellectual Property Trends
- 15.7 Energy Efficiency and Resource Management
- 15.8 Sustainability, Recycling and Circularity
- 15.9 Technology Roadmap, 2025-2035
- 15.10 Risks of Obsolescence and Technology Substitution
Chapter 16 Australia Agri Export Cold Chain Solutions Market Key Strategic Imperatives
- 16.1 Growth and Market Entry Priorities
- 16.2 High-Return Products and Segments
- 16.3 Pricing, Profitability and Cost Optimization
- 16.4 Technology Investment and Product Differentiation
- 16.5 Supply Chain Localization and Resilience
- 16.6 Distribution and Customer Acquisition
- 16.7 Partnership, Acquisition and Capacity Strategy
- 16.8 Regional Expansion Priorities
- 16.9 Short-, Medium- and Long-Term Actions
Chapter 17 Competition Outlook
- 17.1 Industry Competition Characteristics
- 17.2 Market Structure and Concentration
- 17.3 Market Share and Competitive Positioning, 2025
- 17.4 Company-Wise Revenue and Product Benchmarking
- 17.5 Production and Service Capacity Benchmarking
- 17.6 Technology, Pricing and Differentiation
- 17.7 Regional Footprint and Distribution Strength
- 17.8 Mergers, Acquisitions and Strategic Alliances
- 17.9 New Entrants and Competitive Threats
- 17.10 Porter's Five Forces and Industry Attractiveness
- 17.11 Competitive Outlook, 2025-2035
Chapter 18 Company Profiles
- 18.1 Company Coverage and Selection Criteria
- 18.2 Americold
- 18.2.1 Business Description
- 18.2.2 Company Ownership and Geographic Presence
- 18.2.3 Product and Service Portfolio
- 18.2.4 Manufacturing and Operating Footprint
- 18.2.5 Production Capacity and Expansion Plans
- 18.2.6 Financial Performance and Investment
- 18.2.7 Market Share and Competitive Position
- 18.2.8 Technology and Innovation Capabilities
- 18.2.9 Strategic Alliances or Partnerships
- 18.2.10 Recent Developments
- 18.2.11 Growth Strategy and Outlook
- 18.3 NewCold
- 18.4 Lineage
- 18.5 DP World
- 18.6 Laverton Cold Storage
- 18.7 Seaway Intermodal
- 18.8 Wiseway Logistics
- 18.9 CT Freight
- 18.10 Freshmax Australia
- 18.11 Export Logistics
- 18.12 Other Relevant Market Participants
Note: Every listed company is profiled on the structure shown under the first company. The company list is preliminary and may change based on research findings, market developments, data availability and client requirements.
Chapter 19 Disclaimer
- 19.1 Research and Forecast Disclaimer
- 19.2 Data Source and Estimation Limitations
Note: The depth of individual sections depends on data availability for this market. Volume, capacity, trade and other unit-based metrics are included where applicable.

