Market Overview:
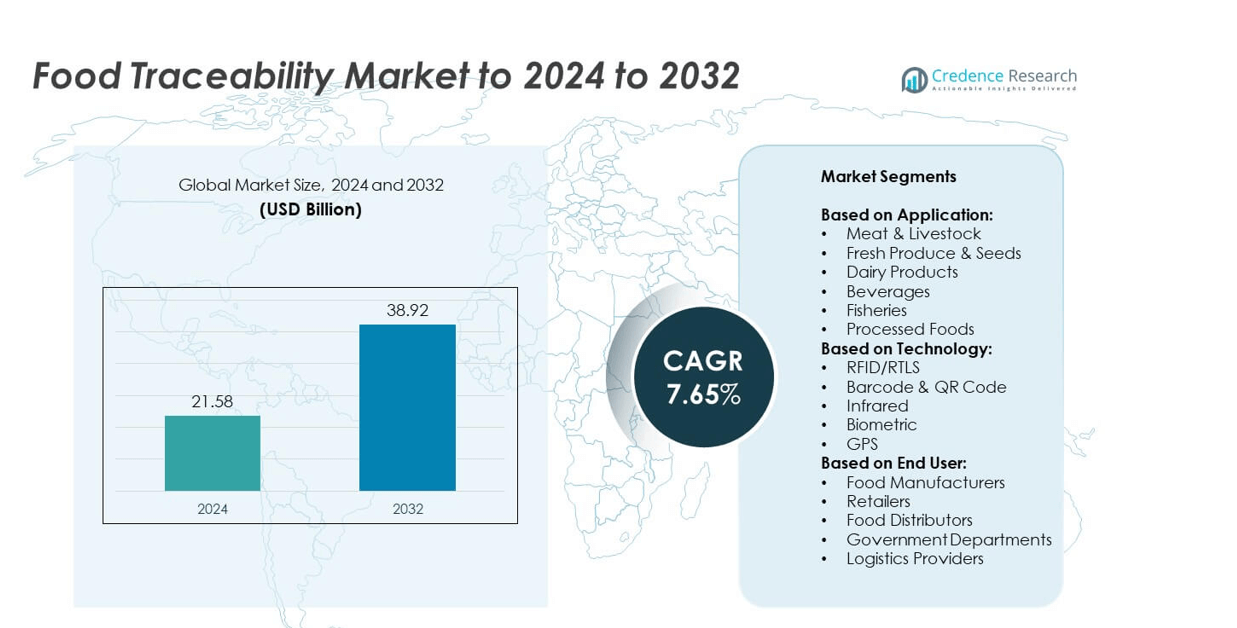
Food Traceability Market size was valued USD 21.58 Billion in 2024 and is anticipated to reach USD 38.92 Billion by 2032, at a CAGR of 7.65% during the forecast period.
| REPORT ATTRIBUTE |
DETAILS |
| Historical Period |
2020-2023 |
| Base Year |
2024 |
| Forecast Period |
2025-2032 |
| Food Traceability Market Size 2024 |
USD 21.58 Billion |
| Food Traceability Market, CAGR |
7.65% |
| Food Traceability Market Size 2032 |
USD 38.92 Billion |
The food traceability market is shaped by leading players such as Carlisle, FoodLogiQ, IBM, Bext360, SAP, Merit-Trax, Covectra, Cognex, Safe Traces, Bar Code Integrators, Zebra Technologies, SGS SA, and Honeywell International Inc. These companies drive innovation through blockchain, RFID, IoT, and cloud-based solutions that enhance transparency, safety, and efficiency across food supply chains. Strategic collaborations with manufacturers, retailers, and government agencies strengthen their competitive positioning. Regionally, North America led the market in 2024 with a 34% share, supported by stringent food safety regulations and rapid technology adoption, while Europe followed with 29% share driven by sustainability initiatives and cross-border compliance standards.
Market Insights
- The food traceability market was valued at USD 21.58 Billion in 2024 and is projected to reach USD 38.92 Billion by 2032, growing at a CAGR of 7.65%.
- Growing regulatory pressure and consumer demand for transparency are driving adoption of traceability systems across meat and livestock, which held the largest segment share of over 30% in 2024.
- Key trends include rapid adoption of blockchain, IoT, and smart labeling solutions that improve real-time monitoring, strengthen food safety, and enhance consumer trust in product authenticity.
- The competitive landscape features technology providers and solution developers focusing on digital platforms, advanced tracking tools, and strategic collaborations with manufacturers and retailers to widen adoption and maintain market positioning.
- Regionally, North America led with 34% share in 2024, followed by Europe with 29%, while Asia Pacific accounted for 24% and showed the fastest growth, supported by food safety initiatives and rising exports.
Access crucial information at unmatched prices!
Request your sample report today & start making informed decisions powered by Credence Research Inc.!
Download Sample
Market Segmentation Analysis:
By Application
The meat and livestock segment held the dominant share in the food traceability market in 2024, accounting for over 30% of total demand. Strict regulatory mandates for livestock tracking, rising concerns over foodborne diseases, and growing export requirements drive this dominance. Advanced traceability systems ensure compliance, enhance supply chain transparency, and build consumer trust in meat safety. Other applications such as fresh produce, dairy, beverages, fisheries, and processed foods are gaining traction, but the meat and livestock category remains the leading segment due to its critical role in public health and trade assurance.
- For instance, Allflex reports that over 500 million animals are identified each year using their visual and electronic tags
By Technology
Barcode and QR code technology dominated the food traceability market in 2024 with nearly 40% market share. Its cost-effectiveness, widespread adoption, and ease of integration make it the preferred choice across food supply chains. These solutions enable quick data capture and product authentication while supporting regulatory compliance. RFID and GPS are expanding in high-value supply chains, while biometric and infrared solutions are emerging in niche areas. However, the simplicity and affordability of barcoding continue to drive its leadership, especially for small and mid-sized enterprises seeking scalable traceability systems.
- For instance, GS1 US documents show that in 2024, GS1 US members have increasingly adopted 2D barcodes (QR) in supply chains, including food, as part of FSMA-204 compliance push.
By End User
Food manufacturers represented the largest end-user segment in 2024, capturing more than 35% share of the food traceability market. Their leadership stems from increasing pressure to ensure food safety, comply with international standards, and maintain brand reputation. Manufacturers invest heavily in traceability technologies to monitor raw materials, production processes, and finished goods. Retailers and distributors are strengthening adoption to enhance consumer trust and logistics efficiency, while government departments push traceability adoption through strict policies. Logistics providers play a growing role, but manufacturers remain dominant as they anchor supply chain transparency initiatives.
Key Growth Drivers
Stringent Food Safety Regulations
Stringent food safety regulations remain the primary growth driver for the food traceability market. Governments across North America, Europe, and Asia enforce strict compliance measures to reduce foodborne illnesses and improve consumer safety. Regulations such as the U.S. Food Safety Modernization Act and EU traceability directives compel manufacturers and suppliers to adopt advanced tracking systems. These legal frameworks ensure accountability across the supply chain, boosting adoption of traceability technologies. As regulations tighten globally, businesses increasingly invest in robust solutions to safeguard brand reputation and meet compliance standards.
- For instance, Thai Union sourced 87% of branded tuna from MSC-certified fisheries or FIPs in 2020, reflecting compliance and export demands.
Rising Consumer Demand for Transparency
Growing consumer awareness and demand for transparency strongly drive market expansion. Modern buyers expect clear details on product origin, handling, and authenticity, especially in meat, seafood, and dairy categories. This trend has increased adoption of labeling solutions such as QR codes and digital tags that enable real-time access to food information. Companies benefit from improved trust and brand loyalty, while reducing risks of counterfeit or mislabeled products. The increasing preference for sustainable and ethically sourced food further accelerates demand for end-to-end traceability systems across retail and foodservice sectors.
- For instance, AB InBev’s 2020 pilot project for barley traceability used blockchain technology to provide transparency for the 40% of its farming base that consists of indirect suppliers.
Adoption of Advanced Digital Technologies
Rapid adoption of digital technologies is another key growth driver in the food traceability market. Innovations such as blockchain, IoT-enabled sensors, and RFID systems streamline data recording, improve supply chain visibility, and reduce operational inefficiencies. These technologies help track perishable products in real time, enhancing safety and reducing food waste. Cloud-based platforms also provide scalability for both large enterprises and SMEs. As digital transformation accelerates in the food industry, stakeholders integrate advanced systems not only to comply with regulations but also to optimize supply chains and improve profitability.
Key Trends & Opportunities
Integration of Blockchain Solutions
Blockchain adoption represents a major trend and opportunity in the food traceability market. Its decentralized structure ensures tamper-proof records and transparent data sharing across stakeholders. Companies leverage blockchain to enhance supply chain credibility, prevent fraud, and provide consumers with real-time product insights. High-profile initiatives by global food retailers and agribusinesses highlight its potential to streamline recalls and boost safety compliance. As costs decrease and interoperability improves, blockchain adoption is expected to grow further, particularly in high-value sectors such as meat, seafood, and organic food supply chains.
- For instance, Walmart reduced traceability time for mangoes from 7 days to 2.2 seconds using its blockchain system.
Growth of IoT and Smart Labeling
The rise of IoT and smart labeling presents another significant opportunity. IoT-enabled devices, such as sensors and GPS trackers, provide continuous monitoring of temperature, humidity, and transit conditions, ensuring food safety during transportation. Smart labels, including QR codes and NFC tags, allow consumers to access detailed product histories instantly. These tools strengthen consumer engagement and help brands differentiate in competitive markets. With the rising importance of supply chain visibility and real-time monitoring, adoption of IoT and smart labeling solutions is set to expand rapidly across global food industries.
- For instance, Maersk operates a large fleet of refrigerated containers that are tracked in real-time as part of its Remote Container Management (RCM) program. In 2019, the RCM platform covered the combined reefer fleet of Maersk and Hamburg Süd, which consisted of over 380,000 containers, though the fleet size has fluctuated since then.
Key Challenges
High Implementation Costs
High implementation costs remain a major challenge in the food traceability market. Advanced systems such as RFID, IoT sensors, and blockchain platforms require significant capital investment, which can burden small and medium enterprises. Additionally, ongoing costs for system upgrades, staff training, and maintenance further add to financial pressure. Many businesses in developing regions delay adoption due to these expenses, slowing overall market penetration. Without affordable, scalable solutions, adoption rates remain uneven across supply chains, particularly in low-margin food processing and distribution segments.
Data Integration and Standardization Issues
Data integration and lack of global standardization present another critical challenge. Food supply chains involve multiple stakeholders operating with different systems, making seamless data exchange difficult. Inconsistent standards across regions further complicate traceability implementation, especially for companies engaged in cross-border trade. This fragmentation reduces efficiency, increases errors, and hampers transparency. Efforts by international organizations to develop harmonized traceability standards are ongoing, but adoption remains slow. Until interoperability improves, companies face obstacles in creating unified, end-to-end traceability systems that can meet global compliance and consumer expectations.
Regional Analysis
North America
North America accounted for the largest share of the food traceability market in 2024, holding 34%. The region’s dominance is driven by stringent regulatory frameworks such as the Food Safety Modernization Act and increasing consumer demand for transparency in food sourcing. High adoption of digital solutions including RFID, blockchain, and IoT enhances supply chain accountability. Strong presence of major food producers and retailers further accelerates investment in advanced tracking systems. The focus on reducing foodborne disease outbreaks and improving recall efficiency supports consistent growth, positioning North America as the leader in food traceability adoption.
Europe
Europe represented the second-largest market in 2024 with a share of 29%. The region benefits from strong regulatory policies such as EU food safety directives and initiatives promoting sustainability and ethical sourcing. Countries including Germany, France, and the UK lead adoption of advanced technologies for livestock and dairy traceability. Rising consumer preference for organic and non-GMO food products further drives demand. Food retailers and distributors are implementing blockchain and barcode solutions to strengthen transparency. Europe’s focus on cross-border trade and compliance ensures steady expansion, supported by strong collaborations among regulators, producers, and technology providers.
Asia Pacific
Asia Pacific captured 24% share of the food traceability market in 2024, emerging as the fastest-growing region. Rapid urbanization, rising middle-class income, and increased concerns over food safety scandals drive adoption. China, Japan, and India play leading roles with strong government initiatives to improve agricultural supply chains. Expanding exports of seafood, dairy, and processed foods demand stricter traceability compliance. Investment in smart labeling and IoT solutions is growing rapidly, particularly in logistics. Regional adoption is accelerating as manufacturers and retailers focus on improving brand trust and aligning with international food safety standards.
Latin America
Latin America held 7% share of the food traceability market in 2024, driven primarily by its large agricultural and livestock sectors. Countries such as Brazil, Mexico, and Argentina are expanding adoption to meet export requirements for meat, seafood, and fresh produce. Governments are encouraging implementation of tracking systems to strengthen food safety compliance and enhance trade credibility with North America and Europe. While infrastructure limitations and cost constraints slow widespread adoption, increasing participation in global supply chains drives investment. The region’s role as a major food exporter makes traceability adoption essential for growth.
Middle East and Africa
The Middle East and Africa accounted for 6% share of the food traceability market in 2024. Growth in this region is fueled by rising food imports, increasing focus on food security, and strengthening of regulatory frameworks. Gulf countries such as the UAE and Saudi Arabia invest in modern traceability solutions to ensure imported food safety. Africa is gradually adopting traceability systems, mainly for fisheries, cocoa, and fresh produce exports. However, infrastructure gaps and high costs limit faster adoption. Ongoing international collaborations and technology partnerships are expected to improve traceability penetration across the region.
Market Segmentations:
By Application:
- Meat & Livestock
- Fresh Produce & Seeds
- Dairy Products
- Beverages
- Fisheries
- Processed Foods
By Technology:
- RFID/RTLS
- Barcode & QR Code
- Infrared
- Biometric
- GPS
By End User:
- Food Manufacturers
- Retailers
- Food Distributors
- Government Departments
- Logistics Providers
By Geography:
- North America
- Europe
- UK
- France
- Germany
- Italy
- Spain
- Russia
- Belgium
- Netherlands
- Austria
- Sweden
- Poland
- Denmark
- Switzerland
- Rest of Europe
- Asia Pacific
- China
- Japan
- South Korea
- India
- Australia
- Thailand
- Indonesia
- Vietnam
- Malaysia
- Philippines
- Taiwan
- Rest of Asia Pacific
- Latin America
- Brazil
- Argentina
- Peru
- Chile
- Colombia
- Rest of Latin America
- Middle East
- UAE
- KSA
- Israel
- Turkey
- Iran
- Rest of Middle East
- Africa
- Egypt
- Nigeria
- Algeria
- Morocco
- Rest of Africa
Competitive Landscape
Carlisle, FoodLogiQ, IBM, Bext360, SAP, Merit-Trax, Covectra, Cognex, Safe Traces, Bar Code Integrators, Zebra Technologies, SGS SA, and Honeywell International Inc are among the key players shaping the food traceability market. The competitive landscape is defined by strong focus on digital transformation, with companies investing heavily in blockchain, IoT, and RFID-enabled solutions to enhance supply chain visibility. Vendors are expanding product portfolios to address diverse needs ranging from compliance management to smart labeling and logistics monitoring. Partnerships with food manufacturers, retailers, and government agencies strengthen market positioning and widen adoption. Innovation in cloud-based platforms, AI-driven analytics, and real-time monitoring technologies further differentiates players, enabling them to capture opportunities in high-growth regions. Competition is also influenced by global regulatory frameworks that push for standardized traceability systems. Market participants aim to balance affordability with scalability, ensuring adoption across both developed and emerging economies while securing long-term competitive advantages.
Shape Your Report to Specific Countries or Regions & Enjoy 30% Off!
Key Player Analysis
- Carlisle
- FoodLogiQ
- IBM
- Bext360
- SAP
- Merit-Trax
- Covectra
- Cognex
- Safe Traces
- Bar Code Integrators
- Zebra Technologies
- SGS SA
- Honeywell International Inc
Recent Developments
- In 2023, Zebra Technologies Introduced a new suite of hardware and software solutions that integrated RFID, barcode, and mobile computing technologies for enhanced supply chain visibility.
- In 2023, IBM Partnered with iFoodDS to introduce iFoodDS Trace Exchange, a new technology solution built on the IBM Food Trust network.
- In 2023, SAP Continued to build on its enterprise resource planning (ERP) systems and Business Network Material Traceability software.
Report Coverage
The research report offers an in-depth analysis based on Application, Technology, End-User and Geography. It details leading market players, providing an overview of their business, product offerings, investments, revenue streams, and key applications. Additionally, the report includes insights into the competitive environment, SWOT analysis, current market trends, as well as the primary drivers and constraints. Furthermore, it discusses various factors that have driven market expansion in recent years. The report also explores market dynamics, regulatory scenarios, and technological advancements that are shaping the industry. It assesses the impact of external factors and global economic changes on market growth. Lastly, it provides strategic recommendations for new entrants and established companies to navigate the complexities of the market.
Future Outlook
- The food traceability market will expand steadily with stricter global food safety regulations.
- Adoption of blockchain platforms will increase to ensure transparent and tamper-proof records.
- RFID and IoT technologies will see higher usage in perishable food supply chains.
- Consumer demand for product origin and authenticity will continue to rise worldwide.
- Emerging markets will accelerate adoption to meet export compliance requirements.
- Cloud-based traceability platforms will gain traction among small and medium enterprises.
- Retailers will invest in smart labeling to enhance consumer engagement and trust.
- Cross-border trade will drive harmonization of traceability standards across regions.
- Governments will provide stronger support for digital traceability adoption in agriculture.
- Integration of AI and analytics will improve supply chain monitoring and efficiency.


