Market Overview
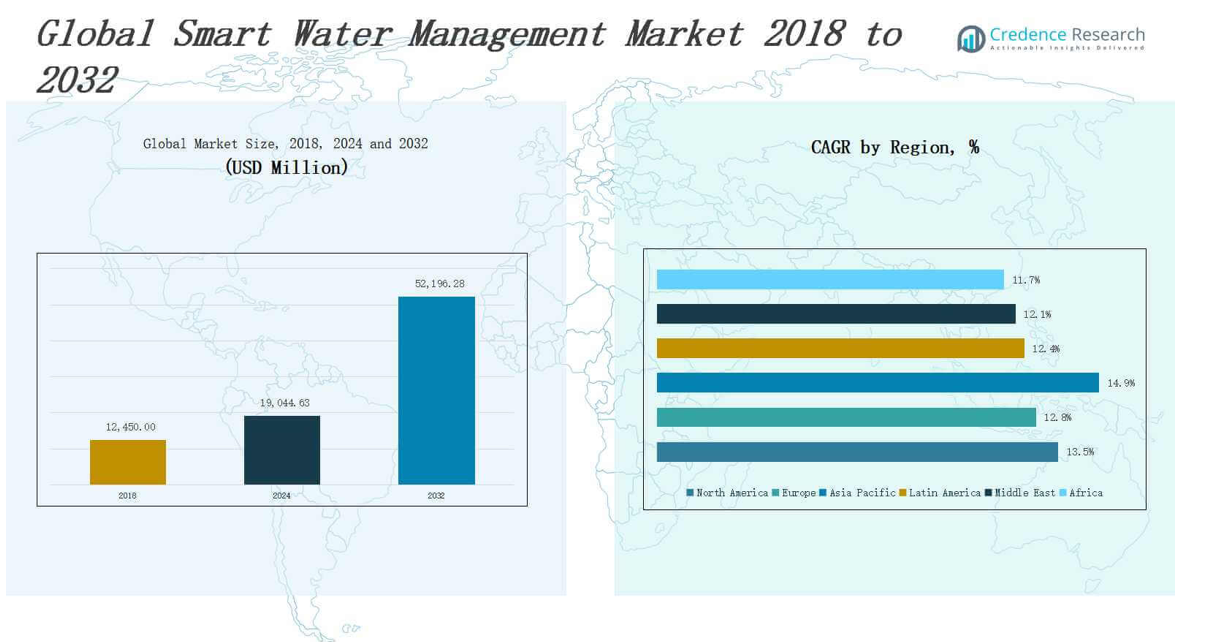
The Smart Water Management Market size was valued at USD 12,450.00 million in 2018 to USD 19,044.63 million in 2024 and is anticipated to reach USD 52,196.28 million by 2032, at a CAGR of 13.50% during the forecast period.
| REPORT ATTRIBUTE |
DETAILS |
| Historical Period |
2020-2023 |
| Base Year |
2024 |
| Forecast Period |
2025-2032 |
| Smart Water Management Market Size 2024 |
USD 19,044.63 million |
| Smart Water Management Market, CAGR |
13.50% |
| Smart Water Management Market Size 2032 |
USD 52,196.28 million |
The Smart Water Management Market is witnessing strong growth driven by increasing global water scarcity, aging infrastructure, and rising demand for efficient water utilization. Governments and utilities are investing in smart metering, leak detection, and data analytics to enhance operational efficiency and reduce water loss. The integration of IoT, AI, and cloud-based platforms enables real-time monitoring, predictive maintenance, and automated decision-making across water distribution networks. Urbanization and industrial expansion further amplify the need for sustainable water resource management. Regulatory pressure to improve water quality and ensure compliance with environmental standards accelerates the adoption of smart solutions. Consumers and industries alike are demanding greater transparency and control over water usage, driving the uptake of advanced technologies. Emerging economies are deploying smart water systems to support growing populations and improve service delivery. Strategic collaborations between technology providers and water authorities are expanding solution portfolios and enabling scalable deployment. This trend positions smart water management as a critical component of future urban infrastructure.
The Smart Water Management Market demonstrates strong global expansion, with North America holding the largest share due to advanced infrastructure and early adoption. Europe follows closely, driven by strict regulations and smart city projects. Asia Pacific emerges as the fastest-growing region, fueled by rapid urbanization and government support. Latin America shows steady progress through public-private partnerships, while the Middle East focuses on addressing water scarcity with digital solutions. Africa experiences gradual growth, supported by pilot programs and international aid. Key players in the Smart Water Management Market include Siemens, IBM, Schneider Electric, Xylem Inc., Honeywell, Itron Inc., SUEZ, Oracle Corporation, Landis+Gyr, and Trimble Inc. These companies compete on technology innovation, integration capabilities, and sustainability-driven solutions, actively shaping the market landscape across developed and developing economies.
Market Insights
- The Smart Water Management Market was valued at USD 19,044.63 million in 2024 and is projected to reach USD 52,196.28 million by 2032, growing at a CAGR of 13.50%, driven by increasing water scarcity and infrastructure modernization.
- Governments and utilities are investing in smart metering, SCADA systems, and data analytics to optimize water usage, reduce non-revenue losses, and improve operational efficiency.
- Integration of IoT, AI, and cloud platforms enables predictive maintenance, real-time monitoring, and automated decision-making across water networks.
- Rapid urbanization, industrial expansion, and climate-related pressures are driving the demand for scalable, sustainable water management solutions in both developed and developing regions.
- High upfront investment, slow ROI, and cybersecurity risks remain key challenges, particularly in regions with limited budgets or aging infrastructure.
- North America leads the market with advanced infrastructure and strong government support, while Asia Pacific is the fastest-growing region due to urban growth and public funding.
- Key players including Siemens, IBM, Schneider Electric, Xylem, Honeywell, Itron, SUEZ, Oracle, Landis+Gyr, and Trimble compete on innovation, integration capabilities, and sustainability-driven offerings.
Access crucial information at unmatched prices!
Request your sample report today & start making informed decisions powered by Credence Research Inc.!
Download Sample
Market Drivers
Rising Global Water Scarcity and Demand for Resource Optimization
The Smart Water Management Market is gaining momentum due to growing concerns over water scarcity and the urgent need for sustainable resource use. Rapid urbanization and population growth continue to stress water supply systems. Governments and utilities are prioritizing smart technologies to optimize consumption, reduce waste, and ensure availability. It addresses inefficiencies in legacy infrastructure and enables real-time monitoring of supply and demand. These solutions improve distribution efficiency and reduce non-revenue water losses. The need to manage limited water resources effectively is accelerating smart water deployment across regions.
- For instance, IBM and the City of Dubuque partnered to equip over 300 households with smart water meters from Neptune Technology Group, providing near real-time consumption data and leak alerts via a web portal, which led to significant water savings during the pilot.
Government Regulations and Infrastructure Modernization Efforts
The Smart Water Management Market benefits from stringent environmental and water quality regulations that push utilities to modernize outdated infrastructure. Regulatory frameworks in North America, Europe, and parts of Asia require utilities to meet high standards of reporting, leakage control, and consumption monitoring. Governments are funding smart infrastructure upgrades to improve operational transparency and water conservation. It supports compliance through accurate data analytics and remote system control. These investments improve system resilience and enable better long-term planning. Policy-driven modernization efforts are a key force behind market growth.
- For instance, SMART FLOW helped Midleton Park Hotel save 36.5 million litres of water annually, cutting costs by €91,000 through real-time leak detection and water usage monitoring.
Integration of IoT, AI, and Cloud Technologies
Technological advancements significantly drive the Smart Water Management Market by enabling smarter decision-making and automation. Integration of IoT sensors, artificial intelligence, and cloud platforms provides real-time insights into water quality, usage patterns, and system anomalies. It facilitates predictive maintenance, early leak detection, and efficient resource allocation. Utilities are increasingly deploying smart meters and networked systems to enhance visibility and control. These technologies improve service reliability and reduce operational costs. Continuous innovation is transforming traditional water systems into intelligent, adaptive infrastructure.
Industrial Growth and Urban Infrastructure Development
The Smart Water Management Market is expanding with growing industrialization and the need for robust urban water infrastructure. Industries require accurate usage tracking, contamination prevention, and compliance monitoring, which smart systems can deliver efficiently. It helps municipalities address urban water challenges through scalable and data-driven solutions. Smart water systems are critical in supporting sustainable city planning and resilience against climate variability. Investment in smart infrastructure is increasing across developing regions. Urban development projects are adopting intelligent water systems as essential infrastructure components.
Market Trends
Widespread Adoption of Smart Meters and Sensors
The Smart Water Management Market is witnessing strong traction in the deployment of smart meters and sensor-based networks. Utilities are prioritizing these technologies to improve accuracy in consumption measurement and detect leaks or pressure anomalies early. It allows for real-time monitoring, better customer billing, and reduced water losses. Cities and municipalities are investing in scalable meter infrastructures to modernize their systems. These devices support remote access and reduce the need for manual meter reading. Increasing digitization is transforming traditional water management into data-driven, responsive operations.
- For instance, Kamstrup and Sensus have deployed IoT-powered smart meters that deliver real-time consumption data and leak alerts, allowing utilities and consumers to optimize water usage and reduce waste.
Shift Toward Data-Driven Decision Making and Predictive Analytics
Utilities are increasingly using data analytics to drive operational efficiency in the Smart Water Management Market. Predictive analytics enables early identification of pipeline failures, consumption anomalies, and system inefficiencies. It supports proactive maintenance and reduces the risk of infrastructure breakdowns. Cloud-based platforms provide centralized control over water networks, allowing utilities to make informed decisions quickly. The trend favors technologies that combine historical data with real-time inputs. Intelligent analytics is becoming a core requirement for efficient urban water management strategies.
- For instance, IoT-enabled smart meters from companies like Kamstrup and Sensus provide real-time consumption data and leak alerts, empowering both utilities and consumers to identify inefficiencies and implement targeted water-saving strategies.
Rising Focus on Sustainability and Circular Water Use Models
The Smart Water Management Market is aligning with global sustainability goals by promoting circular models and resource conservation. Utilities are integrating water reuse, recycling, and wastewater treatment systems into broader smart infrastructure strategies. It encourages reduced freshwater dependency and optimizes water lifecycle management. This trend supports climate adaptation and resilient infrastructure planning. Stakeholders are seeking solutions that balance operational efficiency with environmental stewardship. Growing interest in green technologies is pushing innovation in sustainable water management frameworks.
Expansion of Public-Private Partnerships and Global Pilot Programs
Public and private stakeholders are collaborating to accelerate the development and deployment of smart water infrastructure. The Smart Water Management Market benefits from international pilot programs, innovation labs, and consortium-led initiatives aimed at testing scalable solutions. It encourages joint investments in advanced technologies and platforms. Governments are partnering with technology firms to bridge infrastructure gaps and improve public service delivery. These partnerships are fostering innovation and capacity building. Multi-stakeholder engagement is shaping the future of integrated, smart water ecosystems.
Market Challenges Analysis
High Capital Investment and Slow Return on Infrastructure Upgrades
The Smart Water Management Market faces challenges related to the high upfront costs of implementing advanced infrastructure. Many utilities, particularly in developing regions, struggle with limited budgets and aging legacy systems that require significant modernization. It demands long-term investment in smart meters, sensors, software platforms, and training. The return on investment is gradual, which can deter stakeholders from committing to full-scale adoption. Smaller municipalities often lack the technical expertise and financial models to support these upgrades. Balancing short-term costs with long-term benefits remains a major hurdle.
Data Privacy, Integration Complexity, and Cybersecurity Risks
Smart water systems generate vast amounts of sensitive operational and consumer data, raising concerns over privacy and cybersecurity. The Smart Water Management Market must address integration challenges across various hardware and software platforms, especially in multi-vendor environments. It requires secure, interoperable systems to ensure consistent performance. Cyber threats targeting critical infrastructure pose risks to system reliability and public safety. Utilities must invest in robust security protocols and continuous monitoring. Ensuring data integrity while managing system complexity continues to slow widespread implementation.
Market Opportunities
Expansion in Emerging Economies and Infrastructure Modernization Projects
The Smart Water Management Market holds strong growth potential in emerging economies undergoing rapid urbanization and industrialization. Governments in regions such as Asia-Pacific, Latin America, and the Middle East are investing in smart infrastructure to meet rising water demands. It creates opportunities for solution providers to deliver cost-effective, scalable systems tailored to regional needs. International funding agencies and public-private partnerships support these projects, driving innovation and adoption. Modernizing outdated water infrastructure with smart technologies helps improve efficiency and service delivery. These markets are increasingly open to adopting smart water solutions to ensure long-term sustainability.
Growing Demand for Resilient and Sustainable Urban Water Systems
Urban planners and utilities are seeking integrated solutions that align with sustainability goals and climate adaptation strategies. The Smart Water Management Market is well positioned to meet this demand through systems that support water reuse, stormwater management, and leak detection. It offers opportunities for vendors to develop modular, adaptable platforms for smart cities. Demand for real-time monitoring and automated control is creating a strong pull for IoT- and AI-enabled water systems. Utilities aim to build resilient infrastructure capable of handling extreme weather and population pressures. The global shift toward sustainable urban development expands the market’s strategic importance.
Market Segmentation Analysis:
By Offering
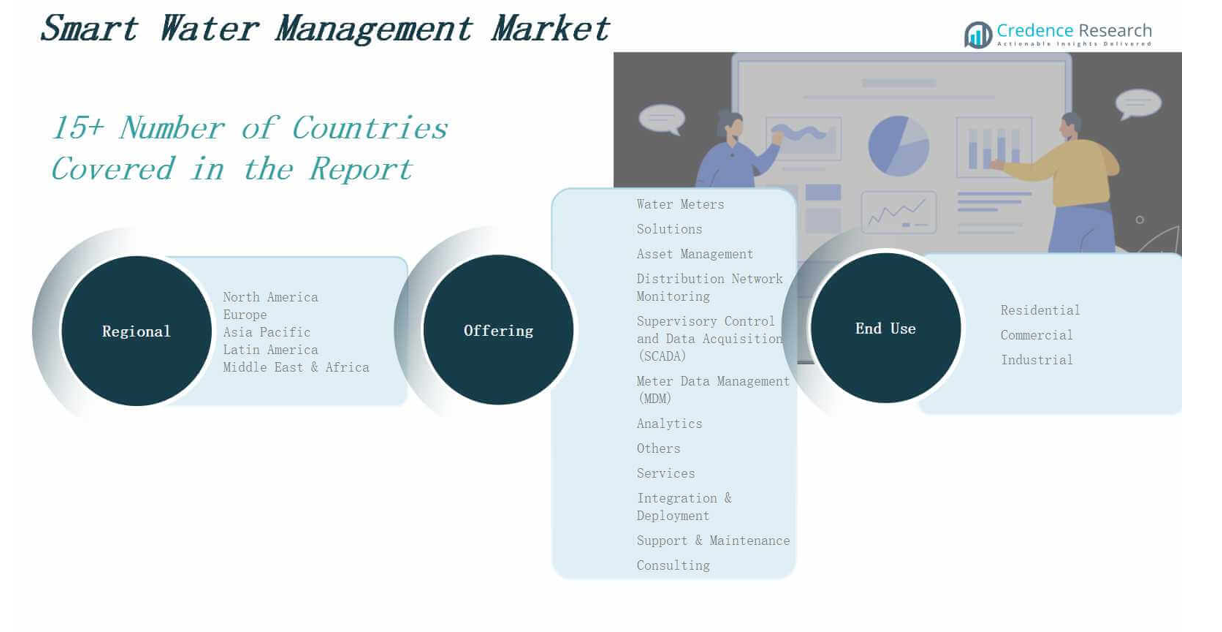
The Smart Water Management Market includes water meters, solutions, and services. Water meters provide accurate consumption tracking, while solutions such as asset management, SCADA, distribution monitoring, MDM, and analytics improve system control and efficiency. Services include integration & deployment, support & maintenance, and consulting, helping utilities implement and sustain smart technologies. It delivers a unified approach by combining hardware, software, and expert support for optimized water infrastructure management.
- For instance, Sensus has deployed smart water meters in cities like London, enabling utilities to track real-time consumption and promptly detect leaks, which helps reduce water losses and improve billing accuracy.
By End Use
Based on end use, the Smart Water Management Market serves residential, commercial, and industrial sectors. The residential segment relies on smart meters and leak detection systems for efficient usage and lower utility costs. Commercial users adopt intelligent systems to monitor complex water networks in buildings and campuses. Industrial facilities utilize smart technologies for high-volume water processing, compliance, and sustainability. It delivers measurable benefits across sectors by improving water quality, reducing waste, and ensuring regulatory compliance. Each segment plays a vital role in driving demand for comprehensive smart water solutions.
- For instance, Kariot provides IoT-enabled smart water management systems for residential users, enabling real-time monitoring of water consumption and leak detection, which helps households conserve water and reduce operational costs.
Segments:
Based on Offering
- Water Meters
- Solutions
- Asset Management
- Distribution Network Monitoring
- Supervisory Control and Data Acquisition (SCADA)
- Meter Data Management (MDM)
- Analytics
- Others
Services
- Integration & Deployment
- Support & Maintenance
- Consulting
Based on End Use
- Residential
- Commercial
- Industrial
Based on Region
- North America
- Europe
- Germany
- France
- U.K.
- Italy
- Spain
- Rest of Europe
- Asia Pacific
- China
- Japan
- India
- South Korea
- South-east Asia
- Rest of Asia Pacific
- Latin America
- Brazil
- Argentina
- Rest of Latin America
- Middle East & Africa
- GCC Countries
- South Africa
- Rest of the Middle East and Africa
Regional Analysis
North America
The North America Smart Water Management Market size was valued at USD 4,330.11 million in 2018, reached USD 6,539.81 million in 2024, and is anticipated to reach USD 17,898.20 million by 2032, at a CAGR of 13.5% during the forecast period. North America holds the largest share in the Smart Water Management Market, driven by early technology adoption and strong infrastructure investments. The U.S. leads regional demand with large-scale deployments of smart meters and SCADA systems. Utilities focus on reducing non-revenue water and improving real-time monitoring through IoT and analytics. It benefits from government initiatives supporting sustainable water use and infrastructure modernization. High digital maturity and private-sector participation continue to fuel market growth across the region.
Europe
The Europe Smart Water Management Market size was valued at USD 3,472.31 million in 2018, reached USD 5,116.77 million in 2024, and is anticipated to reach USD 13,291.92 million by 2032, at a CAGR of 12.8% during the forecast period. Europe represents a significant share of the market, supported by strict environmental regulations and widespread smart city initiatives. Countries such as Germany, the UK, and France emphasize data-driven water conservation and digital infrastructure upgrades. It sees growing demand for predictive analytics, remote monitoring, and leak detection systems. EU funding programs enhance deployment, particularly in water-stressed regions. Utilities across Europe are transitioning toward intelligent water networks for greater efficiency and transparency.
Asia Pacific
The Asia Pacific Smart Water Management Market size was valued at USD 3,050.25 million in 2018, reached USD 4,872.49 million in 2024, and is anticipated to reach USD 14,735.05 million by 2032, at a CAGR of 14.9% during the forecast period. Asia Pacific is the fastest-growing regional market, driven by rapid urbanization and the need to upgrade aging water infrastructure. China, India, Japan, and South Korea lead investments in smart metering, automation, and AI-based water monitoring. It benefits from increasing government support and international funding for digital utility transformation. Rising demand for clean water and climate resilience further accelerates adoption. The region’s vast population and industrial expansion create strong long-term opportunities.
Latin America
The Latin America Smart Water Management Market size was valued at USD 719.61 million in 2018, reached USD 1,089.16 million in 2024, and is anticipated to reach USD 2,749.18 million by 2032, at a CAGR of 12.4% during the forecast period. Latin America is witnessing gradual adoption of smart water solutions amid infrastructure deficits and rising urban demand. Countries like Brazil and Mexico are investing in pilot projects and upgrading water utilities in metropolitan areas. It faces challenges such as water loss and inefficiencies that smart technologies aim to resolve. Public-private partnerships and regulatory reforms support digital transformation efforts. The region’s growing need for reliable water access positions it as a promising market.
Middle East
The Middle East Smart Water Management Market size was valued at USD 473.10 million in 2018, reached USD 677.87 million in 2024, and is anticipated to reach USD 1,675.79 million by 2032, at a CAGR of 12.1% during the forecast period. The Middle East is embracing smart water solutions to manage water scarcity and support national sustainability agendas. Countries like the UAE and Saudi Arabia invest in advanced monitoring, desalination integration, and automation technologies. It relies on digital tools to enhance operational visibility and water conservation. Government-led initiatives aim to secure water resources for expanding urban populations. Smart infrastructure plays a vital role in achieving regional water security goals.
Africa
The Africa Smart Water Management Market size was valued at USD 404.63 million in 2018, reached USD 748.53 million in 2024, and is anticipated to reach USD 1,846.14 million by 2032, at a CAGR of 11.7% during the forecast period. Africa is gradually advancing toward smart water adoption, driven by the need to address water access challenges and reduce supply losses. Countries like South Africa and Egypt are initiating smart meter deployments and pilot projects in urban centers. It is supported by international development agencies promoting digital water solutions. Infrastructure limitations and funding gaps pose challenges, yet growing awareness is boosting interest in smart systems. Expanding urban populations and climate pressures are expected to spur future growth.
Shape Your Report to Specific Countries or Regions & Enjoy 30% Off!
Key Player Analysis
- Siemens
- IBM (International Business Machines Corporation)
- Xylem Inc.
- Honeywell International Inc.
- Schneider Electric SE
- Itron Inc.
- SUEZ
- Oracle Corporation
- Landis+Gyr
- Trimble Inc.
Competitive Analysis
The Smart Water Management Market features a competitive landscape shaped by technology innovation, strategic partnerships, and global expansion. Leading players such as Siemens, IBM, Schneider Electric, Xylem Inc., and Honeywell focus on integrating advanced analytics, IoT, and AI into their product portfolios. It reflects strong competition in software platforms, smart meters, and end-to-end water management solutions. Companies invest in R&D to enhance performance, scalability, and system interoperability. Regional and local firms compete by offering customized solutions and cost-effective deployments, especially in emerging markets. Mergers, acquisitions, and collaborations help firms expand their geographic reach and strengthen service capabilities. The market favors players that deliver holistic, secure, and data-driven platforms aligned with sustainability goals. Competitive differentiation also comes from after-sales support, regulatory compliance, and the ability to integrate with legacy infrastructure. Companies that prioritize innovation and offer scalable, flexible systems are better positioned to capture long-term contracts with utilities and government agencies.
Recent Developments
- In January 2025, Siemens formed a collaboration with KETOS to enhance global water management by combining Siemens’ automation expertise with KETOS’ real-time analytics for improved water quality and sustainability monitoring.
- In March 2025, Honeywell International Inc. integrated Verizon’s 5G connectivity into its smart utility meters to bolster remote and autonomous water and energy management capabilities.
- In January 2025, Badger Meter Corporation acquired SmartCover Systems from XPV Water Partners for $185 million, significantly enhancing its real-time monitoring capabilities for sewer lines and lift stations within its BlueEdge suite.
- In July 2023, SUEZ and Schneider Electric formed a partnership to accelerate the deployment of digital solutions for energy efficiency and resource conservation in water cycle management systems.
Market Concentration & Characteristics
The Smart Water Management Market exhibits moderate to high market concentration, with a mix of global technology leaders and specialized solution providers shaping its competitive landscape. Large firms such as Siemens, IBM, Xylem, and Schneider Electric dominate the market through comprehensive product portfolios and long-term contracts with utilities. It is characterized by rapid technological evolution, where integration of IoT, AI, and cloud platforms drives product differentiation and service innovation. The market favors companies that offer scalable, end-to-end solutions capable of integrating with legacy systems. Strong emphasis on sustainability, regulatory compliance, and operational transparency defines purchasing behavior among utilities and municipalities. While developed regions see mature adoption, emerging markets present growth potential due to infrastructure needs and urban expansion. Strategic partnerships, public-private collaborations, and government-backed initiatives further influence competition. The Smart Water Management Market rewards innovation, reliability, and adaptability, creating opportunities for both established players and new entrants with disruptive capabilities.
Report Coverage
The research report offers an in-depth analysis based on Offering, End-Use and Region. It details leading market players, providing an overview of their business, product offerings, investments, revenue streams, and key applications. Additionally, the report includes insights into the competitive environment, SWOT analysis, current market trends, as well as the primary drivers and constraints. Furthermore, it discusses various factors that have driven market expansion in recent years. The report also explores market dynamics, regulatory scenarios, and technological advancements that are shaping the industry. It assesses the impact of external factors and global economic changes on market growth. Lastly, it provides strategic recommendations for new entrants and established companies to navigate the complexities of the market.
Future Outlook
- Governments will continue to prioritize smart water infrastructure to address water scarcity and improve resource efficiency.
- Utilities will adopt advanced analytics and AI tools to enable predictive maintenance and real-time decision-making.
- Integration of IoT-enabled sensors in water distribution networks will become standard practice across regions.
- Demand for smart meters will increase due to the need for accurate billing and consumption monitoring.
- Cloud-based platforms will support centralized data management and scalable deployment of smart water systems.
- Public-private partnerships will expand to fund and implement large-scale smart water projects.
- Regulatory pressure will drive utilities to improve leakage control, reporting accuracy, and operational transparency.
- Emerging markets will invest heavily in digital water technologies to support rapid urbanization and infrastructure growth.
- Vendors will focus on offering interoperable solutions compatible with legacy systems and regional standards.
- Sustainability goals will push water utilities to adopt circular water use models and conservation-focused strategies.


