
Banks hand cash, uptime and security to service partners
The Philippines ATM managed services market was valued at USD 63.5 million in 2025 and is projected to increase from USD 70.1 million in 2026 to USD 164.6 million by 2035, registering a CAGR of 9.94% during 2026–2035. Demand comes from banks that want to cut the cost of running scattered teller machine fleets, from independent deployers that place machines in convenience stores, and from government cash transfer programs that still pay out through cards. Luzon Outside NCR held the largest regional share, 35.0% in 2025, because provincial towns in Central Luzon and Calabarzon host many off-site machines that need regular cash and repair visits. Mindanao is the fastest-growing region at 10.68% a year, as banks and convenience chains extend coverage into underserved cities. In turn, the shift from one-off machine purchases to multiyear service contracts, with providers held to uptime targets, is changing how Philippine banks buy ATM support.
Which outsourced tasks keep Philippine teller machines running?
The estimate measures the value of outsourced services that keep automated teller machines running in the Philippines. It covers cash forecasting and replenishment, first- and second-line repair, transaction switching and network monitoring, security and compliance work, and site and screen content management, whether bought as a full package, as separate modules, as a subscription or under a co-managed model.
The estimate excludes the purchase price of new machines, in-house work by bank staff and fees that cardholders pay per withdrawal. The value chain runs from machine makers and software vendors through service integrators, cash-in-transit firms and switch operators to banks, independent deployers, retailers and public sites.

Philippines ATM Managed Services Market Insights
- The Philippines ATM managed services market was valued at USD 63.5 million in 2025 and is projected to reach USD 164.6 million by 2035, registering a CAGR of 9.94% during 2026–2035.
- Luzon Outside NCR held 35.0% of 2025 value, because provincial towns host many off-site machines that need frequent service visits.
- Cash management and replenishment led with 34.0% of 2025 value, because every machine needs cash loading and balancing several times a week.
- BancNet reported 29,453 connected teller machines at the end of 2025, up 6.5% from 27,659 a year earlier, which widens the base that needs service.
- Union Bank of the Philippines handed maintenance and management of more than 400 ATMs to an outsourced service model in July 2023.
Cash replenishment leads as security services grow fastest
Why does cash replenishment hold the largest value?
Based on service type, the market is categorized into cash management and replenishment, ATM repair and maintenance, transaction processing and network management, security and compliance management, and site and content management. Cash Management and Replenishment led with 34.0% of 2025 value, because armored trips, cash forecasting and balancing recur for every machine each week. Security and Compliance Management grows fastest at 11.14% a year, as banks respond to stricter fraud rules and attacks on machines.
How do machine locations shape service needs?
Based on ATM location, the market is categorized into on-site ATMs, off-site ATMs, mobile and event ATMs, and shared and white-label ATMs. On-Site ATMs led with 46.0% of 2025 value, because most bank machines still sit inside or beside branches. Shared and White-Label ATMs grow fastest at 11.29% a year, as convenience store networks and independent deployers place machines that serve cardholders of many banks.
Which buyers spend the most on outsourced ATM support?
Based on end user, the market is categorized into banks and financial institutions, independent ATM deployers, retail and convenience operators, and government, transport and hospitality sites. Banks and Financial Institutions led with a 68.0% share of 2025 value, because universal, commercial, thrift and rural banks own most of the national fleet. Retail and Convenience Operators grow fastest at 10.80% a year, as store chains use machines to draw foot traffic.
Why are banks moving toward subscription contracts?
Based on delivery model, the market is categorized into fully managed ATM services, modular managed services, ATM-as-a-service and co-managed operations. Fully Managed ATM Services led with 41.0% of 2025 value, because large banks prefer one provider accountable for cash, repair and monitoring. ATM-as-a-Service grows fastest at 11.71% a year, as banks swap machine purchases for monthly fees tied to uptime.
| Segment Group | Leading Sub-segment | Share, 2025 | Fastest-growing Sub-segment | CAGR, 2026–2035 |
|---|---|---|---|---|
| By Service Type | Cash Management and Replenishment | 34.0% | Security and Compliance Management | 11.14% |
| By ATM Location | On-Site ATMs | 46.0% | Shared and White-Label ATMs | 11.29% |
| By End User | Banks and Financial Institutions | 68.0% | Retail and Convenience Operators | 10.80% |
| By Delivery Model | Fully Managed ATM Services | 41.0% | ATM-as-a-Service | 11.71% |
Request a Free Sample
Fill in your details and we'll send you a free sample report.
- Sample data tables & charts
- Research methodology
Fleet growth, steady cash use and outsourcing lift demand
How does a growing, scattered ATM base lift service demand?
Every new off-site unit adds cash trips, repair calls and monitoring work that banks rarely staff in-house, so fleet growth feeds directly into contract value. BancNet reported 29,453 connected teller machines at the end of 2025, up 6.5% from 27,659, according to The Philippine Star. The same annual report listed 103 members, including banks, e-money issuers, cooperatives and independent teller machine deployers. Philippine Seven and Seven Bank's local unit had installed 2,500 cash recyclers in 7-Eleven stores by January 2024, with 500 more planned, according to the Daily Tribune. As a result, shared and white-label ATMs grow fastest at 11.29% a year among location types.
Why does steady cash use keep replenishment work busy?
Many Filipinos still withdraw wages, remittances and government aid as cash, which keeps armored crews and cash centers busy even while digital payments grow. ATM withdrawals reached PHP 185.2 billion in September 2024 across 39.1 million transactions, both up 10% from a year earlier, according to the Philippine Daily Inquirer citing central bank data. The Bangko Sentral ng Pilipinas reported in its Status of Digital Payments report of July 2025 that digital payments made up 57.4% of retail transaction volume in 2024. That still leaves a large share of retail payments in cash, which machines must supply. In turn, cash management and replenishment holds 34.0% of 2025 value.
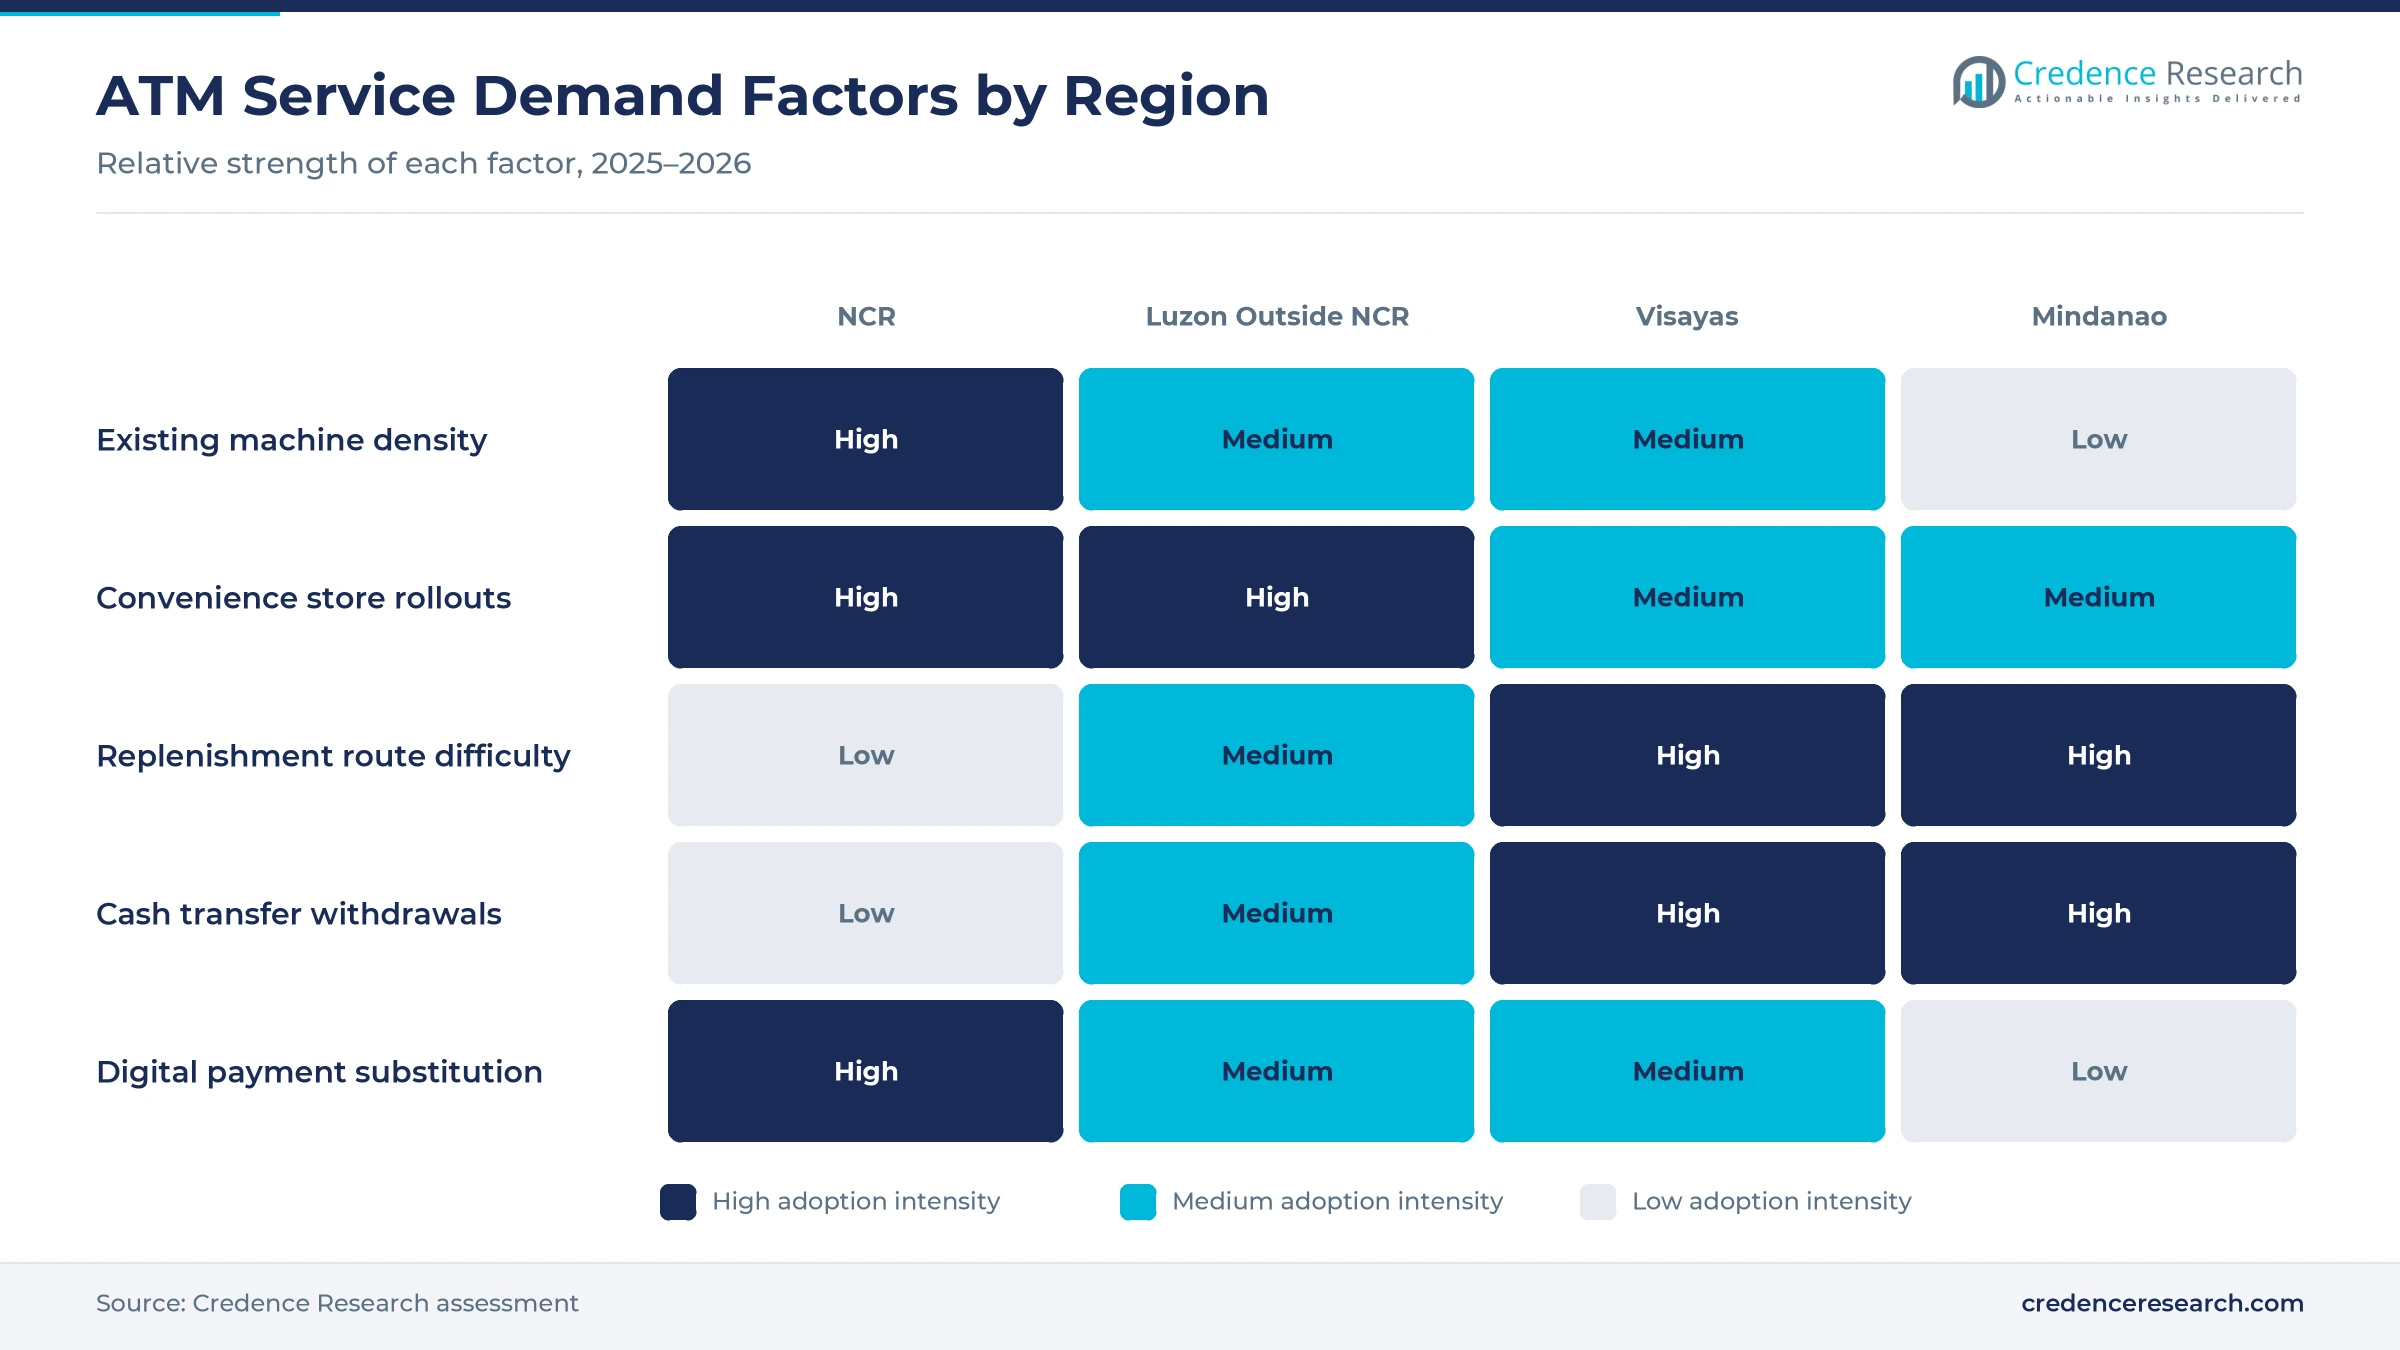
How does bank outsourcing raise service-level standards?
Providers are paid to hit uptime and cash availability targets that in-house teams often missed, so outsourcing deals push service levels higher across bank fleets. Union Bank of the Philippines moved maintenance and management of more than 400 ATMs to an as-a-service model, according to a Business Wire release from July 2023. Euronet bought 500 non-branch ATMs from the Bank of the Philippine Islands in January 2023 and runs 200 of them under BPI branding through outsourcing, according to GMA News. LANDBANK sought 79 machines from Diebold Nixdorf Philippines with four years of maintenance support in a June 2024 request. As a result, fully managed ATM services hold 41.0% of 2025 value.
Why does thin ATM coverage leave room for new machines?
The Philippines still has far fewer machines per adult than most neighbors, which leaves room for new deployments and the service work they bring. The Philippines had 27.8 ATMs per 100,000 adults in 2024, against 93.0 in Thailand, 52.2 in Malaysia and 45.6 in Indonesia, according to the World Bank. IMF Financial Access Survey data show the national count at 23,267 machines in 2024, little changed from 23,422 in 2022. A Philippine Institute for Development Studies review found that cash card access for conditional cash transfer families depended on nearby ATMs. In turn, coverage gaps in provincial towns keep drawing new machines and the service contracts attached to them.
Cash recyclers, service contracts and switch upgrades
How is the rise of cash recyclers changing replenishment?
Machines that take deposits and pay out the same notes need fewer armored trips, so recycler rollouts are cutting the cost of each cash visit. Seven Bank's Philippine unit began running cash recycling ATMs in 7-Eleven stores in February 2021 under a managed service from the Hitachi group, which Hitachi called the first large-scale use of such machines in the country. Bank of Commerce announced in July 2023 that it would install 300 ATMs and cash recycling machines, backed by a PHP 1 billion technology budget, according to Context.ph. Recyclers also let store chains deposit daily takings on site. As a result, demand grows for cash handling devices and the forecasting software that runs them.
Why is the shift to as-a-service contracts gathering pace?
Banks prefer predictable monthly fees to large capital outlays for machines that age quickly, which is pulling more fleets into as-a-service contracts. NCR Atleos completed its spin-off from NCR Voyix on Oct. 16, 2023, becoming a company focused on self-service banking and ATM network operations, according to Business Wire. Union Bank of the Philippines had already moved its full fleet of more than 400 machines to the NCR model. Euronet runs 200 BPI-branded machines under an outsourcing contract alongside its own independent network. In turn, ATM-as-a-service grows at 11.71% a year, and banks shift spending away from teller machine hardware purchases.
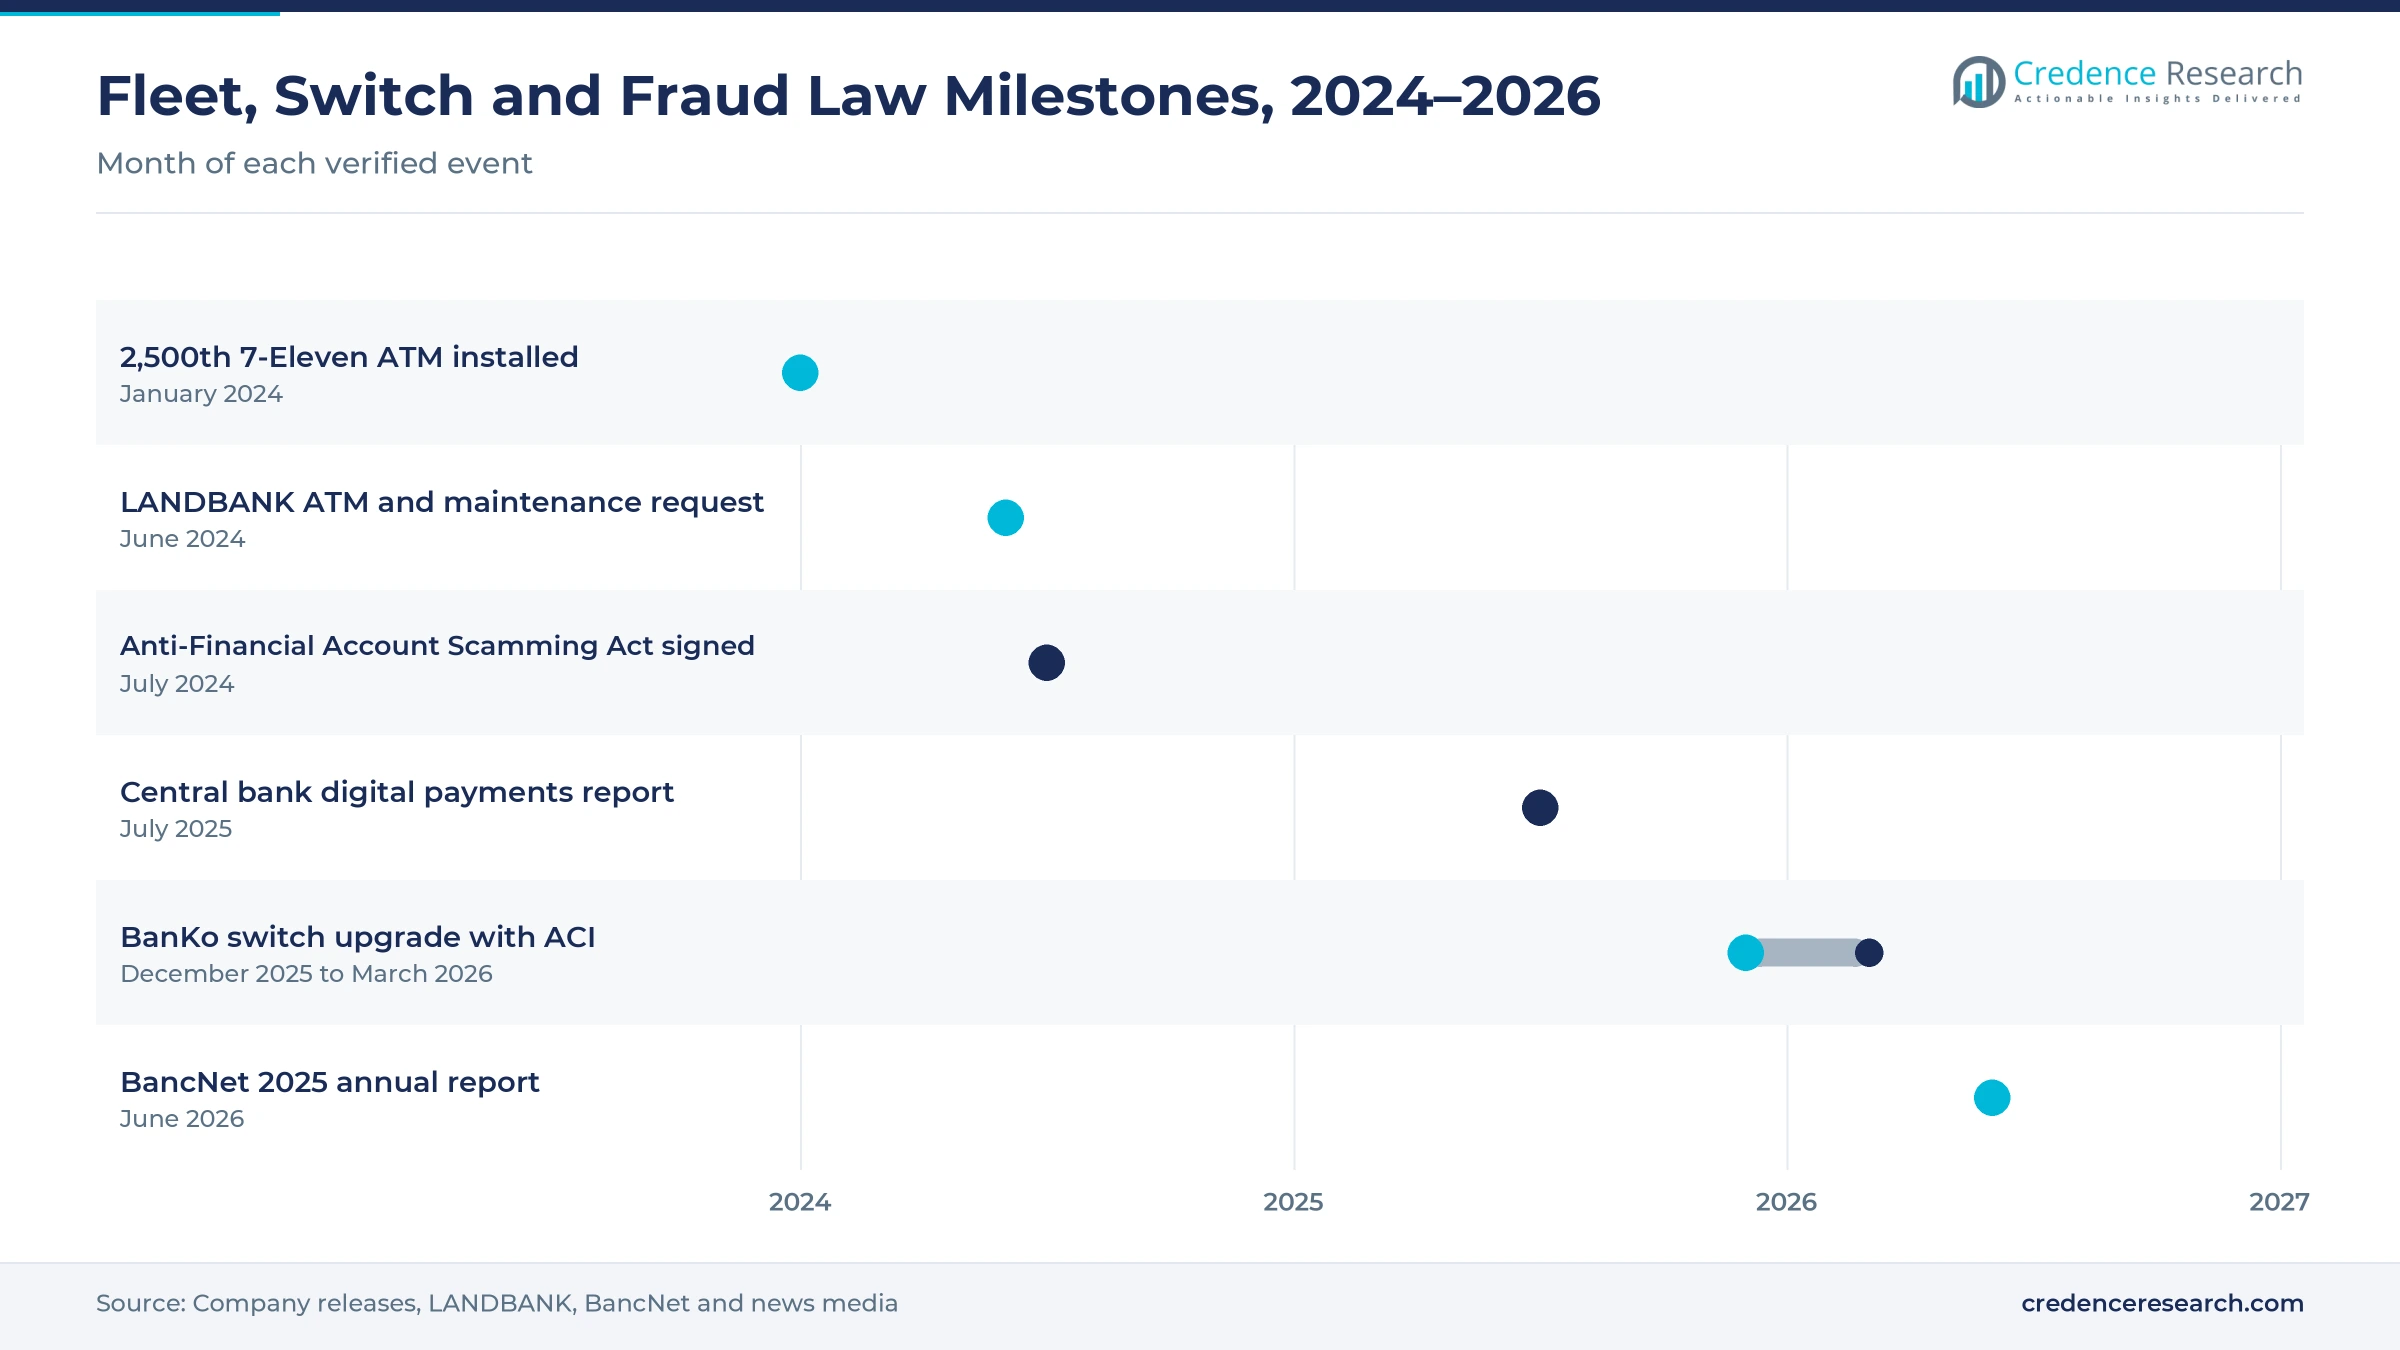
Can switch modernization open new network service work?
Banks are replacing older switching systems that route ATM, card and mobile transactions, and each upgrade creates integration and monitoring work for providers. BPI's microfinance arm BanKo selected an ACI Worldwide issuing and acquiring platform in December 2025, with go-live expected by the end of the first quarter of 2026, according to Business Wire. BancNet said InstaPay made up 82.19% of its 5.67 billion approved transactions in 2025, which raises the load on shared switching. BancNet also plans cross-border interoperability and more investment in network security. As a result, transaction processing and network management gains work as digital payments and cross-border transfers share the same rails.
Is tighter fraud law an opening for security services?
Banks must now prove they have adequate fraud controls across every channel, which opens steady work for security and compliance providers. The Anti-Financial Account Scamming Act, Republic Act 12010, was signed on July 20, 2024, and requires supervised institutions to keep adequate risk and fraud management systems, according to the Philippine News Agency. In May 2023, criminals in Daet opened an ATM casing and used a malware-loaded USB device to take an estimated PHP 1 million, according to the Manila Bulletin. The same law lets the central bank examine accounts tied to scams and requires banks, agencies and the private sector to cooperate on enforcement. In turn, security and compliance management grows at 11.14% a year.
Fee limits, island logistics and attacks raise costs
How do fee limits squeeze ATM economics?
Banks carry most of the cost of cash, repair and network links, while withdrawal fees stay under close central bank review. A moratorium on ATM fee changes ran from 2013 until 2019, and banks must still apply to the Bangko Sentral ng Pilipinas before changing fees. As a result, the Bankers Association of the Philippines said weak fee income slowed machine growth. Providers respond with shared fleets and per-ATM pricing that lowers each bank's fixed cost.
Why does island logistics raise service costs?
Armored crews and technicians must reach machines spread across thousands of islands and mountain towns, which pushes up the cost of each visit. Typhoons and floods also close roads and cut power, which leaves machines offline when families need cash most. In turn, cost per visit in remote Visayas and Mindanao towns runs well above Metro Manila levels. LANDBANK uses mobile ATMs on vehicles to serve disaster areas, and providers use cash forecasting to cut unneeded trips.
How do digital payments limit withdrawal growth?
QR payments and real-time transfers now replace some cash purchases in cities, which caps withdrawal growth at urban machines. InstaPay made up 82.19% of BancNet transactions in 2025, and the central bank aims for 60% to 70% of retail transaction volume to be digital by 2028. As a result, some urban machines see fewer withdrawals and lower returns. Banks respond by moving machines to busier sites and turning units into recyclers that also accept deposits.
Why do physical and malware attacks raise risk costs?
A single compromised machine can lose large sums and damage customer trust, so banks now budget more for protection across older fleets. The May 2023 jackpotting case in Daet showed how outdated software and exposed USB ports can be exploited. In turn, banks must fund software updates, anti-skimming kits, alarm links and stronger safes across older fleets. Providers respond with remote monitoring, encrypted hard disks and faster patch cycles that cut the window for attack.
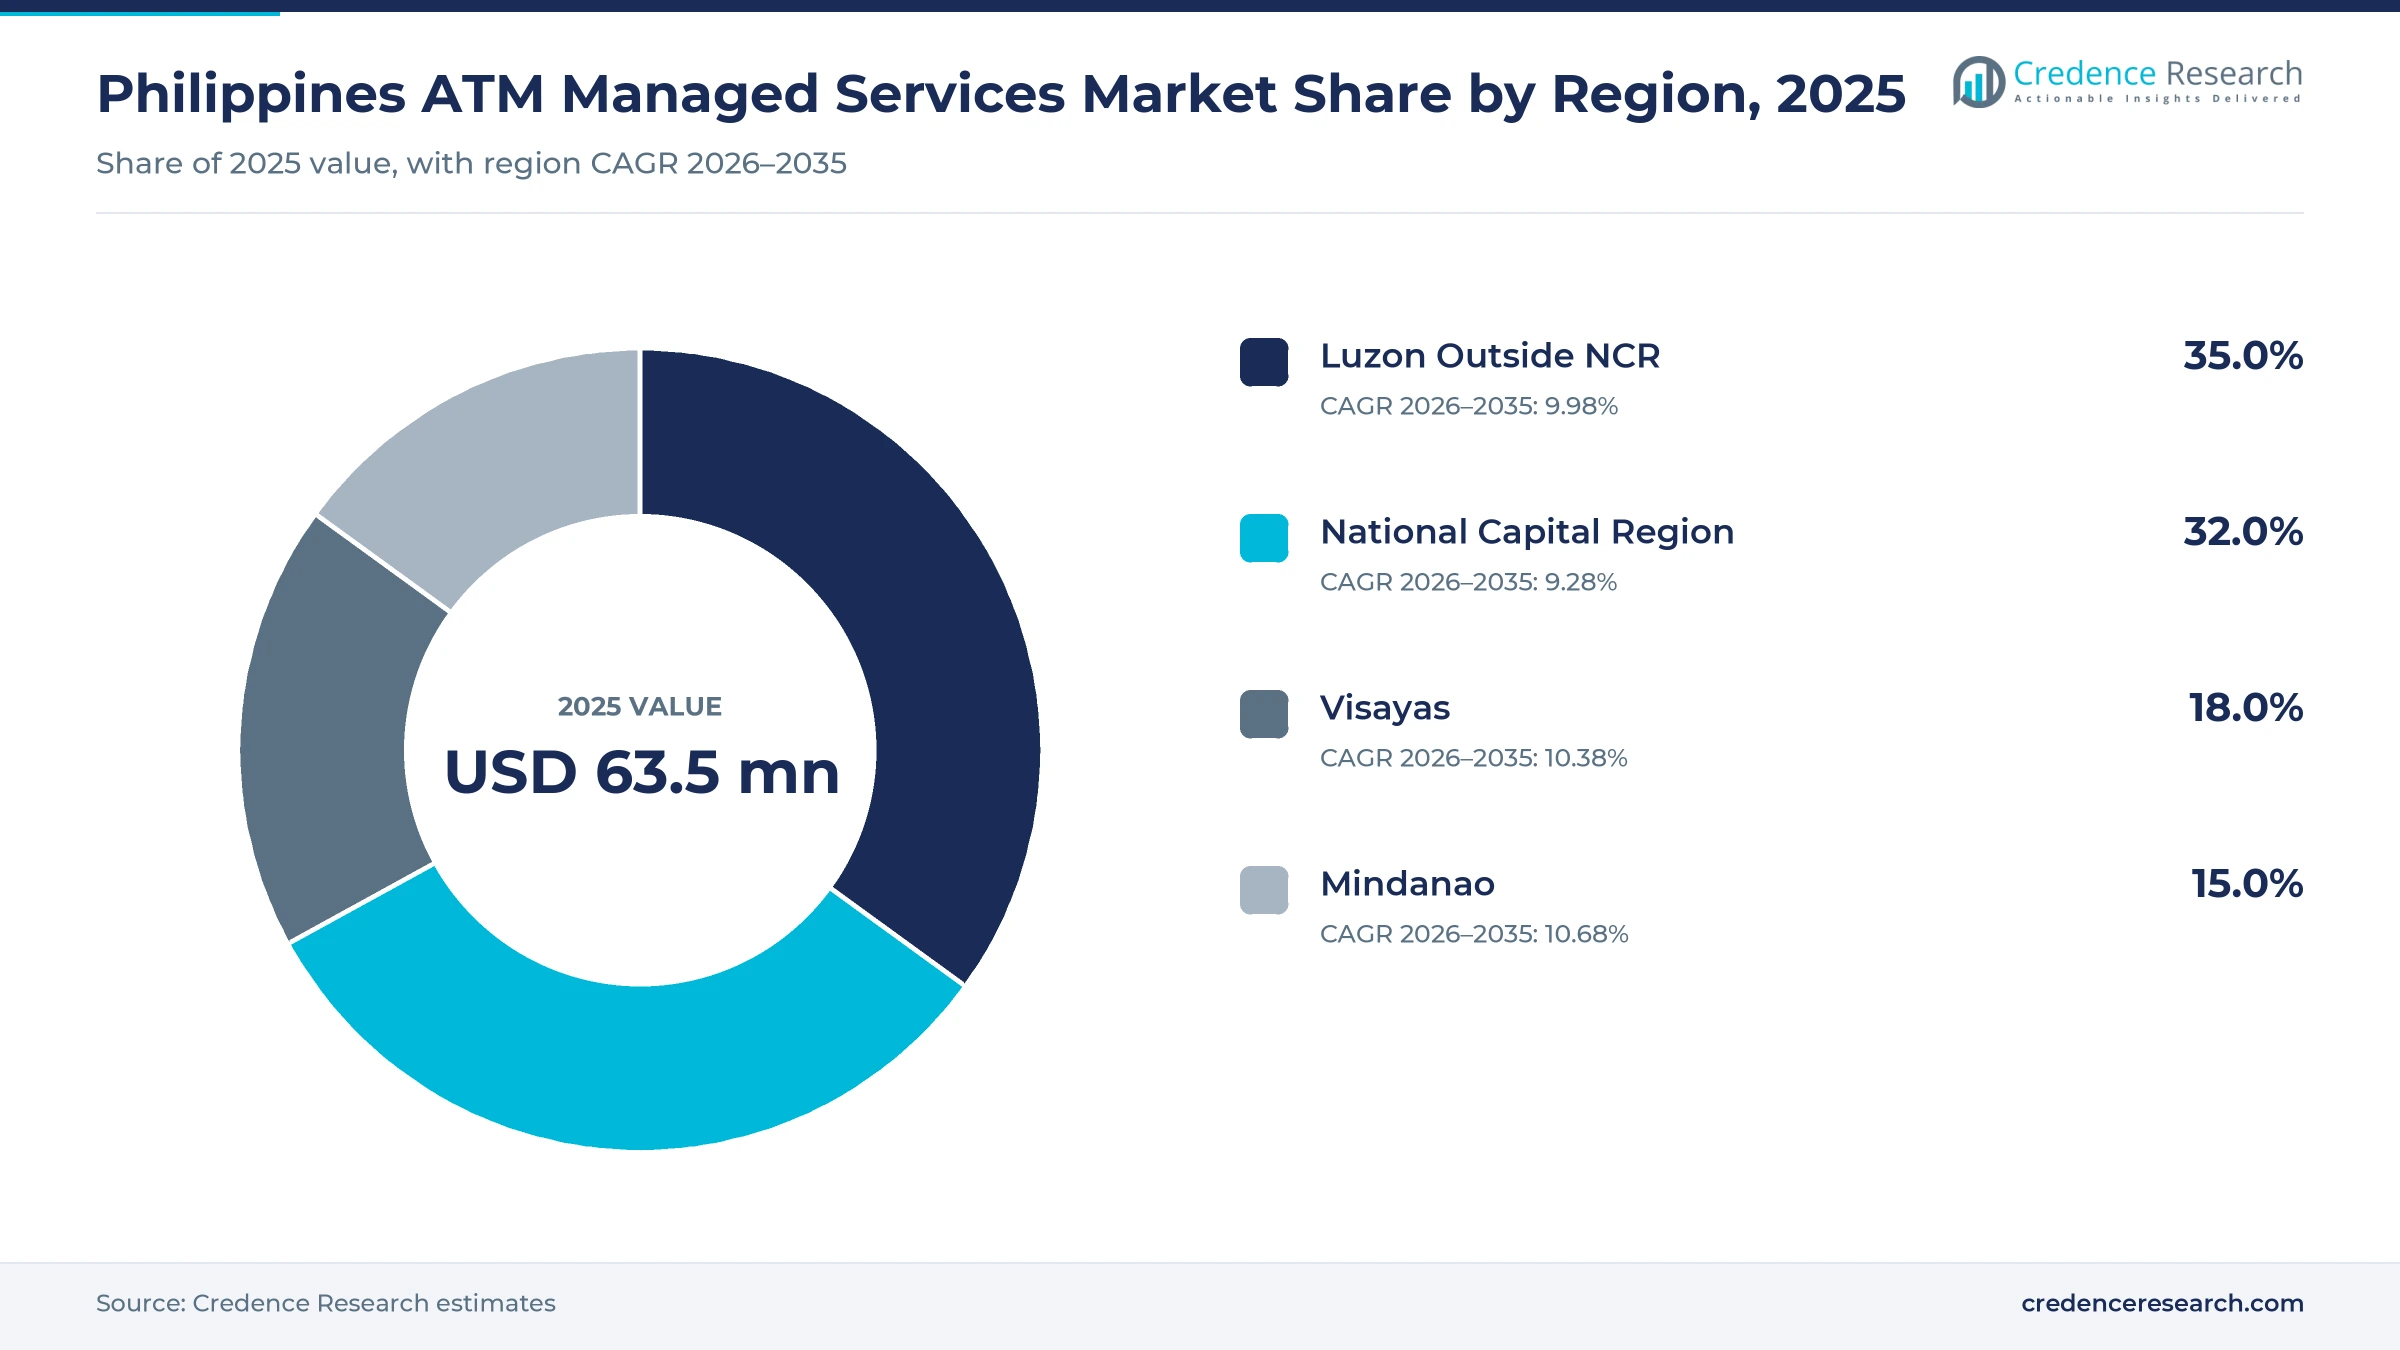
Luzon outside NCR leads while Mindanao grows fastest
| Region | Value, 2025 (USD million) | Share, 2025 | CAGR, 2026–2035 |
|---|---|---|---|
| Luzon Outside NCR | 22.2 | 35.0% | 9.98% |
| National Capital Region | 20.3 | 32.0% | 9.28% |
| Visayas | 11.4 | 18.0% | 10.38% |
| Mindanao | 9.5 | 15.0% | 10.68% |
Which provinces give Luzon its larger service base?
Luzon Outside NCR held 35.0% of 2025 value and grows at 9.98% a year, because Central Luzon, Calabarzon and northern provinces host many off-site machines in malls, stores and town centers. Philippine Seven first targeted Metro Manila and major Luzon markets for its 7-Eleven cash recyclers. LANDBANK placed six of its first ten mobile ATMs in Luzon in August 2022. As a result, the region needs frequent cash runs over long road distances.
How do Metro Manila contracts differ from provincial ones?
National Capital Region held 32.0% of 2025 value and grows at 9.28% a year, because most bank head offices, branches and busy off-site sites cluster in Metro Manila. Bank of Commerce began its rollout of new ATMs and cash recycling machines in key Metro Manila branches in 2023. However, high machine density and digital payment use slow new deployments here. In turn, contracts in the capital focus on uptime, security and recycler upgrades.
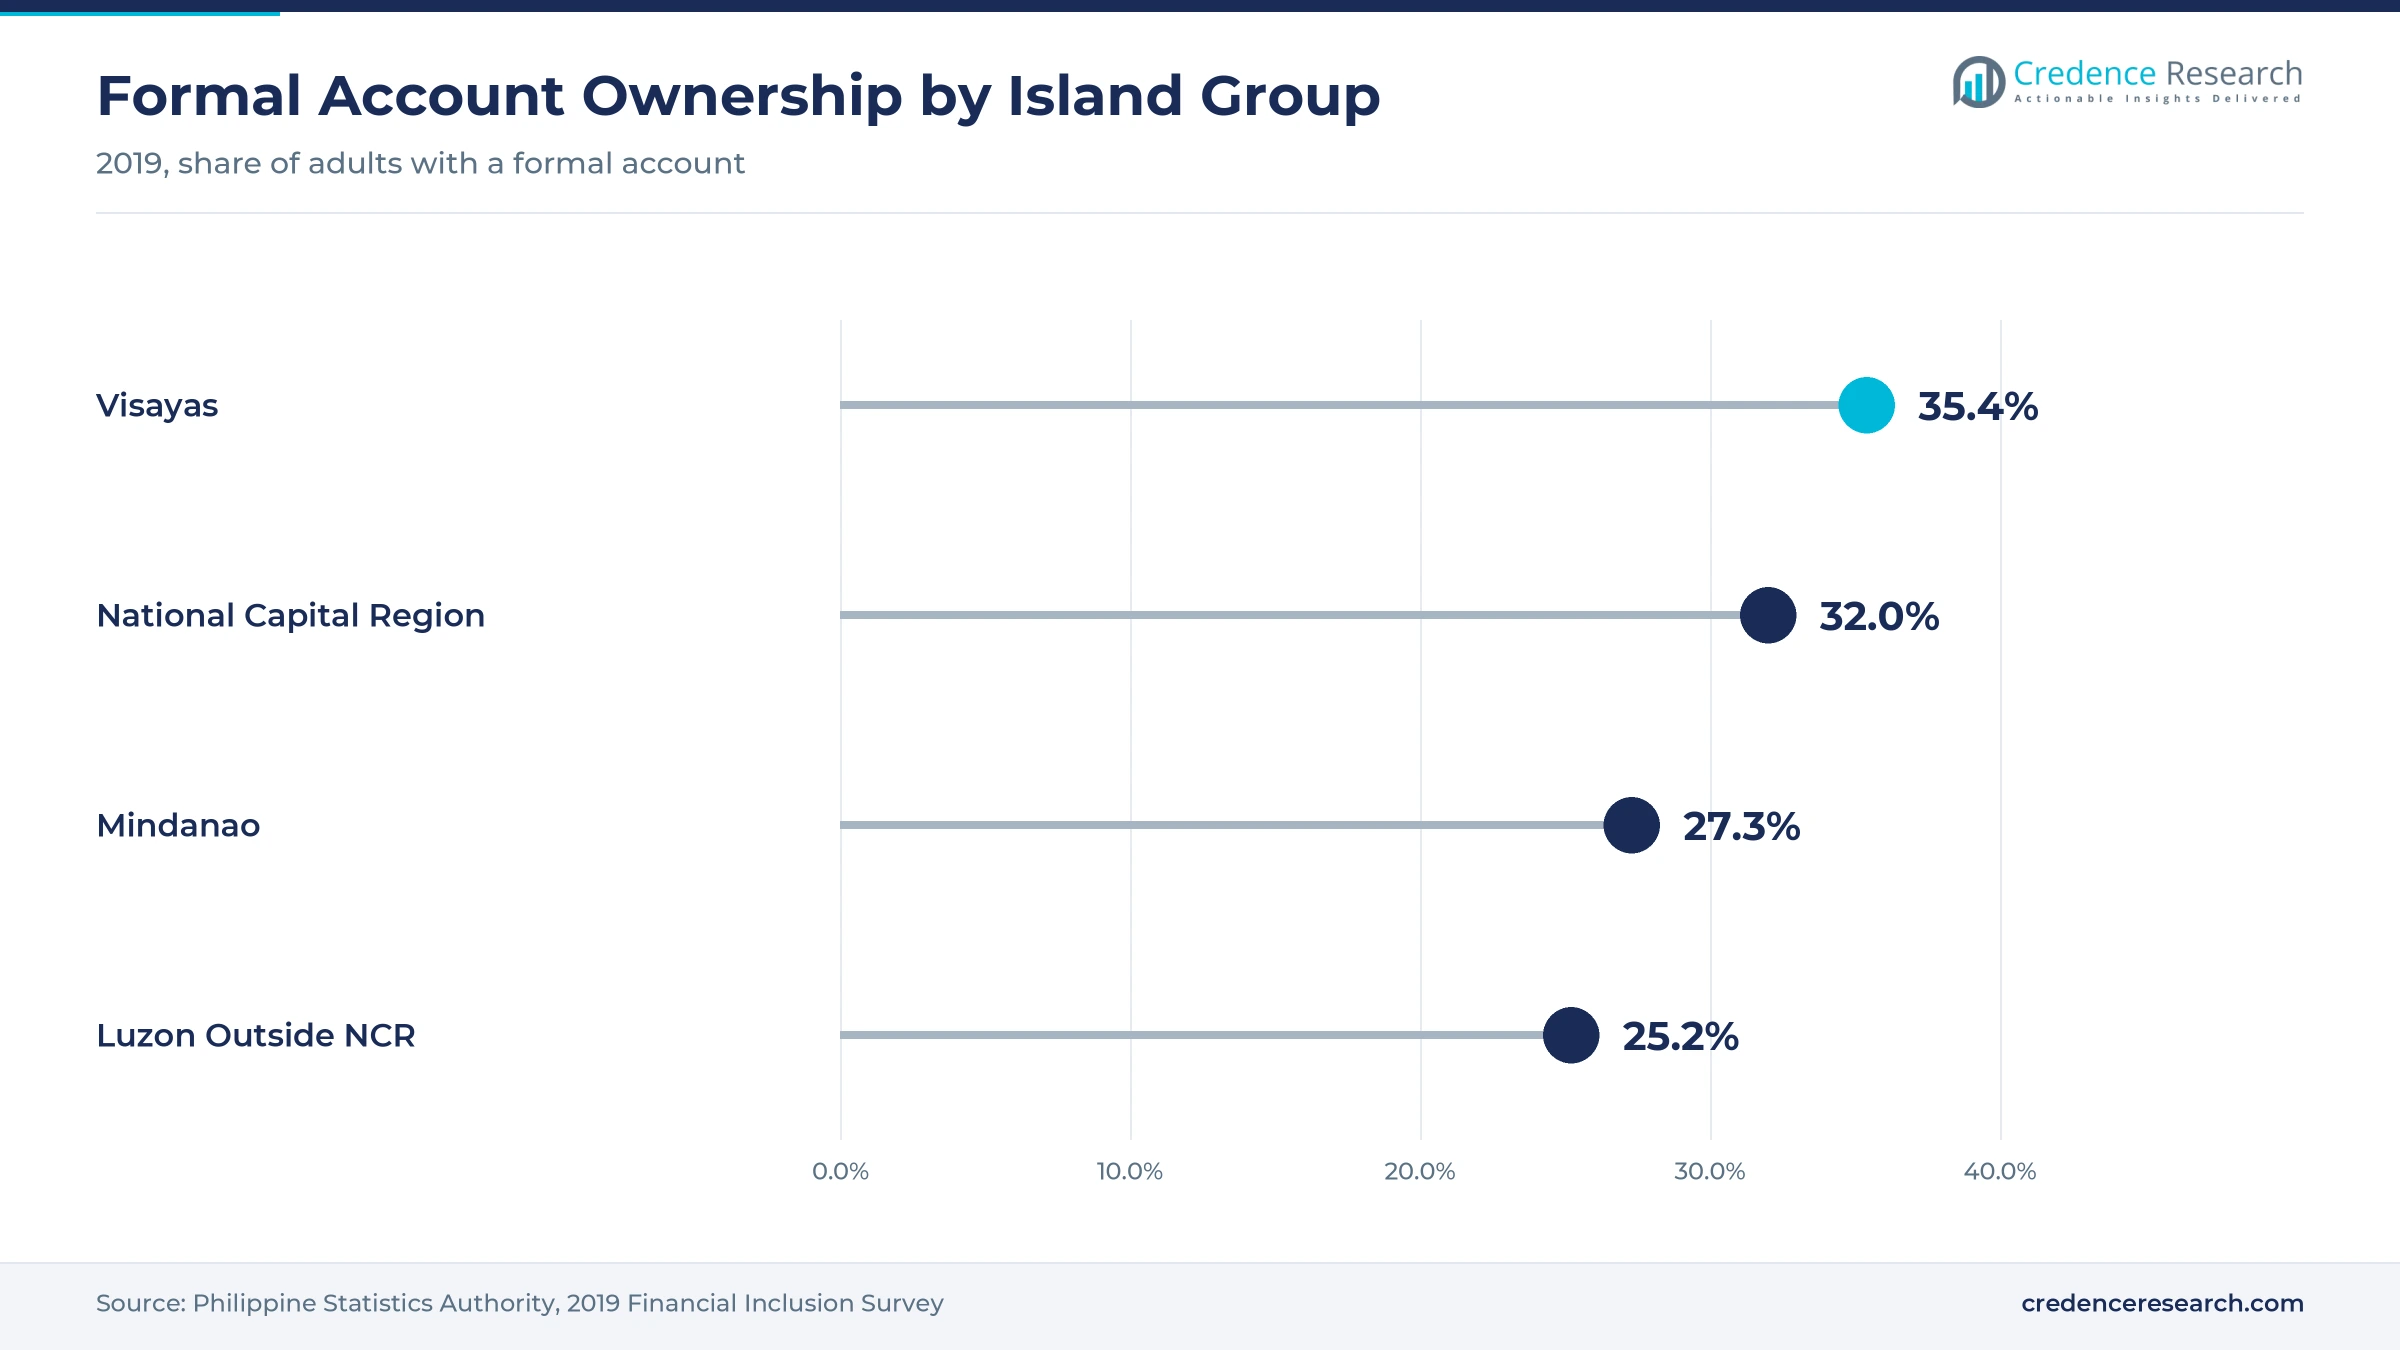
Why are the Visayas adding convenience store machines?
Visayas held 18.0% of 2025 value and grows at 10.38% a year, because Cebu, Iloilo and other island cities draw store chains and bank expansion. The 2,500th 7-Eleven ATM was installed in Iloilo City, according to the Daily Tribune, and Cebu City hosts more than 150 of these machines, according to Malaya Business Insight. Visayas also recorded the highest formal account ownership among island groups in 2019. As a result, replenishment routes across the island group keep growing longer.
How is Mindanao becoming the fastest-growing region?
Mindanao held 15.0% of 2025 value and grows fastest at 10.68% a year, because banks and store chains are extending coverage into cities that still have few machines per adult. 7-Eleven ATMs have reached Davao City, according to Malaya Business Insight, and LANDBANK stationed two mobile ATMs in Mindanao. Cash transfer families in rural towns still rely on nearby machines to collect grants. In turn, providers that can staff remote routes gain contracts.
Fleet, switch and fraud law milestones since 2024
| Development | Status and market relevance |
|---|---|
| In June 2024, LANDBANK sought 79 ATMs from Diebold Nixdorf Philippines with four years of maintenance support and spare parts. | Bundles machines with multiyear service |
| In July 2024, the President signed the Anti-Financial Account Scamming Act, which requires adequate fraud management systems at supervised institutions. | Raises demand for security and compliance services |
| In July 2025, the Bangko Sentral ng Pilipinas reported that digital payments reached 57.4% of retail transaction volume in 2024, up from 52.8% in 2023. | Shows cash still carries a large share of payments |
| In December 2025, BPI's BanKo selected ACI Worldwide's issuing and acquiring platform to replace its switching system, with go-live targeted for early 2026. | Modernizes switching for ATM and card traffic |
| In June 2026, BancNet reported 29,453 connected teller machines and 103 members at the end of 2025 in its annual report. | Confirms continued growth in the shared ATM base |
Remote monitoring and forecasting software cut ATM downtime
- Cash recycling machines accept deposits and pay the same notes out again, which cuts armored trips to busy store and branch sites.
- Remote monitoring platforms track faults, cash levels and tampering in real time, which lets providers send crews before machines go offline.
- Cash forecasting software predicts withdrawals by site and day, which reduces idle cash and unneeded replenishment visits across islands.
- Modern transaction switches route ATM, card and mobile traffic on open platforms, which helps banks add services and meet uptime targets.
Need a Custom Version of This Report?
Tailor the scope, geography, or segments to your exact requirements.
- Custom geography or segment scope
- Direct access to our analyst team
Vendors, switch operators and deployers compete on uptime
Competition includes machine makers that sell service contracts, switch operators, independent deployers and payment software vendors. NCR Atleos competes through its ATM-as-a-service model, which Union Bank of the Philippines uses for more than 400 machines. Diebold Nixdorf competes through bank supply deals that bundle machines with maintenance, such as the LANDBANK request of 2024. BancNet runs the main shared switch that links most bank and deployer machines. Euronet runs an independent network and outsourced BPI machines, while the Hitachi group supports cash recyclers in 7-Eleven stores through a managed service. ACI Worldwide supplies switching software to banks such as BanKo, linking machine traffic to core banking systems. Providers compete on uptime, cash availability, national reach and security, because banks now judge contracts against service levels.
Which providers shape ATM services in the Philippines?
| Company | Type | Role in the market |
|---|---|---|
| NCR Atleos Corporation | ATM maker and service provider | Runs ATM-as-a-service for Union Bank of the Philippines |
| Diebold Nixdorf, Inc. | ATM maker and service provider | Supplies LANDBANK machines with four-year maintenance support |
| BancNet, Inc. | Switch operator | Links 29,453 teller machines and 103 members |
| Euronet Worldwide, Inc. | Independent deployer | Runs former BPI non-branch ATMs, 200 under outsourcing |
| Hitachi Channel Solutions, Corp. | ATM maker and service provider | Provides cash recyclers and managed service for 7-Eleven ATMs |
| ACI Worldwide, Inc. | Payment software vendor | Supplies the new switching platform for BPI's BanKo |
Credence Research view on outsourced ATM operations
Credence Research's view is that ATM services in the Philippines will grow faster than the machine count, because banks are handing more of each machine's operation to outside providers. Cash management stays the largest service line, while security work and ATM-as-a-service contracts add the fastest growth. Convenience store fleets and independent deployers will keep extending coverage into provincial towns, especially in Mindanao and the Visayas. Providers that combine cash logistics, remote monitoring and fraud controls under one service level should gain the most, while fee limits and digital payments cap returns on weaker urban sites.
How the ATM service estimate was built
The report uses 2025 as the base year on a calendar basis, and market values come from the Credence Research model. That model combines IMF Financial Access Survey and World Bank machine counts, BancNet network data, central bank payment statistics, bank tender documents and company releases. Regional shares follow the Credence Research regional model, while regional growth rates and all segment splits are Credence Research estimates. Sources used are official statistics, regulatory and government releases, company pages and news media, and no interviews or surveys were used.
Outsourcing and wider coverage carry growth to 2035
The Philippines ATM managed services market is expected to reach USD 164.6 million by 2035, a 9.94% CAGR during 2026–2035, as banks outsource more of their fleets and machines spread into provincial towns. Growth should be strongest in security services, shared and white-label machines, ATM-as-a-service contracts and Mindanao, because these areas gain most from new coverage and tighter fraud rules. Steady cash withdrawals will keep replenishment work large, while fee limits, island logistics and wider digital payments could slow returns on some urban machines.
Frequently Asked Questions
How big is the Philippines ATM managed services market?
Which service type leads ATM outsourcing in the Philippines?
Which region leads the Philippine market?
How many ATMs does BancNet connect?
Are Filipinos still using ATMs as digital payments grow?
Why are Philippine banks outsourcing ATM operations?
Who are the leading companies in the Philippine market?
What are the main challenges for ATM service providers?
Table of Content
Chapter 1 Market Segmentation
- 1.1 Segmentation Framework
- 1.1.1 Product and Service Classification
- 1.1.2 Application and End-Use Classification
- 1.1.3 Technology and Solution Classification
- 1.1.4 Customer and Distribution Channel Classification
- 1.1.5 Geographic Segmentation
- 1.1.6 Market Segment Definitions and Boundaries
- 1.2 By Service Type
- 1.2.1 Cash Management and Replenishment
- 1.2.2 ATM Repair and Maintenance
- 1.2.3 Transaction Processing and Network Management
- 1.2.4 Security and Compliance Management
- 1.2.5 Site and Content Management
- 1.3 By ATM Location
- 1.3.1 On-Site ATMs
- 1.3.2 Off-Site ATMs
- 1.3.3 Mobile and Event ATMs
- 1.3.4 Shared and White-Label ATMs
- 1.4 By End User
- 1.4.1 Banks and Financial Institutions
- 1.4.2 Independent ATM Deployers
- 1.4.3 Retail and Convenience Operators
- 1.4.4 Government, Transport and Hospitality Sites
- 1.5 By Delivery Model
- 1.5.1 Fully Managed ATM Services
- 1.5.2 Modular Managed Services
- 1.5.3 ATM-as-a-Service
- 1.5.4 Co-Managed Operations
Chapter 2 Introduction
- 2.1 Report Objectives and Scope
- 2.2 Product Definition and Industry Terminology
- 2.3 Market Inclusions and Exclusions
- 2.4 Research Process
- 2.4.1 Primary Research and Expert Interviews
- 2.4.2 Secondary Research and Source Review
- 2.4.3 Top-Down and Bottom-Up Estimation
- 2.4.4 Data Triangulation and Verification
- 2.5 Market Size Measurement Basis
- 2.5.1 2025: USD 63.5 million → 2035: USD 164.6 million
- 2.6 Historical and Forecast Reference Periods
- 2.6.1 Historical Period: 2018-2025
- 2.6.2 Base Year: 2025
- 2.6.3 Forecast Period: 2025-2035
- 2.7 Research Assumptions and Limitations
Chapter 3 Executive Summary
- 3.1 Market Snapshot and Key Findings
- 3.2 Base-Year Market Size, 2025
- 3.3 Forecast Market Size, 2035
- 3.4 Revenue and Volume Growth Outlook
- 3.5 Key Demand and Supply Indicators
- 3.6 Leading Market Segments
- 3.7 Fastest-Growing Market Opportunities
- 3.8 Regional Performance Highlights
- 3.9 Technology and Industry Transformation
- 3.10 Competitive Landscape Summary
- 3.11 Analyst View and Strategic Implications
Chapter 4 Philippines ATM Managed Services Market Trends and Developments
- 4.1 Historical Industry Development, 2018-2025
- 4.2 Recent Market Trends and Developments
- 4.3 Demand and Customer Behavior Trends
- 4.4 Technology and Product Innovation
- 4.5 Artificial Intelligence, Automation and Digitalization
- 4.6 Local Manufacturing and Supply Chain Realignment
- 4.7 Industry Partnerships, Mergers and Acquisitions
- 4.8 Sustainability and Circular Economy Developments
- 4.9 Government and Private Sector Investment Trends
- 4.10 Emerging Business Models and Commercialization
- 4.11 Industry Developments and Announcements
Chapter 5 Philippines ATM Managed Services Market Supply and Demand Analysis
- 5.1 Demand Trend and Consumption Analysis, 2018-2025
- 5.2 Demand Forecast, 2025-2035
- 5.3 Supply Chain Structure and Procurement Trends
- 5.4 Supply-Demand Gap and Bottlenecks
- 5.5 Import Dependence and Sourcing Structure
- 5.6 Regional Supply and Demand Concentration
Chapter 6 Philippines ATM Managed Services Market Pricing Analysis
- 6.1 Pricing Structure and Measurement
- 6.2 Historical Pricing Trends, 2018-2025
- 6.3 Pricing Outlook, 2025-2035
- 6.4 Pricing by Product and Market Segment
- 6.5 Geographic Pricing Differences
- 6.6 Key Input, Energy, Labor and Logistics Costs
- 6.7 Contract Pricing and Purchasing Models
- 6.8 Pricing Sensitivity and Competitive Positioning
- 6.9 Price, Margin and Profitability Implications
Chapter 7 Philippines ATM Managed Services Market Dynamics
- 7.1 Market Growth Drivers
- 7.1.1 Demand-Side Drivers
- 7.1.2 Technology and Innovation Drivers
- 7.1.3 Infrastructure and Investment Drivers
- 7.1.4 Regulatory and Policy Drivers
- 7.2 Market Restraints
- 7.2.1 Cost and Affordability Constraints
- 7.2.2 Technology and Adoption Barriers
- 7.2.3 Supply Chain and Operational Constraints
- 7.3 Market Challenges
- 7.3.1 Competitive Pressure and Margin Erosion
- 7.3.2 Skills, Infrastructure and Implementation Gaps
- 7.4 Emerging Market Opportunities
- 7.5 Market Dynamics Impact and Time-Horizon Assessment
Chapter 8 Philippines ATM Managed Services Value Chain Analysis
- 8.1 Industry Value Chain Overview
- 8.2 Upstream Suppliers and Critical Inputs
- 8.3 Technology and Component Providers
- 8.4 Manufacturing or Service Delivery
- 8.5 Distribution, Channel Partners and Integrators
- 8.6 Downstream Applications and End Users
- 8.7 Value Addition and Profit Pools
- 8.8 Vertical Integration and Outsourcing
- 8.9 Supplier Concentration and Risk
- 8.10 Supply Chain Localization and Resilience
Chapter 9 Philippines ATM Managed Services Market Regulations and Policies
- 9.1 Relevant Laws, Standards and Compliance Frameworks
- 9.2 Product, Service, Safety and Quality Requirements
- 9.3 Government Policies, Incentives and Subsidies
- 9.4 Imports, Exports and Trade Barriers
- 9.5 Public Procurement and Local Content Requirements
- 9.6 Data Protection, AI and Cybersecurity Compliance
- 9.7 Upcoming Policy Changes and Market Implications
Chapter 10 Philippines ATM Managed Services Market Hotspots and Opportunities
- 10.1 Market Opportunity Mapping and Growth Hotspots
- 10.2 High-Growth Applications and Customer Groups
- 10.3 Underserved Markets and White-Space Opportunities
- 10.4 Emerging Technology and Product Opportunities
- 10.5 New Capacity and Investment Hotspots
- 10.6 Market Entry and Expansion Opportunities
- 10.7 Distribution and Partnership Opportunities
- 10.8 Near-Term and Long-Term Commercial Potential
- 10.9 Opportunity Attractiveness and Execution Risks
Chapter 11 Philippines ATM Managed Services Market Outlook, 2025-2035
- 11.1 Market Size and Analysis
- 11.1.1 Revenue (Market Measurement: 2025: USD 63.5 million → 2035: USD 164.6 million)
- 11.1.2 Historical Market Size, 2018-2025
- 11.1.3 Base-Year Market Size, 2025
- 11.2 Market Forecast, 2025-2035
- 11.2.1 Revenue Forecast to 2035
- 11.2.2 CAGR and Year-on-Year Growth
- 11.2.3 Incremental Revenue Opportunity
- 11.3 Forecast Assumptions and Scenario Analysis
- 11.3.1 Base-Case Forecast
- 11.3.2 Optimistic and Conservative Scenarios
- 11.3.3 Technology, Pricing and Policy Sensitivities
- 11.4 Market Attractiveness and Growth Outlook
Chapter 12 Philippines ATM Managed Services Market Segmentation and Outlook
- 12.1 Segmentation Summary and Market Shares, 2025
- 12.2 Largest and Fastest-Growing Segments
- 12.3 By Service Type - Market Size and Forecast, 2025-2035
- 12.3.1 Segment Definition and Scope
- 12.3.2 Historical Market Size, 2018-2025
- 12.3.3 Revenue Forecast, 2025-2035
- 12.3.4 Base-Year Market Share, 2025
- 12.3.5 Segment CAGR and Growth Drivers
- 12.3.6 Subsegment Market Size and Forecast
- 12.3.6.1 Cash Management and Replenishment
- 12.3.6.2 ATM Repair and Maintenance
- 12.3.6.3 Transaction Processing and Network Management
- 12.3.6.4 Security and Compliance Management
- 12.3.6.5 Site and Content Management
- 12.3.7 Subsegment Pricing and Adoption Trends
- 12.3.8 Leading Suppliers and Competition
- 12.3.9 Regional Demand and Opportunities
- 12.4 By ATM Location - Market Size and Forecast, 2025-2035
- 12.4.1 Segment Definition and Scope
- 12.4.2 Historical Market Size, 2018-2025
- 12.4.3 Revenue Forecast, 2025-2035
- 12.4.4 Base-Year Market Share, 2025
- 12.4.5 Segment CAGR and Growth Drivers
- 12.4.6 Subsegment Market Size and Forecast
- 12.4.6.1 On-Site ATMs
- 12.4.6.2 Off-Site ATMs
- 12.4.6.3 Mobile and Event ATMs
- 12.4.6.4 Shared and White-Label ATMs
- 12.4.7 Subsegment Pricing and Adoption Trends
- 12.4.8 Leading Suppliers and Competition
- 12.4.9 Regional Demand and Opportunities
- 12.5 By End User - Market Size and Forecast, 2025-2035
- 12.5.1 Segment Definition and Scope
- 12.5.2 Historical Market Size, 2018-2025
- 12.5.3 Revenue Forecast, 2025-2035
- 12.5.4 Base-Year Market Share, 2025
- 12.5.5 Segment CAGR and Growth Drivers
- 12.5.6 Subsegment Market Size and Forecast
- 12.5.6.1 Banks and Financial Institutions
- 12.5.6.2 Independent ATM Deployers
- 12.5.6.3 Retail and Convenience Operators
- 12.5.6.4 Government, Transport and Hospitality Sites
- 12.5.7 Subsegment Pricing and Adoption Trends
- 12.5.8 Leading Suppliers and Competition
- 12.5.9 Regional Demand and Opportunities
- 12.6 By Delivery Model - Market Size and Forecast, 2025-2035
- 12.6.1 Segment Definition and Scope
- 12.6.2 Historical Market Size, 2018-2025
- 12.6.3 Revenue Forecast, 2025-2035
- 12.6.4 Base-Year Market Share, 2025
- 12.6.5 Segment CAGR and Growth Drivers
- 12.6.6 Subsegment Market Size and Forecast
- 12.6.6.1 Fully Managed ATM Services
- 12.6.6.2 Modular Managed Services
- 12.6.6.3 ATM-as-a-Service
- 12.6.6.4 Co-Managed Operations
- 12.6.7 Subsegment Pricing and Adoption Trends
- 12.6.8 Leading Suppliers and Competition
- 12.6.9 Regional Demand and Opportunities
- 12.7 Segment Growth Comparison
- 12.8 Segment Attractiveness and Priority Matrix
Chapter 13 Philippines ATM Managed Services End-Use and Application Market Outlook
- 13.1 End-Use Industry and Customer Demand Structure
- 13.2 Leading Applications and Customer Groups
- 13.3 End-Use Market Size, Share and Forecast
- 13.4 Major End-Use Industry Deep Dives
- 13.4.1 Customer Requirements and Use Cases
- 13.4.2 Demand and Replacement Cycles
- 13.4.3 Technical and Regulatory Considerations
- 13.4.4 Purchasing and Procurement Models
- 13.4.5 Leading Vendors and Distribution Channels
- 13.4.6 Forecast and Commercial Opportunities
- 13.5 Emerging Applications and Cross-Segment Demand
- 13.6 End-Use Industry Investment Priorities
Chapter 14 Philippines ATM Managed Services Geographic Market Outlook, 2025-2035
- 14.1 Domestic Market Distribution and Demand Clusters
- 14.2 State- or Province-Wise Market Size and Forecast, 2025-2035
- 14.3 City and Metropolitan Market Outlook
- 14.4 Industrial, Manufacturing and Commercial Clusters
- 14.5 Geographic Concentration of Key End Users
- 14.6 Local Pricing and Purchasing Differences
- 14.7 Domestic Production Facilities and Capacity Map
- 14.8 Local Infrastructure and Project Pipeline
- 14.9 State-Level Policy and Incentive Differences
- 14.10 Subnational Investment Hotspots and Opportunities
- 14.11 Distribution and Logistics Networks
- 14.12 Domestic Competitive Footprint
Chapter 15 Philippines ATM Managed Services Technology, Innovation and Sustainability Outlook
- 15.1 Technology Landscape and Maturity
- 15.2 Product, Process and Service Innovation
- 15.3 AI, Automation and Digital Tools in the Industry
- 15.4 Technology Adoption and Performance Benchmarking
- 15.5 Innovation Pipeline and R&D Investment
- 15.6 Energy Efficiency and Resource Management
- 15.7 Sustainability, Recycling and Circularity
- 15.8 Technology Roadmap, 2025-2035
- 15.9 Risks of Obsolescence and Technology Substitution
Chapter 16 Philippines ATM Managed Services Market Key Strategic Imperatives
- 16.1 Growth and Market Entry Priorities
- 16.2 High-Return Products and Segments
- 16.3 Pricing, Profitability and Cost Optimization
- 16.4 Technology Investment and Product Differentiation
- 16.5 Supply Chain Localization and Resilience
- 16.6 Distribution and Customer Acquisition
- 16.7 Partnership, Acquisition and Capacity Strategy
- 16.8 Regional Expansion Priorities
- 16.9 Short-, Medium- and Long-Term Actions
Chapter 17 Competition Outlook
- 17.1 Industry Competition Characteristics
- 17.2 Market Structure and Concentration
- 17.3 Market Share and Competitive Positioning, 2025
- 17.4 Company-Wise Revenue and Product Benchmarking
- 17.5 Production and Service Capacity Benchmarking
- 17.6 Technology, Pricing and Differentiation
- 17.7 Regional Footprint and Distribution Strength
- 17.8 Mergers, Acquisitions and Strategic Alliances
- 17.9 New Entrants and Competitive Threats
- 17.10 Porter's Five Forces and Industry Attractiveness
- 17.11 Competitive Outlook, 2025-2035
Chapter 18 Company Profiles
- 18.1 Company Coverage and Selection Criteria
- 18.2 NCR Atleos Corporation
- 18.2.1 Business Description
- 18.2.2 Company Ownership and Geographic Presence
- 18.2.3 Product and Service Portfolio
- 18.2.4 Manufacturing and Operating Footprint
- 18.2.5 Financial Performance and Investment
- 18.2.6 Market Share and Competitive Position
- 18.2.7 Technology and Innovation Capabilities
- 18.2.8 Strategic Alliances or Partnerships
- 18.2.9 Recent Developments
- 18.2.10 Growth Strategy and Outlook
- 18.3 Diebold Nixdorf, Inc.
- 18.4 BancNet, Inc.
- 18.5 Euronet Worldwide, Inc.
- 18.6 ACI Worldwide, Inc.
- 18.7 Fiserv, Inc.
- 18.8 Hyosung TNS Inc.
- 18.9 Hitachi Channel Solutions, Corp.
- 18.10 Glory Ltd.
- 18.11 G4S Cash Solutions Philippines, Inc.
- 18.12 Other Relevant Market Participants
Note: Every listed company is profiled on the structure shown under the first company. The company list is preliminary and may change based on research findings, market developments, data availability and client requirements.
Chapter 19 Disclaimer
- 19.1 Research and Forecast Disclaimer
- 19.2 Data Source and Estimation Limitations
Note: The depth of individual sections depends on data availability for this market. Volume, capacity, trade and other unit-based metrics are included where applicable.

