Banks now distribute cover that partner insurers underwrite
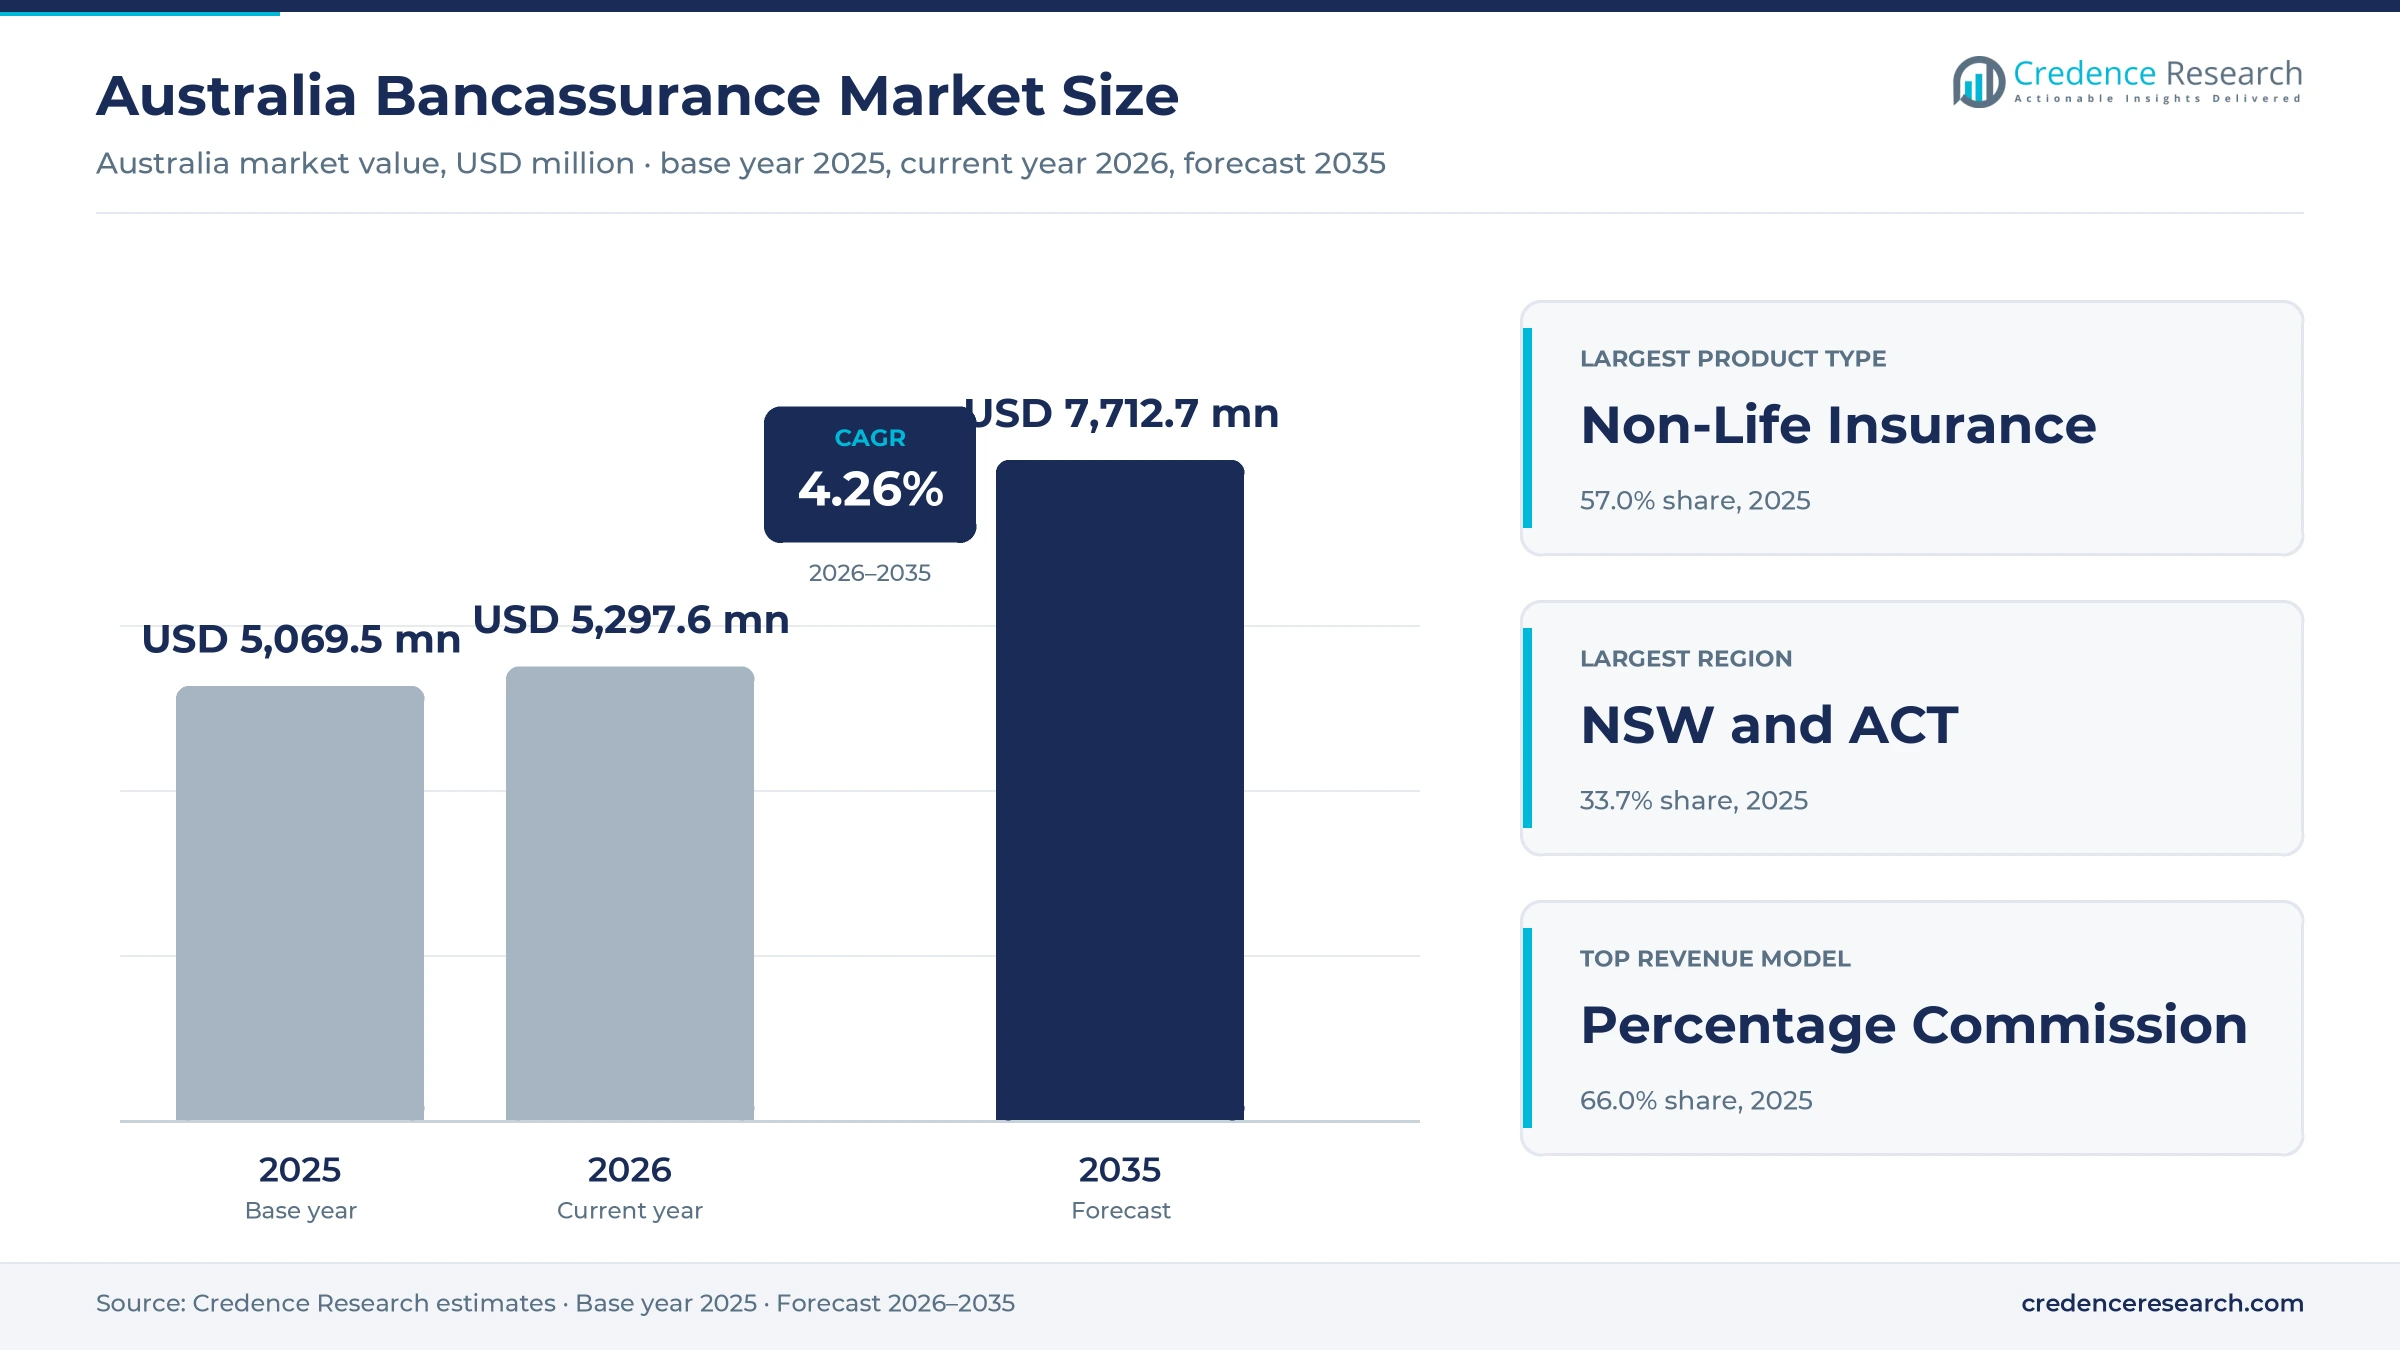
The Australia bancassurance market was valued at USD 5.07 billion in 2025 and is projected to increase from USD 5.30 billion in 2026 to USD 7.71 billion by 2035, registering a CAGR of 4.26% during 2026–2035. Demand comes from mortgage holders who need home cover, families buying life and income protection, and customers adding private health policies through their bank app. New South Wales and Australian Capital Territory held the largest regional share, 33.7% in 2025, because average loans are largest there and nearly a third of residents live in the zone. Western Australia, South Australia and Northern Territory is the fastest-growing zone at 4.65% a year, supported by the country's quickest population growth in Western Australia. Commercially, the four major banks no longer own most of the insurers they promote, having sold those businesses under long alliances that run up to 20 years. That change turns the market into a commission and referral business, with Treasury also proposing in July 2026 to extend add-on sale exemptions until 2031.
What does bank-sold insurance cover in Australia?
The market counts gross premium on life, general and private health policies that Australian banks sell or refer to partner insurers, whether through branches, contact centers or digital banking. New business and renewals are both included, because banks usually keep earning on policies that stay in force under their alliance agreements.
The estimate excludes broker-placed commercial cover, direct insurer sales, superannuation group life cover and complimentary card benefits that carry no separate premium. Along the value chain, insurers price and underwrite each policy, reinsurers absorb peak risks and banks provide the customer relationship, the disclosure and the point of sale.
Australia Bancassurance Market Insights
- The Australia bancassurance market grows from USD 5.07 billion in 2025 to USD 7.71 billion by 2035 at a 4.26% CAGR, as repricing and app-based sales outweigh falling branch use.
- New South Wales and Australian Capital Territory led with 33.7% of 2025 value, reflecting the country's largest average owner-occupier loans at AUD 842,000 in New South Wales.
- Non-Life Insurance held 57.0% of 2025 value, as home and motor cover sits closest to the mortgage and car finance decisions made at banks.
- Treasury released draft rules on July 27, 2026, that would extend ten add-on insurance exemptions from the four-day deferred sales model until 2031.
- Allianz, Hollard, TAL, AIA and Zurich hold multiyear bank alliances of up to 20 years, so competition centers on renewal terms and digital placement.
Home cover and major banks anchor bank-sold premium
Why does non-life cover lead while health grows fastest?
Based on product type, the market is categorized into life insurance, non-life insurance and health insurance. Non-Life Insurance led the Australia bancassurance market with 57.0% share of 2025 value, because home and motor cover attaches to bank lending. Insurance News reported that the CommInsure general book alone carried about AUD 800 million of written premium when Hollard closed its purchase in 2022. Health Insurance grows fastest at 5.56% a year as the Department of Health approved an average 4.41% premium rise from April 1, 2026, and Insurance Business reported 12.7 million Australians held hospital cover in December 2025.
Why do bank apps outrun branches for insurance sales?
Based on distribution channel, the market is categorized into Bank Digital Platforms, Bank Branches and Bank Contact Centres. Bank Digital Platforms led with 47.0% share of 2025 value because customers already bank there. The Australian Banking Association recorded 99.3% of major-bank interactions as digital in fiscal 2024. Bank Digital Platforms also grow fastest at 5.24% a year as Westpac reported 74% of its consumer sales originating digitally in the first half of fiscal 2026. By contrast, World Bank data show commercial branches falling from 16.9 to 15.5 per 100,000 adults between 2023 and 2024.
How do major banks and smaller institutions differ?
Based on institution type, the market is categorized into major banking groups, regional and customer-owned banks and digital banking specialists. Major Banking Groups led with 72.0% share of 2025 value because each of the four majors holds named insurer partners, including NAB with Allianz and ANZ with Insurance Australia under the CGU brand. Digital Banking Specialists grow fastest at 5.95% a year from a small base, as ING already markets nib health cover as an authorized agent. Meanwhile, the Customer Owned Banking Association represents 47 banks serving more than 5 million Australians.
How do banks earn from the policies they distribute?
Based on revenue model, the market is categorized into percentage commission, fixed referral fee and hybrid remuneration. Percentage Commission led with 66.0% share of 2025 value because the standard agreement pays on premium. CommBank states that AIA Australia pays commission calculated as a percentage of the life premium, while ASIC caps initial life commission at 60%. Hybrid Remuneration grows fastest at 5.05% a year as alliances add performance terms, and NAB discloses a commission from Allianz including renewals and variations, plus a possible profit share when thresholds are met. Fixed referral fees remain smaller and mainly suit simple customer introductions.
| Segment Group | Leading Sub-segment | Share, 2025 | Fastest-growing Sub-segment | CAGR, 2026–2035 |
|---|---|---|---|---|
| By Product Type | Non-Life Insurance | 57.0% | Health Insurance | 5.56% |
| By Distribution Channel | Bank Digital Platforms | 47.0% | Bank Digital Platforms | 5.24% |
| By Institution Type | Major Banking Groups | 72.0% | Digital Banking Specialists | 5.95% |
| By Revenue Model | Percentage Commission | 66.0% | Hybrid Remuneration | 5.05% |
Request a Free Sample
Fill in your details and we'll send you a free sample report.
- Sample data tables & charts
- Research methodology
Repricing and digital sales lift bank-sold premium
Risk-based premium repricing lifts home cover value
Risk-based pricing raises the premium on each bank-sold home policy, which lifts commission income without requiring new customers. Insurance Business reported in June 2026 that the average home premium reached AUD 2,938 in October 2025, up 51% from AUD 1,940 in 2020. APRA data in the same article show householders' written premium rising 17.4% to AUD 4.49 billion between the December 2023 and December 2025 quarters. As a result, banks paid on premium gain from repricing even when policy counts stay flat. The ACCC reported in June 2026 that the cyclone pool cut cover costs in the highest-risk areas by 14% within two years, which limits repricing in those postcodes only. Demand therefore concentrates in non-life cover, which holds 57.0% share of 2025 Australia bancassurance value.
Permissioned digital origination widens the point of sale
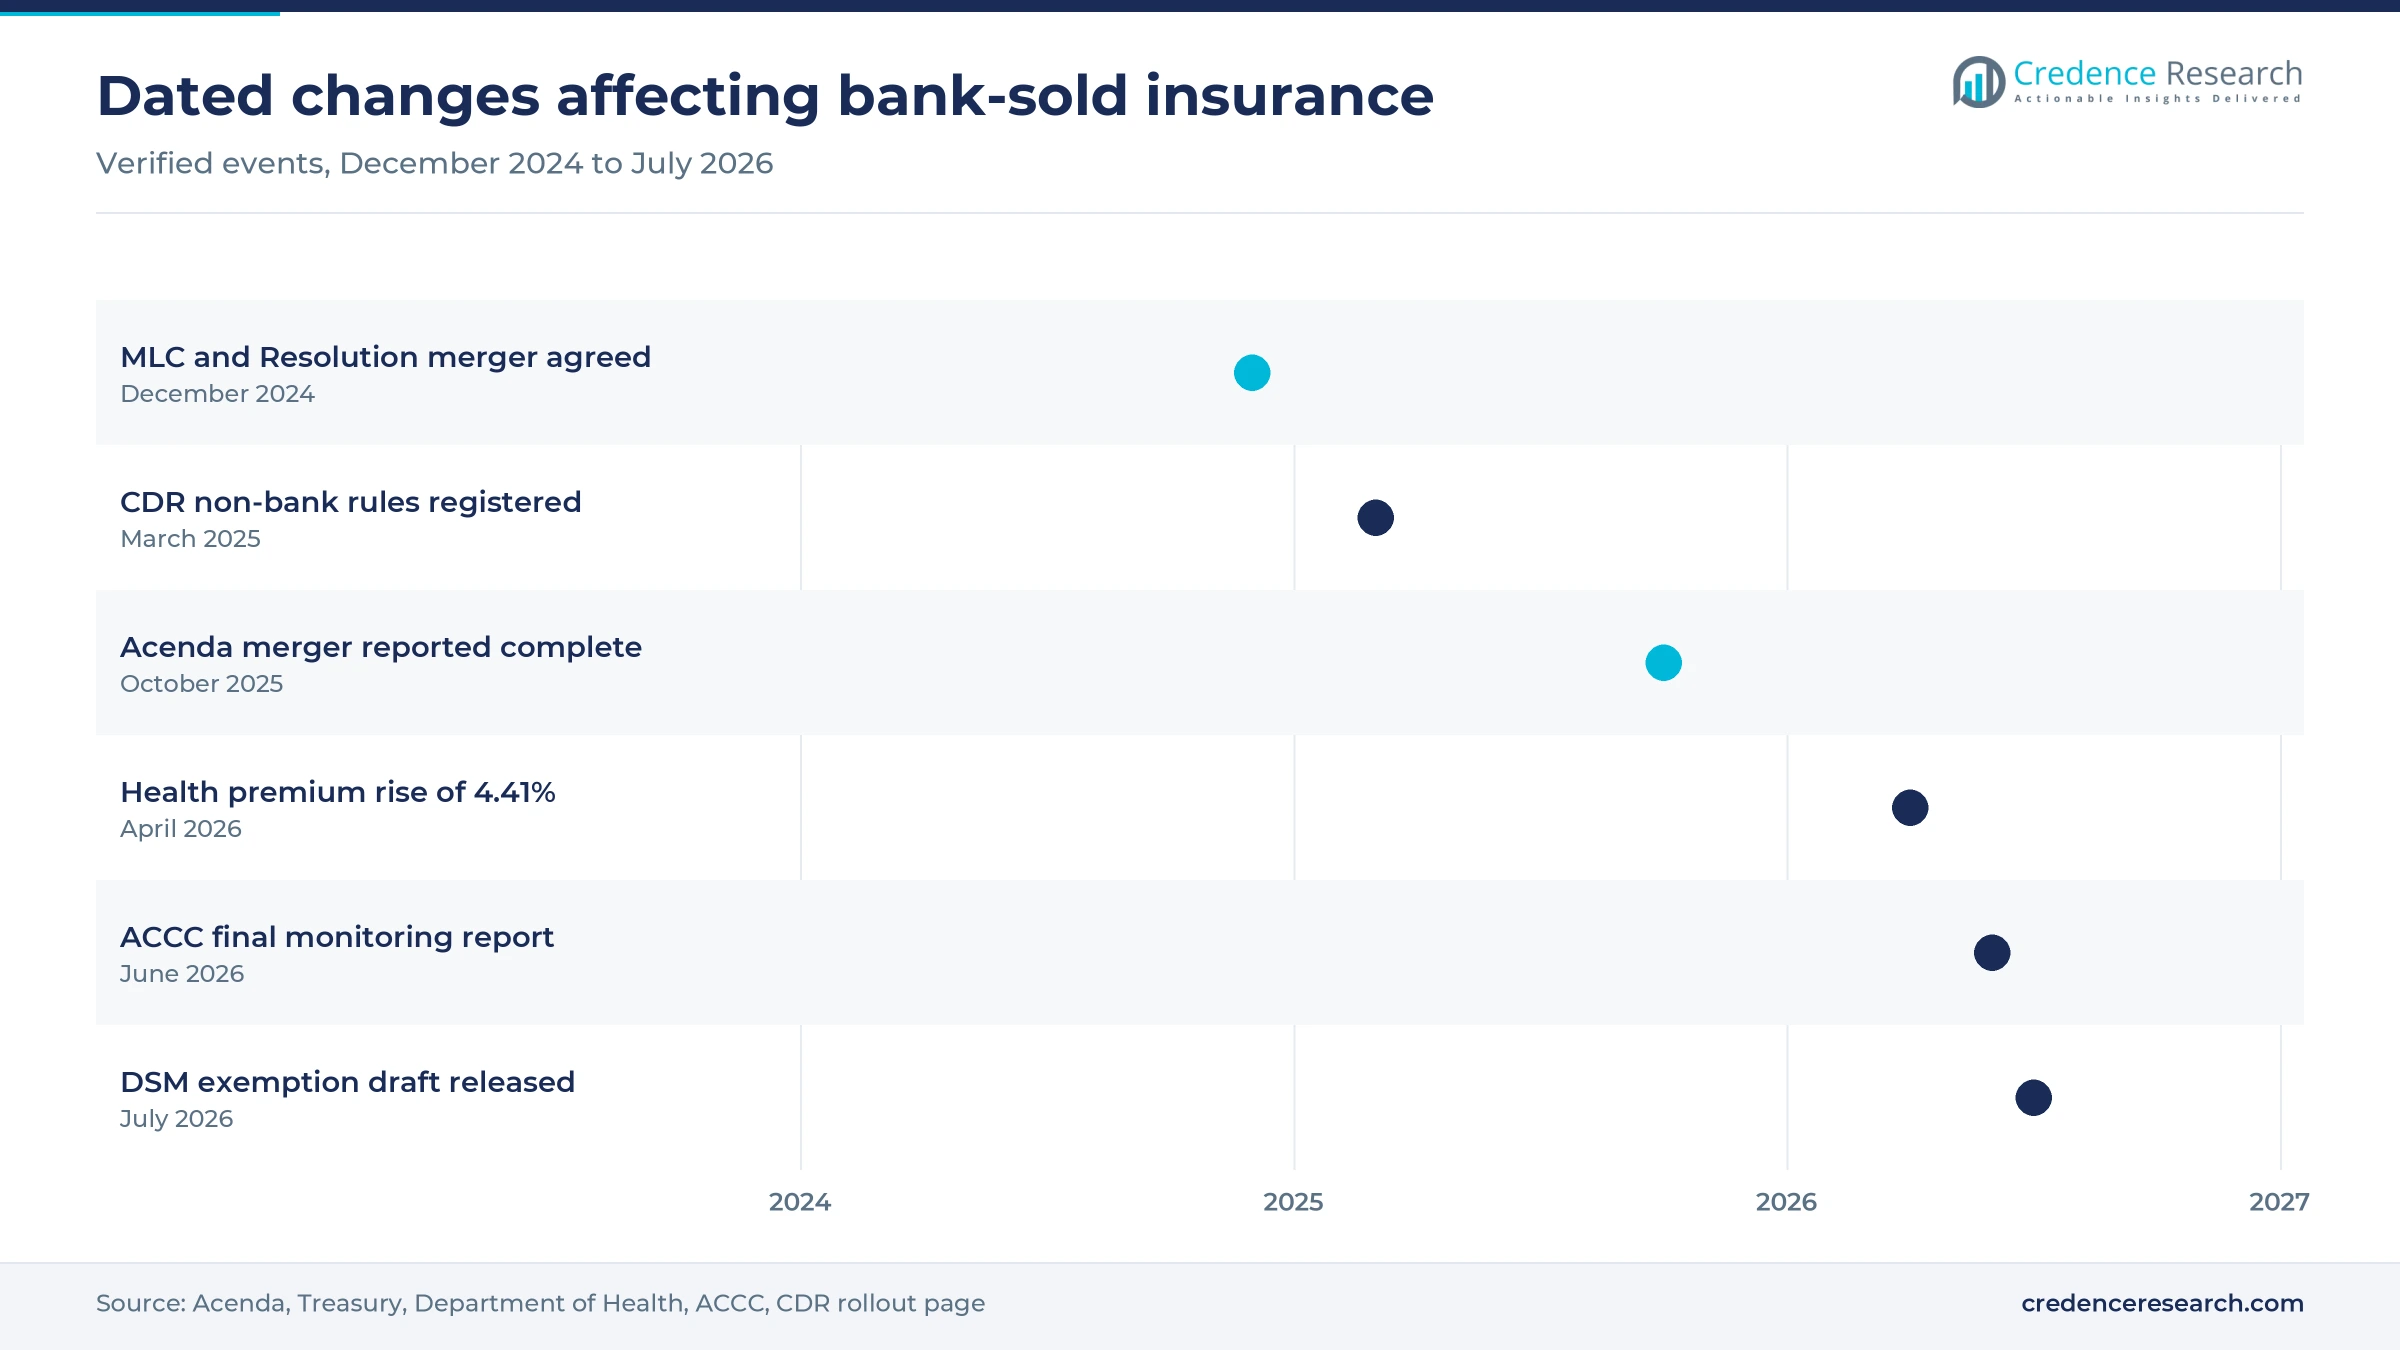
Authenticated bank sessions give insurers a consented, data-rich place to offer cover at the moment a customer takes a loan or checks a balance. Westpac reported in June 2026 that 74% of its sales originated digitally in the first half of fiscal 2026, up from 46% a year earlier, across 5.3 million digitally active customers. The Treasury-run Consumer Data Right widens that base, with non-bank lenders scheduled to join from July 2026 under rules registered in March 2025. In turn, the Productivity Commission estimated in January 2026 that a fully operating regime could add about AUD 10 billion a year to output. These digital banking platforms help Bank Digital Platforms expand at 5.24% a year.
Household formation and protection needs add new policies
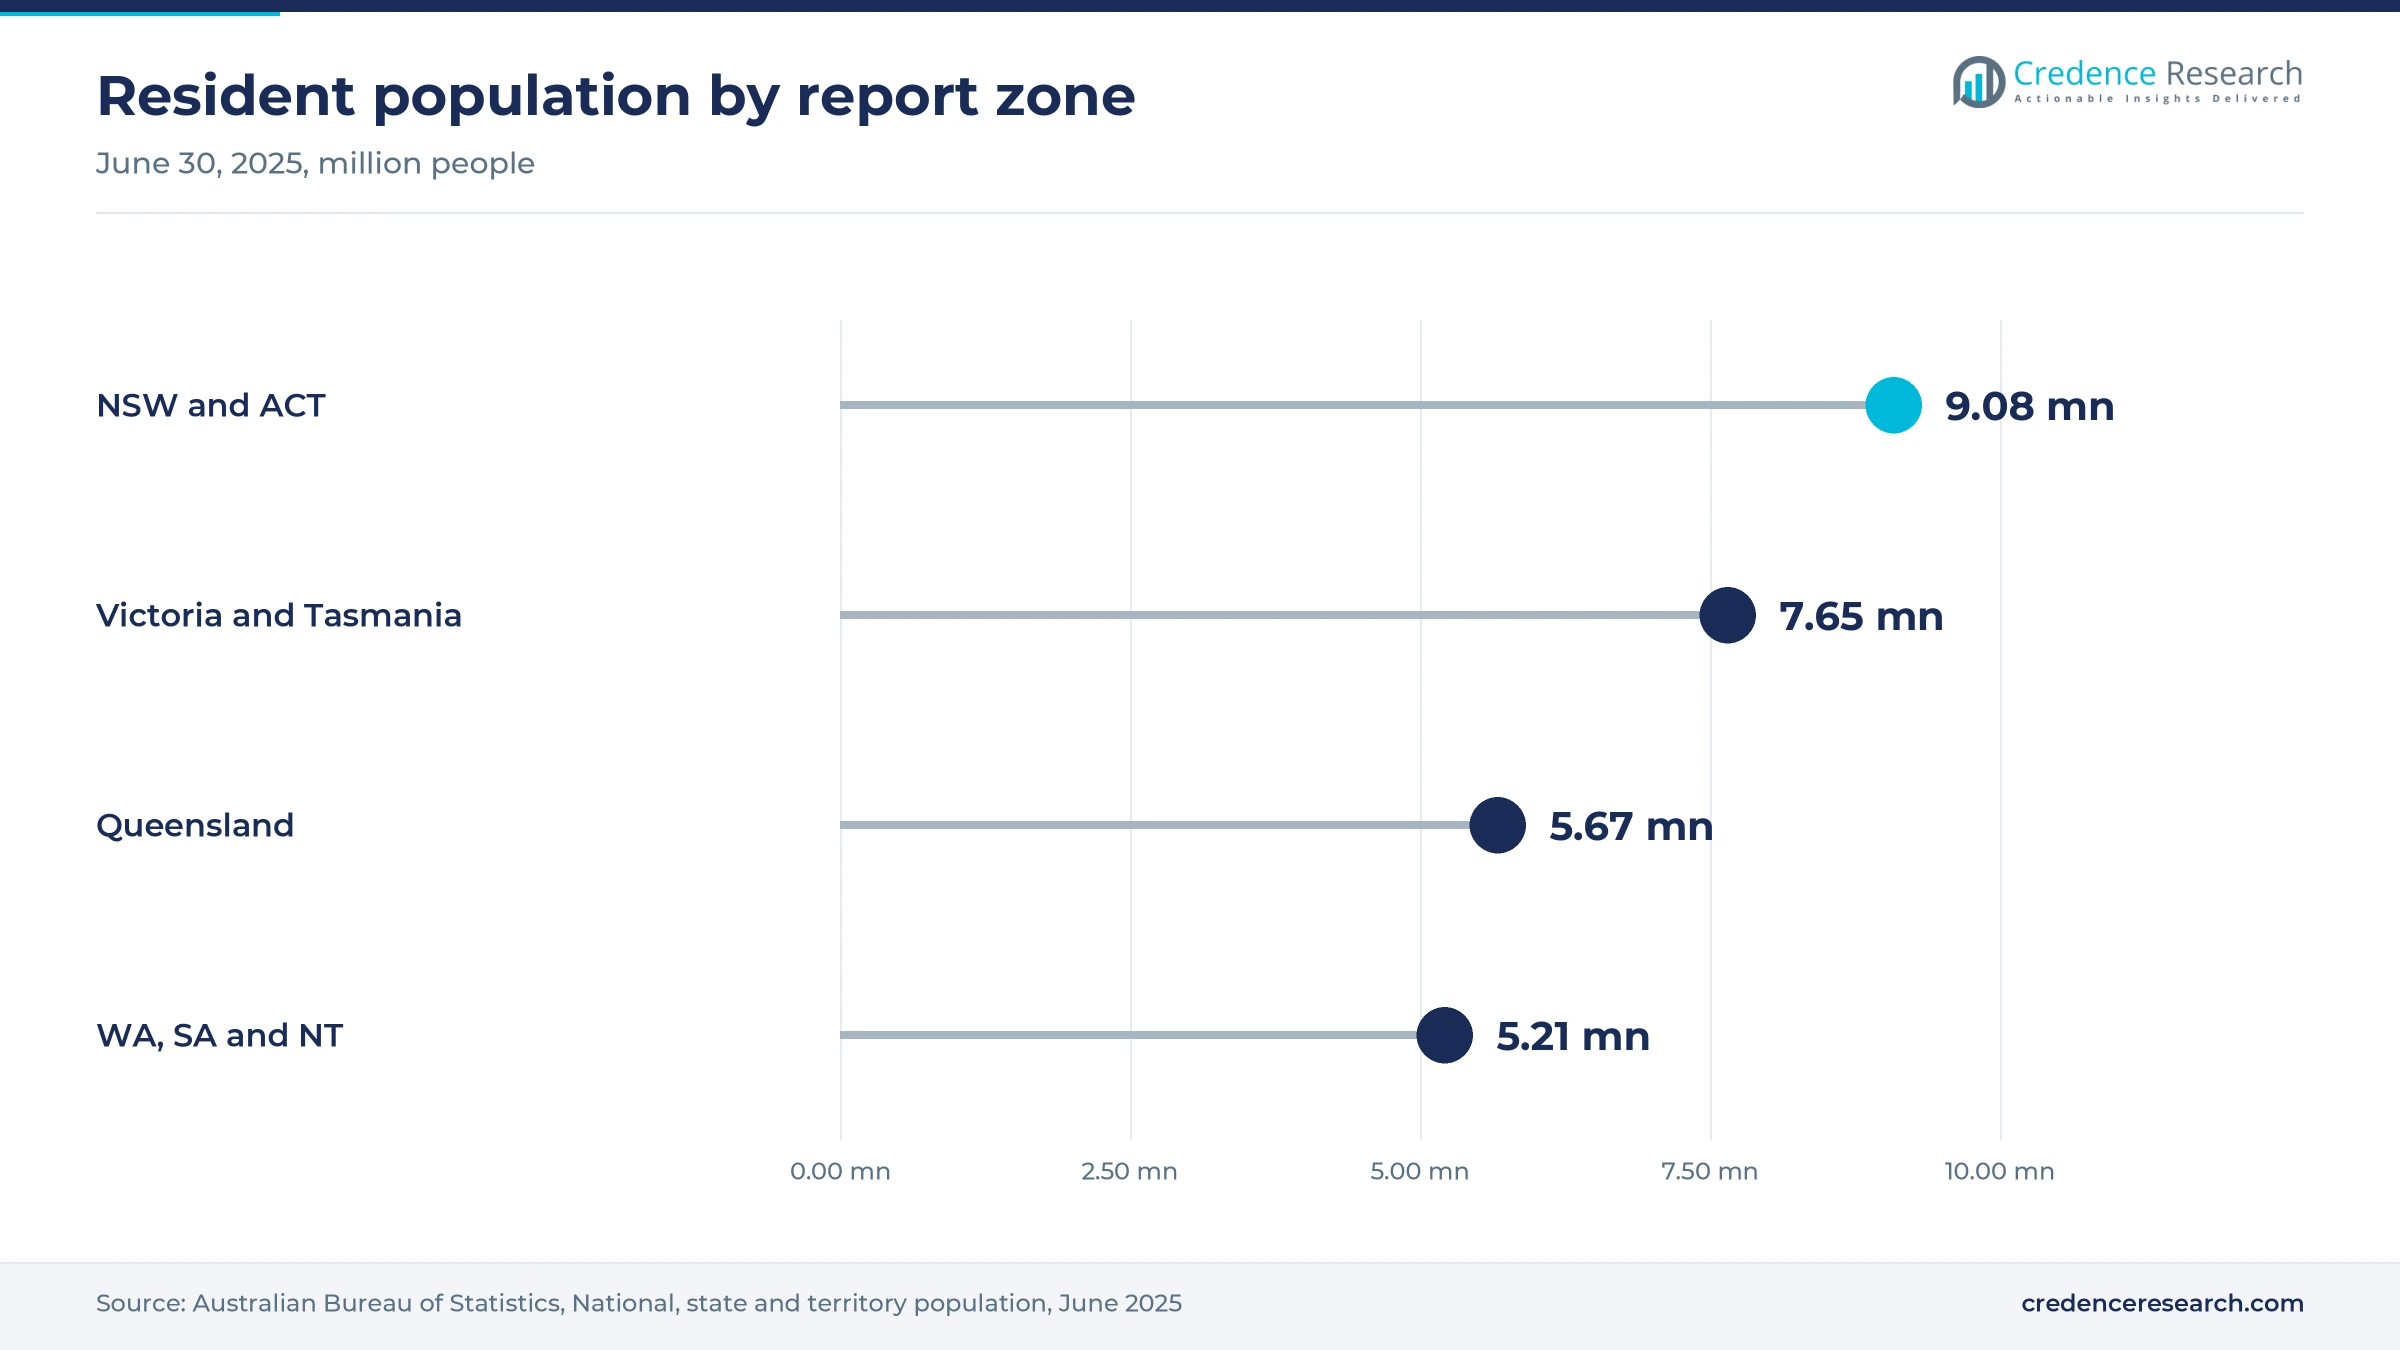
Each new household with a mortgage creates a fresh need for building, contents and income protection, and the bank is usually present at settlement. The ABS counted 27.6 million residents at June 30, 2025, after adding 420,100 people in a year, including 305,600 from net overseas migration. ABS lending data show 134,225 new dwelling loan commitments worth AUD 97.6 billion in the June 2026 quarter, of which 29,319 went to first home buyers. Treasury separately reported 52,201 dwelling commencements in that quarter, up 14.4% on a year earlier. As a result, new buildings and first-time borrowers feed the application flow for home and life cover, and this growth favors Western Australia, South Australia and Northern Territory most.
Long exclusive alliances secure bank shelf space
Exclusive alliances give insurers a guaranteed distribution route, which justifies steady investment in bank-branded products and quote journeys. Money Management reported that Allianz paid AUD 725 million for Westpac's general insurer in 2021 and gained a 20-year exclusive agreement, while TAL paid AUD 900 million for Westpac Life in August 2022 under another 20-year alliance. Similarly, Zurich completed its OnePath Life purchase on June 3, 2019, with a 20-year agreement across ANZ channels, and Hollard took a 15-year alliance with Commonwealth Bank. Commonwealth Bank also agreed a 20-year AIA partnership in September 2017. Because these terms run well into the 2030s, major banking groups keep 72.0% of 2025 value through the forecast period.
Insurer consolidation and bank apps reshape distribution
Shift toward insurer consolidation after bank exits
Banks have moved from owners to distributors, and the insurers that bought those books are now consolidating further. MLC Life Insurance and Resolution Life Australasia agreed on Dec. 11, 2024, to merge as Acenda, with a combined base of about 2 million customers. Under that deal, NAB sold its remaining 20% stake to Nippon Life and agreed to provide contingent Tier 2 capital for three years after completion. ReinAsia reported the merger as complete in an Oct. 31, 2025, article. NAB's insurance page now describes support only for off-sale life policies, while its home and car cover is issued by Allianz. As a result, buyers of critical illness cover and other life products increasingly meet global insurers behind bank brands.
Rise of chat and app service as branches thin out
Service is moving to apps and chat, which shapes where insurance conversations start and how bank staff support them. The Australian Banking Association's 2025 report found major-bank branch interactions fell 46% in cities and 63% in regional areas between fiscal 2019 and fiscal 2024, while phone interactions also declined. Over the same period, chatbot interactions at major banks rose 1,778%. APRA's 2024 statistics, reported by Australian Broker, show branches down 41% from June 2017 to June 2024. Bankwest announced plans in March 2024 to exit all 60 of its branches, according to Savings.com.au, with 97% of its customer transactions already digital. Consequently, Bank Contact Centres handle fewer routine calls and Bank Digital Platforms become the first stop for quotes and renewals.
Health cover gives banks a recurring-premium opening
Private health cover offers banks an opportunity outside the storm-exposed home book and with recurring annual premium. Insurance Business reported on July 30, 2026, that APRA counted 12,688,193 people with hospital cover at Dec. 31, 2025, or 45.6% of the population. The Department of Health approved an average premium rise of 4.41% from April 1, 2026, up from 3.73% a year earlier. Partnerships already exist, because CommBank promotes AIA Health products for commission, ING markets nib cover as an agent, and CUA signed an exclusive deal to sell HBF health insurance in 2021. Therefore, smaller institutions can enter with limited capital, and Health Insurance grows fastest at 5.56% a year through 2035.
Customer-owned banks present a white-label opening
Customer-owned banks represent an opportunity for insurers that want scale beyond the four majors without building new branches. The Customer Owned Banking Association lists 47 member banks and more than 5 million customers, a base many partners can reach through one carrier agreement. Allianz already shows 30 partner logos on its financial institutions page, including Great Southern Bank, IMB Bank, Beyond Bank and Newcastle Permanent. Bendigo Bank arranges home and car cover issued by Insurance Australia under the CGU brand and travel cover issued by Zurich. Digital insurance and wealth platforms can help these banks offer quotes in their apps, which supports regional and customer-owned banks as the second-largest institution type.
Add-on scrutiny and catastrophe losses squeeze the channel
Add-on insurance complaints keep conduct risk high
Legacy add-on sales keep bank insurance under close scrutiny, and the numbers remain large. Insurance Business reported in June 2026 that AFCA received 7,880 add-on insurance complaints in fiscal 2025, about 23% of general insurance complaints. Complaints about misleading product information rose 365% to 7,515, with nearly three-quarters directed at nine members, mainly large banks. Consequently, banks face remediation costs and tighter sales checks on every referral. However, AFCA said complaints lodged after June 30, 2025, on policies sold before July 2019 will likely fall outside its jurisdiction.
The deferred sales model slows some loan-linked sales
The deferred sales model has forced a four-day pause between a primary product and many add-on policies since Oct. 5, 2021, which breaks bundled selling at the point of a loan. Norton Rose Fulbright reported that Treasury issued draft rules on July 27, 2026, to extend ten class exemptions until 2031. Non-exempt products still lose momentum during the pause, which hurts conversion at banks. Therefore, distributors need clear follow-up journeys for customers who return after the deferral period.
Catastrophe losses pressure home insurer partners
Weather losses make home cover a volatile partner product, because repeated repricing can erode the commission base through lapses. APRA data cited by Insurance Business show the householders line posted a AUD 1.08 billion underwriting loss in the December 2025 quarter, with net claims taking nearly 80 cents of each premium dollar. North Western Australia premiums averaged almost AUD 5,000 in 2024-25, according to the ACCC. As a result, borrowers in exposed postcodes may underinsure, although the ACCC noted that more insurers now recognize cyclone mitigation measures.
Thin life insurer returns restrict bank commissions
Life insurers have limited room to pay higher distribution rates, since returns stay thin and commissions are capped. APRA figures reported by Insurance Business put life insurer after-tax profit at AUD 121 million in the March 2026 quarter, down from AUD 332 million a year earlier, with a 0.7% return on net assets. ASIC's 2017 instrument also caps initial life commissions at 60% and trail at 20% of premium under its benefit ratio test, according to TurksLegal. Consequently, banks must win through volumes and retention, not by negotiating richer rates.
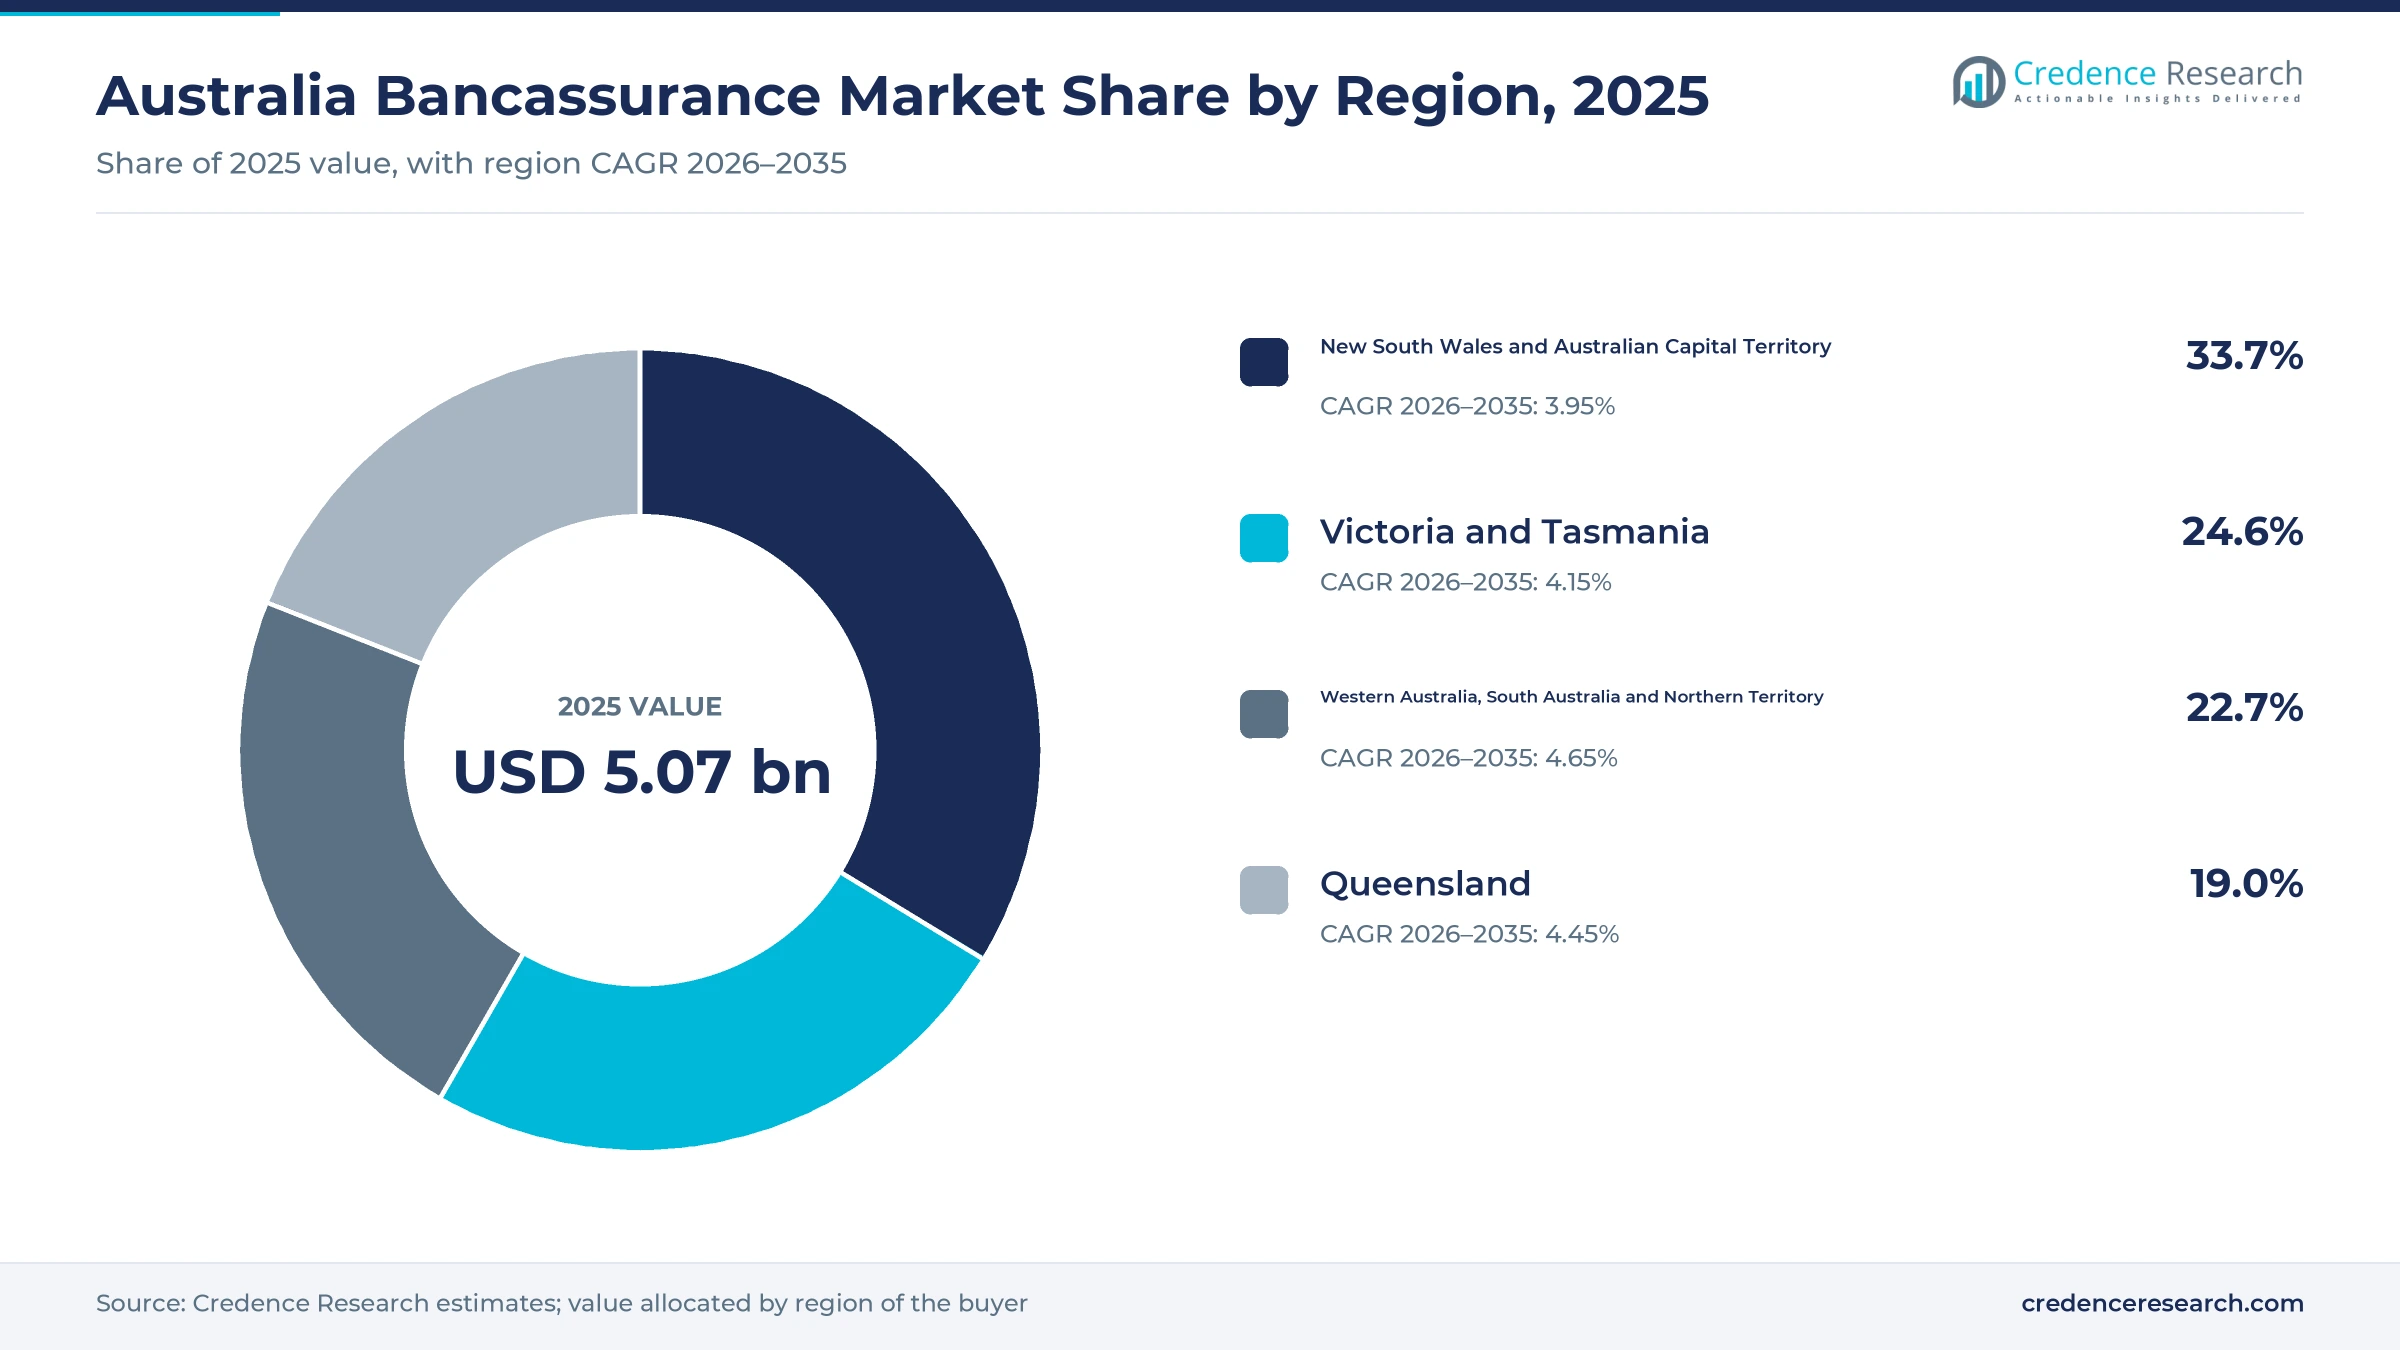
Lending size and storm exposure split the four zones
| Region | Value, 2025 (USD billion) | Share, 2025 | CAGR, 2026–2035 |
|---|---|---|---|
| New South Wales and Australian Capital Territory | 1.71 | 33.7% | 3.95% |
| Victoria and Tasmania | 1.25 | 24.6% | 4.15% |
| Western Australia, South Australia and Northern Territory | 1.15 | 22.7% | 4.65% |
| Queensland | 0.96 | 19.0% | 4.45% |
New South Wales and the ACT lead on loan size
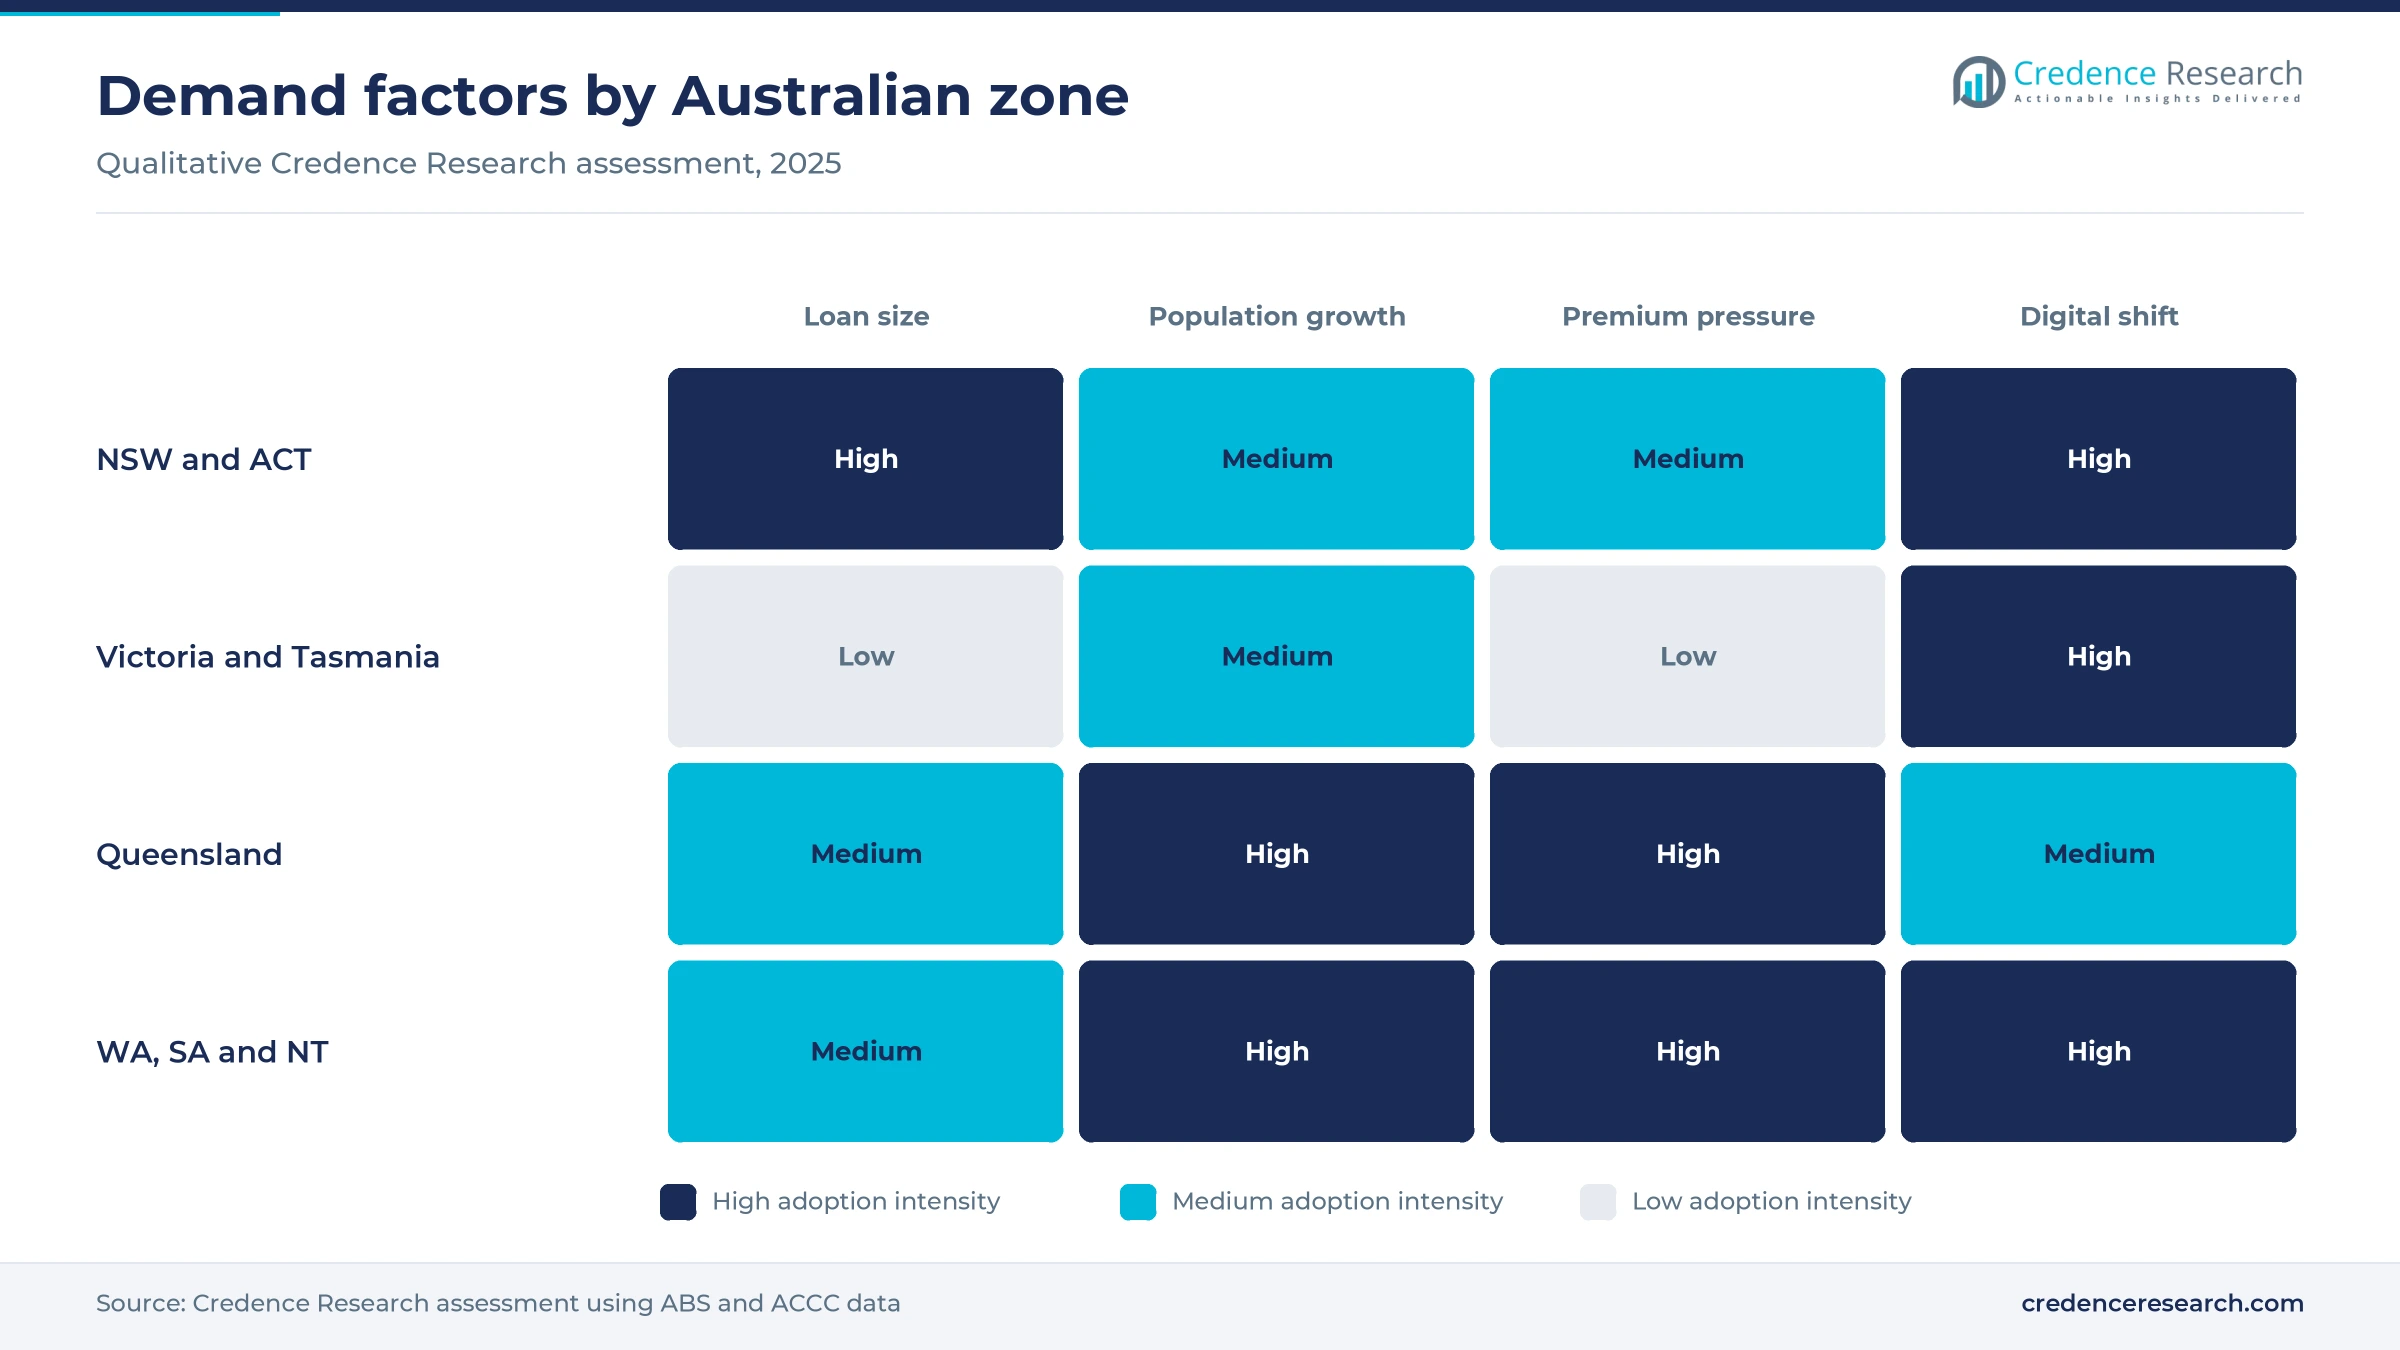
New South Wales and Australian Capital Territory held 33.7% share of Australia bancassurance value in 2025 and grows at 3.95% a year. The ABS put the average owner-occupier loan at AUD 842,000 in New South Wales in the June 2026 quarter, the highest in the country, which supports larger building sums insured and life cover amounts. The zone also holds about 9.08 million residents, or nearly a third of the population. However, New South Wales grew only 1.2% in the year to June 2025, slower than the national pace of 1.5%.
Western Australia and its neighbors grow fastest
Western Australia, South Australia and Northern Territory held 22.7% share of 2025 value and grows at 4.65% a year, the fastest of the four zones. Western Australia recorded the country's quickest population growth at 2.2% in the year to June 2025, according to the ABS. Premium levels also lift value, since the ACCC reported average home and contents premiums above AUD 3,500 in the Northern Territory. Digital sales matter here, because Bankwest, a Western Australian institution, announced in 2024 that it would exit all 60 branches.
Victoria and Tasmania show a sharp internal contrast
Victoria and Tasmania held 24.6% share of Australia bancassurance value in 2025 and grows at 4.15% a year. Victoria added 123,500 residents in the year to June 2025, the largest increase of any state, while Tasmania added only 1,200 and grew 0.2%, according to the ABS. Average owner-occupier loans of AUD 664,000 in Victoria and AUD 516,000 in Tasmania sit below the national AUD 731,000, which keeps average sums insured lower. As a result, growth here depends on new households rather than larger policies.
Queensland balances migration with cyclone exposure
Queensland held 19.0% share of 2025 value and grows at 4.45% a year. The state added 97,900 residents in the year to June 2025, a 1.8% rise, and its average owner-occupier loan reached AUD 751,000 in the June 2026 quarter, according to the ABS. Premium relief is uneven, because the ACCC found the cyclone pool cut premiums 14% in Mackay and 12% in Cairns but only 3% in Townsville. North Queensland premiums still average more than AUD 3,100, so affordability shapes bank referrals.
Life insurer mergers and data rules changed the channel
| Development | Status and market relevance |
|---|---|
| In December 2024, MLC Life Insurance and Resolution Life Australasia agreed to merge as Acenda, with NAB selling its 20% stake to Nippon Life. | Merger reported complete by October 2025, forming a life insurer with about 2 million customers |
| In March 2025, Version 8 Consumer Data Right rules were registered to extend data sharing to non-bank lenders. | Sharing scheduled from July 2026, widening permissioned data beyond banks and energy retailers |
| In April 2026, a 4.41% average private health premium rise took effect after Department of Health approval. | In force, lifting recurring premium on health cover promoted through CommBank, ING and others |
| In June 2026, the ACCC published its fifth and final insurance monitoring report on the cyclone pool. | Completed, confirming lower premiums in the highest-risk areas but continued affordability concerns |
| In July 2026, Treasury issued draft regulations to extend ten add-on insurance exemptions until 2031. | Consultation closed Aug. 7, 2026, with direct effect on home, motor and travel add-on sales |
Authenticated apps carry more insurance journeys
- Authenticated bank apps place quotes behind a logged-in session, and Westpac counts 5.3 million customers with such a session in the prior 30 days.
- Consumer Data Right feeds allow accredited parties to read consented banking data, which helps prefill applications once non-bank lenders join the regime.
- Hazard-based pricing engines let partner insurers price each address separately, which contributes to wide differences in average premiums across northern Australia.
- Chat and virtual assistants handle routine service questions, and the Australian Banking Association counted a 1,778% rise in chatbot interactions at major banks since fiscal 2019.
Need a Custom Version of This Report?
Tailor the scope, geography, or segments to your exact requirements.
- Custom geography or segment scope
- Direct access to our analyst team
Twenty-year alliances define competition between partners
Competition runs mainly between alliance pairs rather than single firms, because most large banks have sold their insurers while keeping customer access. Allianz serves both Westpac and NAB in general insurance, Hollard serves Commonwealth Bank, and Insurance Australia issues CGU-branded cover for ANZ and Bendigo Bank. In life cover, AIA works with Commonwealth Bank, TAL with Westpac and Zurich with ANZ, whereas Acenda inherits the former MLC Life book after NAB left its shareholding. These pairings sit inside a wider pool of life and general insurance premiums that also reach customers through brokers and direct brands. Rivalry therefore turns on digital placement, renewal terms and the claims experience a bank is willing to put its name beside. Compared with wider bank-led insurance distribution, the defining local feature is that major banks mostly distribute rather than own their insurers.
Who are the leading bank and insurer partners?
| Company | Type | Role in the market |
|---|---|---|
| Commonwealth Bank of Australia | Bank distributor | Distributes Hollard home and car cover and AIA life and health products for commission |
| Westpac Banking Corporation | Bank distributor | Sold general and life insurers under 20-year exclusive alliances with Allianz and TAL |
| Australia and New Zealand Banking Group Limited | Bank distributor | Distributes CGU-branded home cover and Zurich life products under a 20-year agreement |
| National Australia Bank Limited | Bank distributor | Acts as agent for Allianz home, car and landlord cover; sold its Acenda predecessor stake |
| Allianz Australia Insurance Limited | Insurer partner | Issues Westpac and NAB general insurance and underwrites for many customer-owned banks |
| Hollard Insurance Partners Limited | Insurer partner | Took on the CommInsure general book in 2022 under a 15-year alliance |
| TAL | Insurer partner | Provides life products to Westpac customers since the 2022 purchase of Westpac Life |
| AIA Australia Limited | Insurer partner | Issues CommBank-distributed life cover, and AIA Health issues health products |
| Zurich Australia Limited | Insurer partner | Owns OnePath Life and distributes through ANZ channels for 20 years from 2019 |
| Acenda | Life insurer | Combines MLC Life and Resolution Life Australasia under Nippon Life ownership |
Credence Research sees a contract-led, repricing-led market
Credence Research's view is that this market grows mainly through price and placement rather than through a return to bank ownership. Alliance terms running into the 2030s and 2040s protect incumbents, yet they also limit a bank's ability to switch partners when service or pricing disappoints. Value therefore shifts toward partners that can quote inside an app and explain a premium rise clearly. The most useful test over the next three years is whether digital sales convert to policies that stay in force, because commission depends on renewals rather than on the first sale alone.
How the Credence Research estimate was built
The report uses 2025 as the base year and forecasts values through 2035. Market values come from the Credence Research model, and the value was checked against national insurance revenue published by APRA. Segment and regional splits are Credence Research estimates, informed by company disclosures, ABS statistics and regulator publications. Sources used include APRA, ABS, ACCC, Treasury, the Department of Health, bank and insurer websites, and trade publications. No interviews or surveys were conducted in preparing this report.
Digital sales and health cover shape growth through 2035
Through 2035, the market moves from USD 5.30 billion in 2026 toward USD 7.71 billion, a path that relies on steady repricing, household growth and more sales inside bank apps. Health cover and digital specialists should add share from smaller bases, while branches keep a role in complex life and regional conversations. The main risks are a further round of add-on remediation and a severe weather season that forces premiums beyond what borrowers will pay. If those stay contained, the alliances signed between 2017 and 2022 should still be running at the end of the forecast period.
Frequently Asked Questions
How big is the Australia bancassurance market?
Which product type leads bank-sold insurance in Australia?
Which region holds the largest share?
Which channel grows fastest?
Do Australian banks still own their insurers?
How do banks earn income from insurance?
What is the deferred sales model?
What are the main challenges for this market?
Table of Content
Chapter 1 Market Segmentation
- 1.1 Segmentation Framework
- 1.1.1 Product and Service Classification
- 1.1.2 Application and End-Use Classification
- 1.1.3 Technology and Solution Classification
- 1.1.4 Customer and Distribution Channel Classification
- 1.1.5 Geographic Segmentation
- 1.1.6 Market Segment Definitions and Boundaries
- 1.2 By Product Type
- 1.2.1 Non-Life Insurance
- 1.2.2 Life Insurance
- 1.2.3 Health Insurance
- 1.3 By Institution Type
- 1.3.1 Major Banking Groups
- 1.3.2 Regional and Customer-Owned Banks
- 1.3.3 Digital Banking Specialists
- 1.4 By Revenue Model
- 1.4.1 Percentage Commission
- 1.4.2 Hybrid Remuneration
- 1.4.3 Fixed Referral Fee
Chapter 2 Introduction
- 2.1 Report Objectives and Scope
- 2.2 Product Definition and Industry Terminology
- 2.3 Market Inclusions and Exclusions
- 2.4 Research Process
- 2.4.1 Primary Research and Expert Interviews
- 2.4.2 Secondary Research and Source Review
- 2.4.3 Top-Down and Bottom-Up Estimation
- 2.4.4 Data Triangulation and Verification
- 2.5 Market Size Measurement Basis
- 2.5.1 2025: USD 5.07 billion → 2035: USD 7.71 billion
- 2.6 Historical and Forecast Reference Periods
- 2.6.1 Historical Period: 2018-2025
- 2.6.2 Base Year: 2025
- 2.6.3 Forecast Period: 2025-2035
- 2.7 Research Assumptions and Limitations
Chapter 3 Executive Summary
- 3.1 Market Snapshot and Key Findings
- 3.2 Base-Year Market Size, 2025
- 3.3 Forecast Market Size, 2035
- 3.4 Revenue and Volume Growth Outlook
- 3.5 Key Demand and Supply Indicators
- 3.6 Leading Market Segments
- 3.7 Fastest-Growing Market Opportunities
- 3.8 Regional Performance Highlights
- 3.9 Technology and Industry Transformation
- 3.10 Competitive Landscape Summary
- 3.11 Analyst View and Strategic Implications
Chapter 4 Australia Bancassurance Market Trends and Developments
- 4.1 Historical Industry Development, 2018-2025
- 4.2 Recent Market Trends and Developments
- 4.3 Demand and Customer Behavior Trends
- 4.4 Technology and Product Innovation
- 4.5 Artificial Intelligence, Automation and Digitalization
- 4.6 Local Manufacturing and Supply Chain Realignment
- 4.7 Industry Partnerships, Mergers and Acquisitions
- 4.8 Sustainability and Circular Economy Developments
- 4.9 Government and Private Sector Investment Trends
- 4.10 Emerging Business Models and Commercialization
- 4.11 Industry Developments and Announcements
Chapter 5 Australia Bancassurance Market Supply and Demand Analysis
- 5.1 Demand Trend and Consumption Analysis, 2018-2025
- 5.2 Demand Forecast, 2025-2035
- 5.3 Supply Chain Structure and Procurement Trends
- 5.4 Supply-Demand Gap and Bottlenecks
- 5.5 Import Dependence and Sourcing Structure
- 5.6 Regional Supply and Demand Concentration
Chapter 6 Australia Bancassurance Market Pricing Analysis
- 6.1 Pricing Structure and Measurement
- 6.2 Historical Pricing Trends, 2018-2025
- 6.3 Pricing Outlook, 2025-2035
- 6.4 Pricing by Product and Market Segment
- 6.5 Geographic Pricing Differences
- 6.6 Key Input, Energy, Labor and Logistics Costs
- 6.7 Contract Pricing and Purchasing Models
- 6.8 Pricing Sensitivity and Competitive Positioning
- 6.9 Price, Margin and Profitability Implications
Chapter 7 Australia Bancassurance Market Dynamics
- 7.1 Market Growth Drivers
- 7.1.1 Demand-Side Drivers
- 7.1.2 Technology and Innovation Drivers
- 7.1.3 Infrastructure and Investment Drivers
- 7.1.4 Regulatory and Policy Drivers
- 7.2 Market Restraints
- 7.2.1 Cost and Affordability Constraints
- 7.2.2 Technology and Adoption Barriers
- 7.2.3 Supply Chain and Operational Constraints
- 7.3 Market Challenges
- 7.3.1 Competitive Pressure and Margin Erosion
- 7.3.2 Skills, Infrastructure and Implementation Gaps
- 7.4 Emerging Market Opportunities
- 7.5 Market Dynamics Impact and Time-Horizon Assessment
Chapter 8 Australia Bancassurance Value Chain Analysis
- 8.1 Industry Value Chain Overview
- 8.2 Upstream Suppliers and Critical Inputs
- 8.3 Technology and Component Providers
- 8.4 Manufacturing or Service Delivery
- 8.5 Distribution, Channel Partners and Integrators
- 8.6 Downstream Applications and End Users
- 8.7 Value Addition and Profit Pools
- 8.8 Vertical Integration and Outsourcing
- 8.9 Supplier Concentration and Risk
- 8.10 Supply Chain Localization and Resilience
Chapter 9 Australia Bancassurance Market Regulations and Policies
- 9.1 Relevant Laws, Standards and Compliance Frameworks
- 9.2 Product, Service, Safety and Quality Requirements
- 9.3 Government Policies, Incentives and Subsidies
- 9.4 Imports, Exports and Trade Barriers
- 9.5 Public Procurement and Local Content Requirements
- 9.6 Data Protection, AI and Cybersecurity Compliance
- 9.7 Upcoming Policy Changes and Market Implications
Chapter 10 Australia Bancassurance Market Hotspots and Opportunities
- 10.1 Market Opportunity Mapping and Growth Hotspots
- 10.2 High-Growth Applications and Customer Groups
- 10.3 Underserved Markets and White-Space Opportunities
- 10.4 Emerging Technology and Product Opportunities
- 10.5 New Capacity and Investment Hotspots
- 10.6 Market Entry and Expansion Opportunities
- 10.7 Distribution and Partnership Opportunities
- 10.8 Near-Term and Long-Term Commercial Potential
- 10.9 Opportunity Attractiveness and Execution Risks
Chapter 11 Australia Bancassurance Market Outlook, 2025-2035
- 11.1 Market Size and Analysis
- 11.1.1 Revenue (Market Measurement: 2025: USD 5.07 billion → 2035: USD 7.71 billion)
- 11.1.2 Historical Market Size, 2018-2025
- 11.1.3 Base-Year Market Size, 2025
- 11.2 Market Forecast, 2025-2035
- 11.2.1 Revenue Forecast to 2035
- 11.2.2 CAGR and Year-on-Year Growth
- 11.2.3 Incremental Revenue Opportunity
- 11.3 Forecast Assumptions and Scenario Analysis
- 11.3.1 Base-Case Forecast
- 11.3.2 Optimistic and Conservative Scenarios
- 11.3.3 Technology, Pricing and Policy Sensitivities
- 11.4 Market Attractiveness and Growth Outlook
Chapter 12 Australia Bancassurance Market Segmentation and Outlook
- 12.1 Segmentation Summary and Market Shares, 2025
- 12.2 Largest and Fastest-Growing Segments
- 12.3 By Product Type - Market Size and Forecast, 2025-2035
- 12.3.1 Segment Definition and Scope
- 12.3.2 Historical Market Size, 2018-2025
- 12.3.3 Revenue Forecast, 2025-2035
- 12.3.4 Base-Year Market Share, 2025
- 12.3.5 Segment CAGR and Growth Drivers
- 12.3.6 Subsegment Market Size and Forecast
- 12.3.6.1 Non-Life Insurance
- 12.3.6.2 Life Insurance
- 12.3.6.3 Health Insurance
- 12.3.7 Subsegment Pricing and Adoption Trends
- 12.3.8 Leading Suppliers and Competition
- 12.3.9 Regional Demand and Opportunities
- 12.4 By Institution Type - Market Size and Forecast, 2025-2035
- 12.4.1 Segment Definition and Scope
- 12.4.2 Historical Market Size, 2018-2025
- 12.4.3 Revenue Forecast, 2025-2035
- 12.4.4 Base-Year Market Share, 2025
- 12.4.5 Segment CAGR and Growth Drivers
- 12.4.6 Subsegment Market Size and Forecast
- 12.4.6.1 Major Banking Groups
- 12.4.6.2 Regional and Customer-Owned Banks
- 12.4.6.3 Digital Banking Specialists
- 12.4.7 Subsegment Pricing and Adoption Trends
- 12.4.8 Leading Suppliers and Competition
- 12.4.9 Regional Demand and Opportunities
- 12.5 By Revenue Model - Market Size and Forecast, 2025-2035
- 12.5.1 Segment Definition and Scope
- 12.5.2 Historical Market Size, 2018-2025
- 12.5.3 Revenue Forecast, 2025-2035
- 12.5.4 Base-Year Market Share, 2025
- 12.5.5 Segment CAGR and Growth Drivers
- 12.5.6 Subsegment Market Size and Forecast
- 12.5.6.1 Percentage Commission
- 12.5.6.2 Hybrid Remuneration
- 12.5.6.3 Fixed Referral Fee
- 12.5.7 Subsegment Pricing and Adoption Trends
- 12.5.8 Leading Suppliers and Competition
- 12.5.9 Regional Demand and Opportunities
- 12.6 Segment Growth Comparison
- 12.7 Segment Attractiveness and Priority Matrix
Chapter 13 Australia Bancassurance Geographic Market Outlook, 2025-2035
- 13.1 Domestic Market Distribution and Demand Clusters
- 13.2 State- or Province-Wise Market Size and Forecast, 2025-2035
- 13.3 City and Metropolitan Market Outlook
- 13.4 Industrial, Manufacturing and Commercial Clusters
- 13.5 Geographic Concentration of Key End Users
- 13.6 Local Pricing and Purchasing Differences
- 13.7 Domestic Production Facilities and Capacity Map
- 13.8 Local Infrastructure and Project Pipeline
- 13.9 State-Level Policy and Incentive Differences
- 13.10 Subnational Investment Hotspots and Opportunities
- 13.11 Distribution and Logistics Networks
- 13.12 Domestic Competitive Footprint
Chapter 14 Australia Bancassurance Technology, Innovation and Sustainability Outlook
- 14.1 Technology Landscape and Maturity
- 14.2 Product, Process and Service Innovation
- 14.3 AI, Automation and Digital Tools in the Industry
- 14.4 Technology Adoption and Performance Benchmarking
- 14.5 Innovation Pipeline and R&D Investment
- 14.6 Energy Efficiency and Resource Management
- 14.7 Sustainability, Recycling and Circularity
- 14.8 Technology Roadmap, 2025-2035
- 14.9 Risks of Obsolescence and Technology Substitution
Chapter 15 Australia Bancassurance Market Key Strategic Imperatives
- 15.1 Growth and Market Entry Priorities
- 15.2 High-Return Products and Segments
- 15.3 Pricing, Profitability and Cost Optimization
- 15.4 Technology Investment and Product Differentiation
- 15.5 Supply Chain Localization and Resilience
- 15.6 Distribution and Customer Acquisition
- 15.7 Partnership, Acquisition and Capacity Strategy
- 15.8 Regional Expansion Priorities
- 15.9 Short-, Medium- and Long-Term Actions
Chapter 16 Competition Outlook
- 16.1 Industry Competition Characteristics
- 16.2 Market Structure and Concentration
- 16.3 Market Share and Competitive Positioning, 2025
- 16.4 Company-Wise Revenue and Product Benchmarking
- 16.5 Production and Service Capacity Benchmarking
- 16.6 Technology, Pricing and Differentiation
- 16.7 Regional Footprint and Distribution Strength
- 16.8 Mergers, Acquisitions and Strategic Alliances
- 16.9 New Entrants and Competitive Threats
- 16.10 Porter's Five Forces and Industry Attractiveness
- 16.11 Competitive Outlook, 2025-2035
Chapter 17 Company Profiles
- 17.1 Company Coverage and Selection Criteria
- 17.2 Commonwealth Bank of Australia
- 17.2.1 Business Description
- 17.2.2 Company Ownership and Geographic Presence
- 17.2.3 Product and Service Portfolio
- 17.2.4 Manufacturing and Operating Footprint
- 17.2.5 Financial Performance and Investment
- 17.2.6 Market Share and Competitive Position
- 17.2.7 Technology and Innovation Capabilities
- 17.2.8 Strategic Alliances or Partnerships
- 17.2.9 Recent Developments
- 17.2.10 Growth Strategy and Outlook
- 17.3 Westpac Banking Corporation
- 17.4 Australia and New Zealand Banking Group Limited
- 17.5 National Australia Bank Limited
- 17.6 Allianz Australia Insurance Limited
- 17.7 Hollard Insurance Partners Limited
- 17.8 TAL
- 17.9 AIA Australia Limited
- 17.10 Zurich Australia Limited
- 17.11 Acenda
- 17.12 Other Relevant Market Participants
Note: Every listed company is profiled on the structure shown under the first company. The company list is preliminary and may change based on research findings, market developments, data availability and client requirements.
Chapter 18 Disclaimer
- 18.1 Research and Forecast Disclaimer
- 18.2 Data Source and Estimation Limitations
Note: The depth of individual sections depends on data availability for this market. Volume, capacity, trade and other unit-based metrics are included where applicable.