
Market Overviews
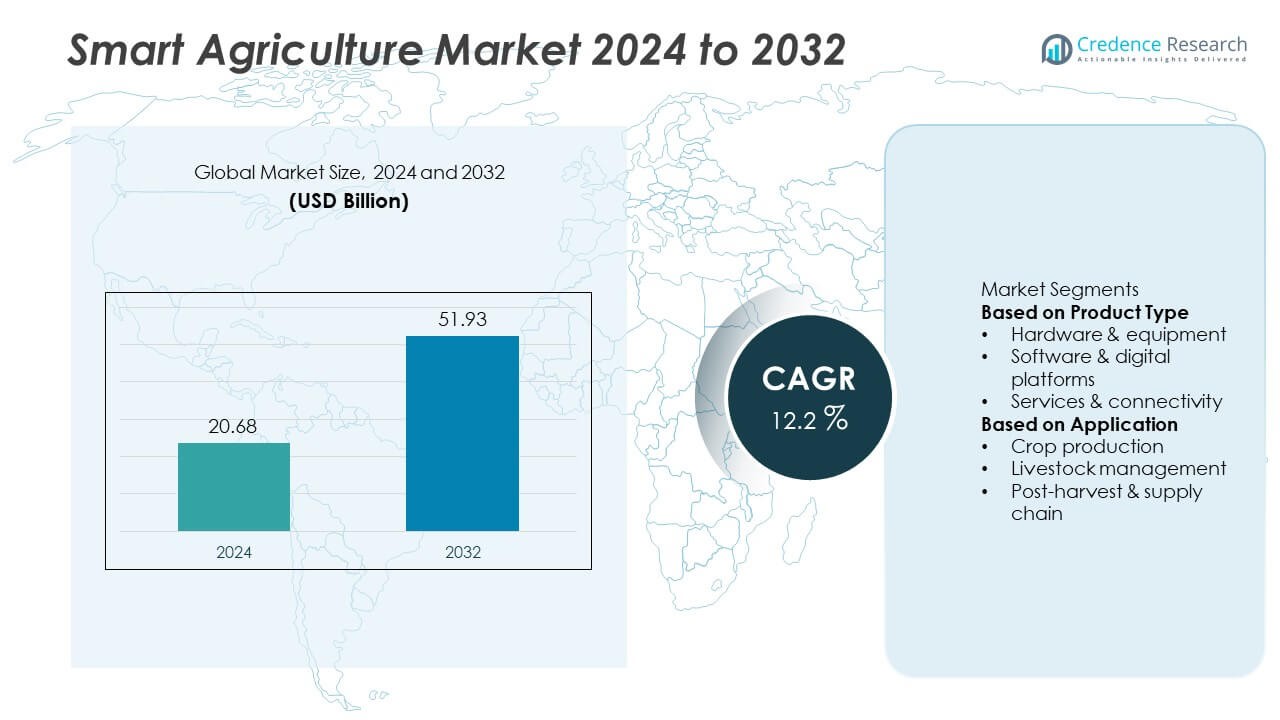
The smart agriculture market was valued at USD 20.68 billion in 2024 and is projected to reach USD 51.93 billion by 2032, growing at a CAGR of 12.2% during the forecast period.
| REPORT ATTRIBUTE | DETAILS |
|---|---|
| Historical Period | 2020-2023 |
| Base Year | 2024 |
| Forecast Period | 2025-2032 |
| Smart Agriculture Market Size 2024 | USD 20.68 Billion |
| Smart Agriculture Market, CAGR | 12.2% |
| Smart Agriculture Market Size 2032 | USD 51.93 Billion |
The smart agriculture market is led by major players such as Monarch Tractor, CNH Industrial, Bayer, Kubota, Mahindra & Mahindra, Carbon Robotics, CLAAS Group, AGCO, Farmers Edge, and John Deere & Company. These companies dominate the industry through innovations in precision farming, autonomous equipment, and AI-driven crop management systems. Asia-Pacific emerged as the leading region with a 29.5% market share in 2024, driven by rapid technology adoption and government-backed digital agriculture initiatives. North America followed with a 33.7% share, supported by advanced infrastructure and strong agritech investments, while Europe held a 27.8% share, led by sustainability-focused farming policies and automation in large-scale agricultural operations.
Market Insights
- The smart agriculture market was valued at USD 20.68 billion in 2024 and is projected to reach USD 51.93 billion by 2032, growing at a CAGR of 12.2%.
- Rising adoption of IoT sensors, drones, and automation systems drives market growth, with the hardware and equipment segment holding a 47.3% share due to increasing demand for precision farming tools.
- Integration of AI, machine learning, and data analytics is shaping new market trends by improving real-time decision-making, predictive crop analysis, and resource optimization.
- The market is competitive, featuring players such as Monarch Tractor, CNH Industrial, Bayer, and John Deere focusing on autonomous machinery, digital platforms, and sustainable farming solutions.
- North America led with a 33.7% share in 2024, followed by Asia-Pacific at 29.5% and Europe at 27.8%, supported by government initiatives, rapid technology deployment, and strong demand for efficient agricultural management systems.
Market Segmentation Analysis:
By Product Type
The hardware and equipment segment dominated the smart agriculture market in 2024, accounting for a 47.3% share. This dominance is driven by the rising use of IoT-based sensors, automated irrigation systems, drones, and GPS-enabled machinery. These tools enhance field monitoring, reduce input waste, and improve crop yields through data-based precision farming. Farmers increasingly invest in modern equipment to address labor shortages and optimize productivity. Continuous technological innovation, including smart tractors and autonomous robots, strengthens the hardware segment’s leadership across developed and emerging agricultural economies.
- For instance, John Deere's 8R autonomous tractor is equipped with six pairs of stereo cameras and an Nvidia GPU, which enable real-time obstacle detection and centimeter-level positioning accuracy across large fields.
By Application
The crop production segment led the smart agriculture market in 2024, holding a 52.8% share. Its leadership stems from the growing adoption of precision farming technologies to enhance soil health, water management, and yield prediction. Automated irrigation, drone-based imaging, and satellite data analytics support efficient resource allocation and reduce operational costs. Government initiatives promoting sustainable crop cultivation and digital farming practices further accelerate adoption. Increasing global food demand and shrinking arable land continue to drive the use of intelligent agricultural systems for maximizing productivity.
- For instance, Bayer’s FieldView platform analyzed over 220 million acres of farmland using AI-driven yield modeling and weather-based analytics to optimize input use and crop rotation patterns.
Key Growth Drivers
Rising Adoption of IoT and Precision Farming Technologies
The increasing use of IoT-enabled sensors, drones, and automation tools is transforming traditional farming into data-driven operations. These technologies allow farmers to monitor soil conditions, moisture levels, and crop health in real time, improving productivity and resource efficiency. Precision farming minimizes input waste and ensures targeted application of fertilizers and water, reducing costs. Governments and agritech firms are actively promoting digital tools to support sustainable agriculture and enhance food security.
- For instance, Trimble Agriculture has deployed over 2 million connected devices globally through its precision agriculture platforms, offering field mapping accuracy of up to 2.5 cm using GNSS-based guidance.
Growing Need for Sustainable and Resource-Efficient Farming
Rising environmental concerns and water scarcity are pushing farmers toward smart agriculture solutions. Automated irrigation systems, climate control technologies, and AI-driven crop analytics optimize resource utilization and minimize environmental impact. These systems enable sustainable production while maintaining profitability. Increasing global emphasis on carbon reduction and green farming practices further accelerates the adoption of eco-efficient agricultural technologies across both developed and developing regions.
- For instance, Netafim’s precision irrigation systems manage over 10 million hectares of farmland worldwide, reducing water consumption by up to 4,000 cubic meters per hectare annually.
Government Initiatives and Agritech Investments
Supportive government policies and financial incentives are fueling the expansion of smart agriculture. Public-private partnerships and subsidies for precision farming equipment encourage adoption among small and medium-scale farmers. Venture capital investments in agritech startups have surged, focusing on automation, robotics, and data analytics. This financial and regulatory backing is enabling innovation, expanding digital infrastructure, and improving accessibility of smart agriculture solutions across global farming communities.
Key Trends & Opportunities
Integration of AI, Big Data, and Machine Learning
AI and data analytics are revolutionizing smart agriculture by enabling predictive insights for yield optimization, pest control, and climate adaptation. Machine learning algorithms process data from sensors and drones to guide farmers’ decisions in real time. These technologies enhance accuracy in crop management and forecasting, reducing dependency on manual observation. The growing adoption of AI platforms creates opportunities for agritech companies to deliver more intelligent and scalable farming solutions globally.
- For instance, IBM's Watson Decision Platform for Agriculture utilizes AI, IoT, and weather data to provide insights for farmers on crop management and yield predictions, with pilot programs successfully implemented in regions like India.
Expansion of Drone and Robotics Applications
Drones and agricultural robots are gaining traction for field mapping, spraying, and crop surveillance. Their efficiency in covering large areas with minimal labor input reduces operational costs and increases accuracy in field management. The growing affordability of UAV technology and autonomous systems enables large-scale implementation in both crop and livestock management. Manufacturers are developing multi-purpose drones and robotic harvesters to meet diverse farming needs, creating new opportunities in the smart agriculture ecosystem.
- For instance, DJI Agriculture had deployed approximately 400,000 Agras drones globally by the end of 2024, with the newest models capable of spraying over 50 acres per hour with centimeter-level precision using RTK navigation.
Key Challenges
High Initial Costs and Limited Access for Small Farmers
The high cost of advanced agricultural technologies, including sensors, drones, and automation systems, remains a key challenge. Small-scale farmers in developing countries often lack access to financing and digital infrastructure. This limits widespread adoption despite growing awareness of smart farming benefits. Expanding micro-financing schemes, equipment leasing, and government-backed credit programs are essential to bridge the affordability gap.
Data Privacy and Connectivity Constraints
Smart agriculture relies heavily on real-time data collection and cloud-based systems, making cybersecurity and connectivity critical concerns. Limited internet access in rural areas hampers seamless data transmission, while weak data protection frameworks raise privacy risks. Farmers and service providers must invest in secure, scalable networks to prevent breaches. Strengthening rural connectivity and implementing strict data governance policies are necessary to ensure trust and reliability in digital agriculture operations.
Regional Analysis
North America
North America held a 33.7% share of the smart agriculture market in 2024, driven by strong technological infrastructure and widespread adoption of precision farming solutions. The U.S. leads the region with extensive use of IoT-enabled sensors, drones, and autonomous tractors. Supportive government programs promoting sustainable agriculture and water-efficient irrigation systems further accelerate adoption. High investments by agritech companies and research institutions enhance innovation in data-driven farming. Canada contributes significantly through greenhouse automation and livestock monitoring technologies, solidifying North America’s position as a leader in digital and connected farming solutions.
Europe
Europe accounted for a 27.8% share of the smart agriculture market in 2024. The region’s growth is supported by stringent environmental regulations and strong emphasis on sustainable and organic farming practices. Countries such as Germany, France, and the Netherlands lead adoption due to advanced agricultural mechanization and government-backed digital farming initiatives. The European Union’s Common Agricultural Policy encourages smart irrigation and precision livestock management. Rising labor costs and climate change adaptation needs further drive automation and AI integration, ensuring the region’s steady transition toward highly efficient and eco-friendly farming systems.
Asia-Pacific
Asia-Pacific led the smart agriculture market with a 29.5% share in 2024, emerging as the fastest-growing regional market. Rapid population growth and shrinking arable land have accelerated demand for advanced farming technologies. China, Japan, and India are key markets, focusing on drone monitoring, soil mapping, and automated irrigation systems to boost productivity. Government subsidies for agritech startups and precision agriculture equipment encourage adoption among farmers. Increasing smartphone penetration and digital platforms for farm management strengthen regional progress, making Asia-Pacific a key contributor to global agricultural digitization and sustainability.
Latin America
Latin America held a 5.2% share of the smart agriculture market in 2024. Brazil and Argentina lead the region due to the rising use of GPS-guided machinery, crop monitoring drones, and smart irrigation systems. Expanding agribusiness operations and increasing exports of grains and soybeans drive technology adoption. However, uneven connectivity and high initial costs limit large-scale deployment in remote areas. Ongoing collaborations between global agritech firms and local producers are improving technology accessibility and awareness, positioning Latin America as an emerging market for precision and sustainable farming solutions.
Middle East & Africa
The Middle East & Africa region captured a 3.8% share of the smart agriculture market in 2024. Growth is fueled by rising investments in water-efficient farming and desert agriculture technologies. The UAE, Saudi Arabia, and South Africa lead in adopting automated irrigation, climate-controlled greenhouses, and soil sensors to improve productivity in arid regions. Limited arable land and growing food demand are driving the shift toward technology-led farming. Government-backed programs promoting digital agriculture and partnerships with global technology providers are helping bridge infrastructure gaps and foster long-term regional growth.
Market Segmentations:
By Product Type
- Hardware & equipment
- Software & digital platforms
- Services & connectivity
By Application
- Crop production
- Livestock management
- Post-harvest & supply chain
By Geography
- North America
- U.S.
- Canada
- Mexico
- Europe
- Germany
- France
- U.K.
- Italy
- Spain
- Rest of Europe
- Asia Pacific
- China
- Japan
- India
- South Korea
- South-east Asia
- Rest of Asia Pacific
- Latin America
- Brazil
- Argentina
- Rest of Latin America
- Middle East & Africa
- GCC Countries
- South Africa
- Rest of the Middle East and Africa
Competitive Landscape
The smart agriculture market is highly competitive, featuring key players such as Monarch Tractor, CNH Industrial, Bayer, Kubota, Mahindra & Mahindra, Carbon Robotics, CLAAS Group, AGCO, Farmers Edge, and John Deere & Company. These companies focus on integrating advanced technologies such as IoT, AI, robotics, and data analytics to enhance farm productivity and sustainability. Leading players invest heavily in automation, precision farming equipment, and AI-powered farm management platforms. Strategic collaborations and acquisitions strengthen their technological portfolios and global market presence. Companies like John Deere and AGCO are pioneering autonomous machinery and connected tractor systems, while Bayer and Farmers Edge emphasize digital crop management and predictive analytics. The competition is further intensified by the rise of startups developing affordable precision tools for small and mid-sized farms. Overall, innovation, scalability, and data-driven insights remain central to maintaining leadership in the rapidly evolving smart agriculture industry.
Key Player Analysis
- Monarch Tractor
- CNH Industrial
- Bayer
- Kubota
- Mahindra & Mahindra
- Carbon Robotics
- CLAAS Group
- AGCO
- Farmers Edge
- John Deere & Company
Recent Developments
- In May 2025, Bayer AG announced a re-organisation of its Crop Science division in Germany to focus on strategic technologies, including ceasing some production and R&D activities at its Frankfurt site by end of 2028.
- In February 2025, Monarch Tractor began commercial rollout of its Autodrive™ fully-autonomous feature in its MK-V driver-optional tractor platform.
- In January 2025, Deere & Company (branded as John Deere) revealed several new autonomous agricultural machines at the CES 2025 show, including a second-generation autonomy kit with advanced computer vision and AI integration.
- In December 2024, Monarch announced the establishment of Monarch Tractor Europe N.V. headquartered in Antwerp, Belgium, signalling its formal entry into the European market with its MK-V electric tractor.
Report Coverage
The research report offers an in-depth analysis based on Product Type, Application and Geography. It details leading market players, providing an overview of their business, product offerings, investments, revenue streams, and key applications. Additionally, the report includes insights into the competitive environment, SWOT analysis, current market trends, as well as the primary drivers and constraints. Furthermore, it discusses various factors that have driven market expansion in recent years. The report also explores market dynamics, regulatory scenarios, and technological advancements that are shaping the industry. It assesses the impact of external factors and global economic changes on market growth. Lastly, it provides strategic recommendations for new entrants and established companies to navigate the complexities of the market.
Future Outlook
- Adoption of IoT-based sensors and automation tools will continue to expand globally.
- AI and data analytics will play a key role in predictive crop management and yield optimization.
- Autonomous tractors, drones, and robotic harvesters will become standard in large-scale farming.
- Integration of cloud-based farm management systems will enhance operational efficiency and traceability.
- Demand for sustainable and water-efficient farming technologies will rise across all regions.
- Governments will increase investments and subsidies to promote digital agriculture adoption.
- Agritech startups will drive innovation with affordable and scalable precision farming tools.
- Partnerships between technology providers and equipment manufacturers will strengthen product ecosystems.
- Expansion of 5G networks will improve real-time data transmission and machine connectivity.
- Asia-Pacific will remain a key growth hub due to expanding agricultural digitization and urban food demand.

Request a Free Sample
Fill in your details and we'll send you a free sample report.
- Sample data tables & charts
- Research methodology
Need a Custom Version of This Report?
Tailor the scope, geography, or segments to your exact requirements.
- Custom geography or segment scope
- Direct access to our analyst team
Frequently Asked Questions
What is the current market size for Smart Agriculture Market, and what is its projected size in 2032?
At what Compound Annual Growth Rate is the Smart Agriculture Market projected to grow between 2025 and 2032?
Which Smart Agriculture Market segment held the largest share in 2024?
What are the primary factors fueling the growth of the Smart Agriculture Market?
Who are the leading companies in the Smart Agriculture Market?
Which region commanded the largest share of the Smart Agriculture Market in 2024?
Table of Content
Chapter 1 Market Segmentation
- 1.1 Segmentation Framework
- 1.1.1 Product and Service Classification
- 1.1.2 Application and End-Use Classification
- 1.1.3 Technology and Solution Classification
- 1.1.4 Customer and Distribution Channel Classification
- 1.1.5 Geographic Segmentation
- 1.1.6 Market Segment Definitions and Boundaries
Chapter 2 Introduction
- 2.1 Report Objectives and Scope
- 2.2 Product Definition and Industry Terminology
- 2.3 Market Inclusions and Exclusions
- 2.4 Research Process
- 2.4.1 Primary Research and Expert Interviews
- 2.4.2 Secondary Research and Source Review
- 2.4.3 Top-Down and Bottom-Up Estimation
- 2.4.4 Data Triangulation and Verification
- 2.5 Market Size Measurement Basis
- 2.5.1 2024: USD 20.68 billion → 2032: USD 51.93 billion
- 2.6 Historical and Forecast Reference Periods
- 2.6.1 Base Year: 2024
- 2.6.2 Forecast Period: 2024-2032
- 2.7 Research Assumptions and Limitations
Chapter 3 Executive Summary
- 3.1 Market Snapshot and Key Findings
- 3.2 Base-Year Market Size, 2024
- 3.3 Forecast Market Size, 2032
- 3.4 Revenue and Volume Growth Outlook
- 3.5 Key Demand and Supply Indicators
- 3.6 Leading Market Segments
- 3.7 Fastest-Growing Market Opportunities
- 3.8 Regional Performance Highlights
- 3.9 Technology and Industry Transformation
- 3.10 Competitive Landscape Summary
- 3.11 Analyst View and Strategic Implications
Chapter 4 Global Smart Agriculture Market Trends and Developments
- 4.1 Historical Industry Development
- 4.2 Recent Market Trends and Developments
- 4.3 Demand and Customer Behavior Trends
- 4.4 Technology and Product Innovation
- 4.5 Artificial Intelligence, Automation and Digitalization
- 4.6 Local Manufacturing and Supply Chain Realignment
- 4.7 Industry Partnerships, Mergers and Acquisitions
- 4.8 Sustainability and Circular Economy Developments
- 4.9 Government and Private Sector Investment Trends
- 4.10 Emerging Business Models and Commercialization
- 4.11 Industry Developments and Announcements
Chapter 5 Global Smart Agriculture Market Production, Supply and Demand Analysis
- 5.1 Demand Trend and Consumption Analysis
- 5.2 Demand Forecast, 2024-2032
- 5.3 Production and Output Trend
- 5.4 Production and Output Forecast, 2024-2032
- 5.5 Installed Capacity and Capacity Utilization
- 5.6 Company-Wise Production Plants and Statistics
- 5.6.1 Installed Production Capacity
- 5.6.2 Actual Production
- 5.6.3 Planned Capacity and Expansion Targets
- 5.7 Supply Chain Structure and Procurement Trends
- 5.8 Supply-Demand Gap and Bottlenecks
- 5.9 Import Dependence and Sourcing Structure
- 5.10 Contract Manufacturing and Outsourcing
- 5.11 Regional Supply and Demand Concentration
Chapter 6 Global Smart Agriculture Market Pricing Analysis
- 6.1 Pricing Structure and Measurement
- 6.2 Historical Pricing Trends
- 6.3 Pricing Outlook, 2024-2032
- 6.4 Average Selling Price and Unit Economics
- 6.5 Pricing by Product and Market Segment
- 6.6 Geographic Pricing Differences
- 6.7 Key Input, Energy, Labor and Logistics Costs
- 6.8 Contract Pricing and Purchasing Models
- 6.9 Pricing Sensitivity and Competitive Positioning
- 6.10 Price, Margin and Profitability Implications
Chapter 7 Global Smart Agriculture Market Dynamics
- 7.1 Market Growth Drivers
- 7.1.1 Demand-Side Drivers
- 7.1.2 Technology and Innovation Drivers
- 7.1.3 Infrastructure and Investment Drivers
- 7.1.4 Regulatory and Policy Drivers
- 7.2 Market Restraints
- 7.2.1 Cost and Affordability Constraints
- 7.2.2 Technology and Adoption Barriers
- 7.2.3 Supply Chain and Operational Constraints
- 7.3 Market Challenges
- 7.3.1 Competitive Pressure and Margin Erosion
- 7.3.2 Skills, Infrastructure and Implementation Gaps
- 7.4 Emerging Market Opportunities
- 7.5 Market Dynamics Impact and Time-Horizon Assessment
Chapter 8 Global Smart Agriculture Value Chain Analysis
- 8.1 Industry Value Chain Overview
- 8.2 Upstream Suppliers and Critical Inputs
- 8.3 Technology and Component Providers
- 8.4 Manufacturing or Service Delivery
- 8.5 Distribution, Channel Partners and Integrators
- 8.6 Downstream Applications and End Users
- 8.7 Value Addition and Profit Pools
- 8.8 Vertical Integration and Outsourcing
- 8.9 Supplier Concentration and Risk
- 8.10 Supply Chain Localization and Resilience
Chapter 9 Global Smart Agriculture Market Regulations and Policies
- 9.1 Relevant Laws, Standards and Compliance Frameworks
- 9.2 Product, Service, Safety and Quality Requirements
- 9.3 Government Policies, Incentives and Subsidies
- 9.4 Imports, Exports and Trade Barriers
- 9.5 Public Procurement and Local Content Requirements
- 9.6 Environmental and Sustainability Compliance
- 9.7 Upcoming Policy Changes and Market Implications
Chapter 10 Global Smart Agriculture Market Hotspots and Opportunities
- 10.1 Market Opportunity Mapping and Growth Hotspots
- 10.2 High-Growth Applications and Customer Groups
- 10.3 Underserved Markets and White-Space Opportunities
- 10.4 Emerging Technology and Product Opportunities
- 10.5 New Capacity and Investment Hotspots
- 10.6 Market Entry and Expansion Opportunities
- 10.7 Distribution and Partnership Opportunities
- 10.8 Near-Term and Long-Term Commercial Potential
- 10.9 Opportunity Attractiveness and Execution Risks
Chapter 11 Global Smart Agriculture Market Outlook, 2024-2032
- 11.1 Market Size and Analysis
- 11.1.1 Revenue (Market Measurement: 2024: USD 20.68 billion → 2032: USD 51.93 billion)
- 11.1.2 Market Volume and Quantity Sold
- 11.1.3 Historical Market Size
- 11.1.4 Base-Year Market Size, 2024
- 11.2 Market Forecast, 2024-2032
- 11.2.1 Revenue Forecast to 2032
- 11.2.2 Volume Forecast to 2032
- 11.2.3 CAGR and Year-on-Year Growth
- 11.2.4 Incremental Revenue Opportunity
- 11.3 Forecast Assumptions and Scenario Analysis
- 11.3.1 Base-Case Forecast
- 11.3.2 Optimistic and Conservative Scenarios
- 11.3.3 Technology, Pricing and Policy Sensitivities
- 11.4 Market Attractiveness and Growth Outlook
Chapter 12 Global Smart Agriculture Market Segmentation and Outlook
- 12.1 Segmentation Summary and Market Shares, 2024
- 12.2 Largest and Fastest-Growing Segments
- 12.3 Segment Growth Comparison
- 12.4 Segment Attractiveness and Priority Matrix
Chapter 13 Global Smart Agriculture Geographic Market Outlook, 2024-2032
- 13.1 Regional Market Size and Share, 2024
- 13.2 Regional Market Forecast, 2024-2032
- 13.3 Regional Pricing, Production and Demand Differences
- 13.4 North America
- 13.4.1 United States
- 13.4.2 Canada
- 13.4.3 Mexico
- 13.5 Europe
- 13.5.1 Germany
- 13.5.2 France
- 13.5.3 Italy
- 13.5.4 United Kingdom
- 13.5.5 Spain
- 13.5.6 Poland
- 13.5.7 Russia
- 13.5.8 Netherlands
- 13.5.9 Belgium
- 13.5.10 Sweden
- 13.5.11 Denmark
- 13.5.12 Norway
- 13.5.13 Rest of Europe
- 13.6 Asia Pacific
- 13.6.1 China
- 13.6.2 India
- 13.6.3 Japan
- 13.6.4 South Korea
- 13.6.5 Thailand
- 13.6.6 Indonesia
- 13.6.7 Vietnam
- 13.6.8 Malaysia
- 13.6.9 Australia
- 13.6.10 Rest of Asia Pacific
- 13.7 Latin America
- 13.7.1 Brazil
- 13.7.2 Argentina
- 13.7.3 Colombia
- 13.7.4 Chile
- 13.7.5 Rest of Latin America
- 13.8 Middle East
- 13.8.1 Saudi Arabia
- 13.8.2 United Arab Emirates
- 13.8.3 Turkey
- 13.8.4 Israel
- 13.8.5 Iran
- 13.8.6 Rest of the Middle East
- 13.9 Africa
- 13.9.1 South Africa
- 13.9.2 Egypt
- 13.9.3 Nigeria
- 13.9.4 Morocco
- 13.9.5 Rest of Africa
- 13.10 Regional Investment, Policy and Supply Chain Differences
- 13.11 Regional Competitive Landscape
- 13.12 Geographic Growth Hotspots
Chapter 14 Global Smart Agriculture Technology, Innovation and Sustainability Outlook
- 14.1 Technology Landscape and Maturity
- 14.2 Product, Process and Service Innovation
- 14.3 AI, Automation and Digital Tools in the Industry
- 14.4 Technology Adoption and Performance Benchmarking
- 14.5 Innovation Pipeline and R&D Investment
- 14.6 Patent and Intellectual Property Trends
- 14.7 Energy Efficiency and Resource Management
- 14.8 Sustainability, Recycling and Circularity
- 14.9 Technology Roadmap, 2024-2032
- 14.10 Risks of Obsolescence and Technology Substitution
Chapter 15 Global Smart Agriculture Market Key Strategic Imperatives
- 15.1 Growth and Market Entry Priorities
- 15.2 High-Return Products and Segments
- 15.3 Pricing, Profitability and Cost Optimization
- 15.4 Technology Investment and Product Differentiation
- 15.5 Supply Chain Localization and Resilience
- 15.6 Distribution and Customer Acquisition
- 15.7 Partnership, Acquisition and Capacity Strategy
- 15.8 Regional Expansion Priorities
- 15.9 Short-, Medium- and Long-Term Actions
Chapter 16 Competition Outlook
- 16.1 Industry Competition Characteristics
- 16.2 Market Structure and Concentration
- 16.3 Market Share and Competitive Positioning, 2024
- 16.4 Company-Wise Revenue and Product Benchmarking
- 16.5 Production and Service Capacity Benchmarking
- 16.6 Technology, Pricing and Differentiation
- 16.7 Regional Footprint and Distribution Strength
- 16.8 Mergers, Acquisitions and Strategic Alliances
- 16.9 New Entrants and Competitive Threats
- 16.10 Porter's Five Forces and Industry Attractiveness
- 16.11 Competitive Outlook, 2024-2032
Chapter 17 Company Profiles
- 17.1 Company Coverage and Selection Criteria
- 17.2 Leading Market Participants – Standard Profile Structure
- 17.2.1 Business Description
- 17.2.2 Company Ownership and Geographic Presence
- 17.2.3 Product and Service Portfolio
- 17.2.4 Manufacturing and Operating Footprint
- 17.2.5 Production Capacity and Expansion Plans
- 17.2.6 Financial Performance and Investment
- 17.2.7 Market Share and Competitive Position
- 17.2.8 Technology and Innovation Capabilities
- 17.2.9 Strategic Alliances or Partnerships
- 17.2.10 Recent Developments
- 17.2.11 Growth Strategy and Outlook
- 17.3 Other Relevant Market Participants
Note: Every listed company is profiled on the structure shown under the first company. The company list is preliminary and may change based on research findings, market developments, data availability and client requirements.
Chapter 18 Disclaimer
- 18.1 Research and Forecast Disclaimer
- 18.2 Data Source and Estimation Limitations
Note: The depth of individual sections depends on data availability for this market. Volume, capacity, trade and other unit-based metrics are included where applicable.

