
Market Overview:
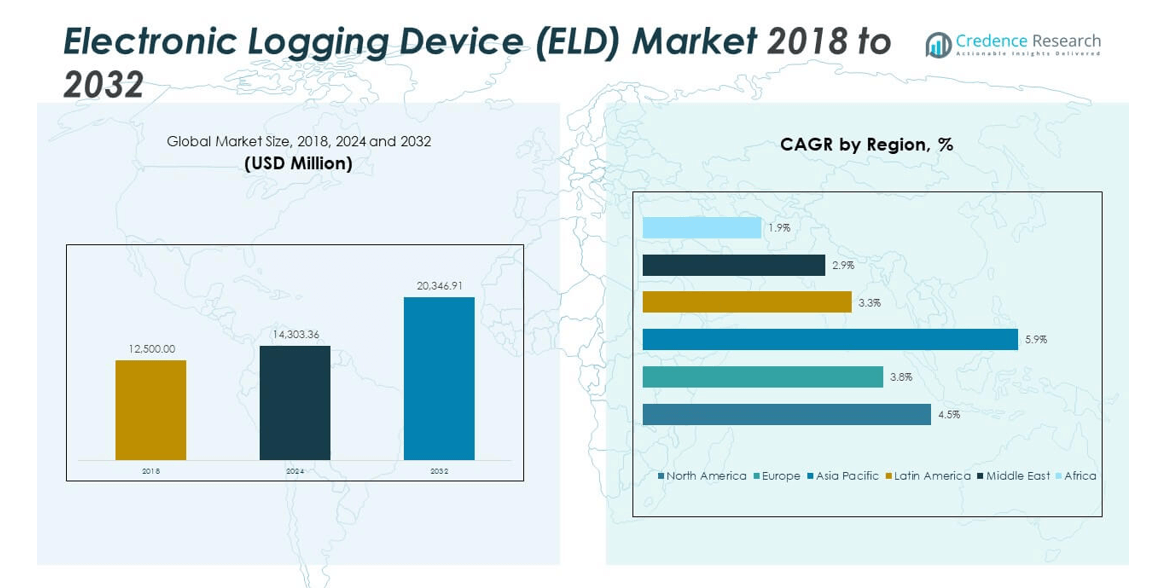
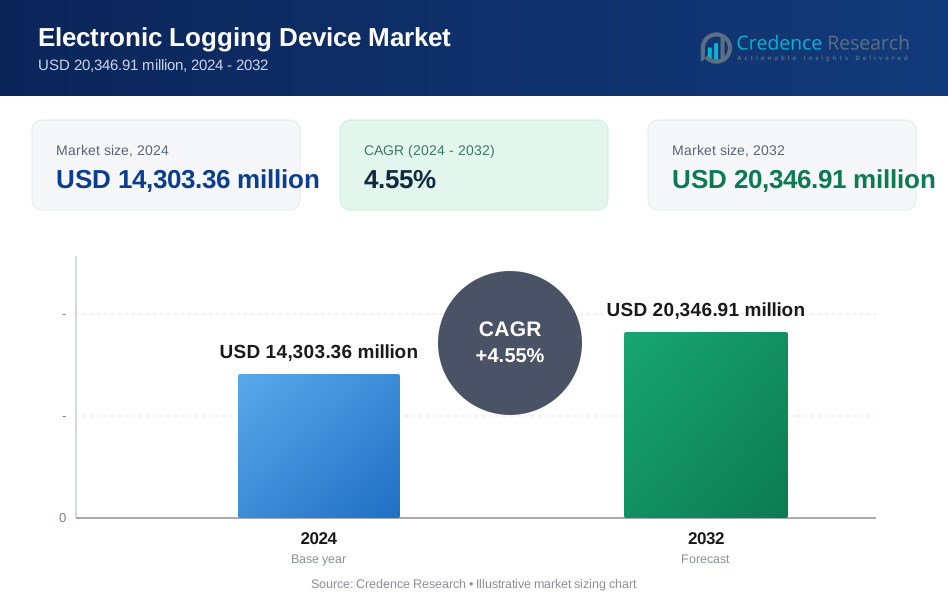
The Electronic Logging Device Market size was valued at USD 12,500.00 million in 2018 to USD 14,303.36 million in 2024 and is anticipated to reach USD 20,346.91 million by 2032, at a CAGR of 4.55% during the forecast period.
| REPORT ATTRIBUTE | DETAILS |
|---|---|
| Historical Period | 2020-2023 |
| Base Year | 2024 |
| Forecast Period | 2025-2032 |
| Electronic Logging Device Market Size 2024 | USD 14,303.36 million |
| Electronic Logging Device Market, CAGR | 4.55% |
| Electronic Logging Device Market Size 2032 | USD 20,346.91 million |
Growth in the Electronic Logging Device Market is driven by strict regulatory mandates for driver hour tracking and fleet compliance. Increasing emphasis on road safety and fuel efficiency encourages transport companies to adopt automated systems for monitoring operations. It gains momentum from expanding logistics and e-commerce industries that rely on digital tools for real-time fleet visibility. The integration of cloud, IoT, and analytics solutions enhances data accuracy and compliance reporting, supporting large-scale adoption across commercial vehicle operators.
North America leads the market due to early regulatory enforcement and high telematics adoption. Europe follows with widespread digital tachograph usage and unified transport safety policies. Asia Pacific emerges as the fastest-growing region, supported by expanding logistics infrastructure and rapid digital transformation in commercial fleets. Latin America, the Middle East, and Africa show gradual progress, driven by modernization efforts and increasing awareness of fleet management efficiency.
Market Insights:
- The Electronic Logging Device Market was valued at USD 12,500.00 million in 2018, reached USD 14,303.36 million in 2024, and is projected to achieve USD 20,346.91 million by 2032, growing at a CAGR of 4.55%.
- North America dominates with a 41.7% share due to strong regulatory mandates, advanced telematics infrastructure, and high fleet compliance adoption across the U.S. and Canada.
- Europe follows with a 24.4% share, supported by the EU’s transport digitalization policies and widespread integration of ELDs for cross-border logistics and driver safety management.
- Asia Pacific accounts for 27.1% and remains the fastest-growing region, driven by rapid logistics expansion, e-commerce growth, and digital transformation across China, India, and Japan.
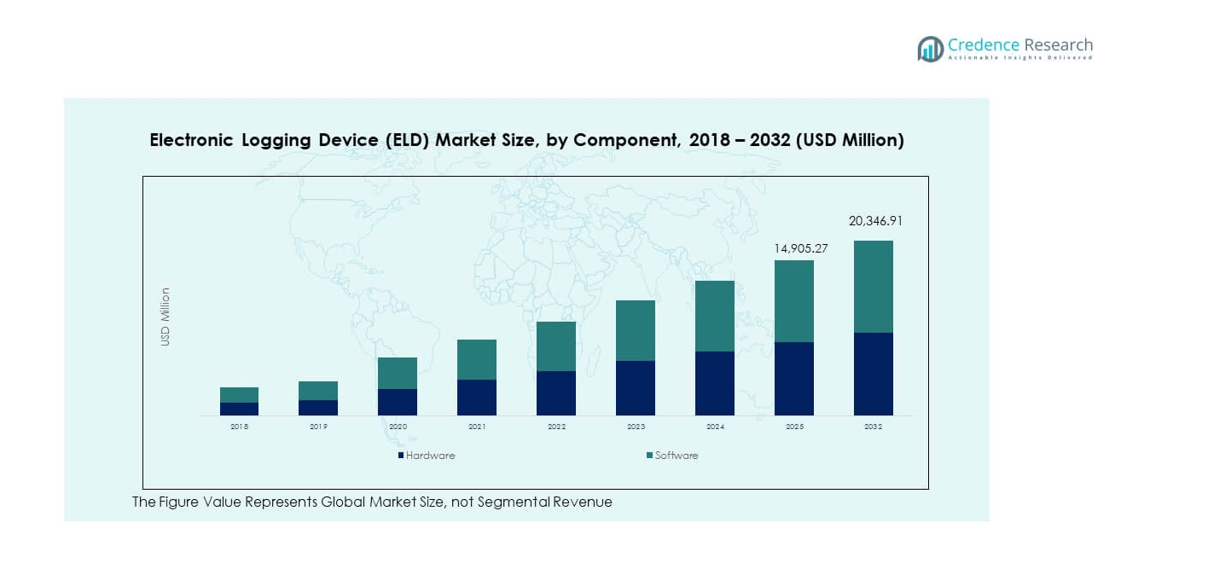
- Hardware accounts for nearly 60% of segment revenue due to regulatory installation requirements, while software holds around 40%, reflecting rising demand for analytics-driven compliance and fleet management solutions.
Market Drivers
Growing Enforcement of Vehicle Compliance Regulations and Hours-of-Service Rules
Strict government regulations for commercial fleet safety drive strong adoption of electronic logging devices. The U.S. ELD mandate and similar global policies make compliance mandatory across carriers. Transport firms depend on digital records to reduce violations and improve driver accountability. The Electronic Logging Device Market grows rapidly as fleets modernize operations. Automated data tracking reduces paperwork, human error, and administrative costs. It improves transparency in managing driving hours and vehicle use. Strict enforcement by authorities pushes even smaller fleets to install devices. Compliance technology becomes a key business requirement in transport operations worldwide.
- For instance, Geotab's ELD maintains an overall device failure rate considerably less than 1%, far below industry standards, ensuring reliable automatic recording of driving time and engine data.
Rising Focus on Driver Safety, Fleet Efficiency, and Real-Time Monitoring
Fleet operators adopt telematics systems to enhance vehicle safety and performance. Real-time monitoring allows managers to track driver behavior and prevent fatigue-related risks. It supports efficient route management and helps reduce unnecessary fuel use. The Electronic Logging Device Market benefits from integration with GPS, IoT, and cloud systems. Transport companies gain visibility into driving habits and compliance levels. It reduces accident risks, increases accountability, and boosts driver productivity. Data-driven management strengthens decision-making and operational reliability. Safety-focused strategies continue to fuel investment in connected fleet solutions.
Increasing Fleet Digitization and Transition Toward Automated Operations
Automation and connectivity are reshaping transport logistics worldwide. Companies are digitizing fleet operations to meet rising demand for transparency and control. Electronic logging devices enable seamless recordkeeping across connected systems. The Electronic Logging Device Market expands as firms adopt integrated platforms. It supports predictive maintenance and helps manage downtime efficiently. Operators use digital analytics to plan routes and optimize deliveries. Growing e-commerce logistics increases the need for automated tracking systems. Fleet modernization continues to accelerate digital transformation in transportation networks.
- For instance, Omnitracs’ ELD platform offers cloud-based analytics and over-the-air software updates that enable continuous automated logging and fleet compliance. Its connected ecosystem supports reliable data management and real-time visibility across diverse commercial fleets.
Rising Demand for Cost Reduction and Operational Transparency in Logistics
Transport companies prioritize systems that improve performance and reduce fuel and labor costs. Electronic logging devices simplify workflow management and reduce manual data entry. The Electronic Logging Device Market gains momentum as firms seek better financial control. It helps managers identify inefficiencies in fleet usage and idle time. Transparent data reporting supports accurate billing and customer trust. Fleets with efficient tracking systems improve profitability and service reliability. The combination of compliance, visibility, and savings drives market adoption. Operational transparency remains a core value for logistics efficiency worldwide.
Market Trends
Integration of Artificial Intelligence and Predictive Analytics in Fleet Management
AI integration transforms how fleets use data from electronic logging devices. Predictive analytics helps detect risks before they cause breakdowns or delays. It supports driver scoring models that promote safety and compliance improvements. The Electronic Logging Device Market evolves toward intelligent automation. It helps predict fuel needs, monitor maintenance, and optimize delivery timing. AI-driven insights increase productivity and extend vehicle lifespan. Companies value tools that merge compliance with operational foresight. Advanced analytics redefine modern fleet performance standards.
- For instance, DBB Software develops AI-driven fleet management platforms that use IoT and cloud integration to enable predictive maintenance and optimize vehicle performance. Its solutions help improve operational efficiency, safety, and scalability across connected transport systems.
Growing Use of Cloud Platforms and Internet of Things (IoT) Connectivity
Cloud-based platforms simplify large-scale fleet management and data storage. IoT connectivity allows devices to sync data in real time for improved accuracy. The Electronic Logging Device Market benefits from this seamless data ecosystem. It connects vehicles, drivers, and administrators through unified dashboards. Firms analyze performance across fleets from any location. Real-time connectivity enhances decision-making and response speed. Scalability of cloud solutions attracts global logistics and delivery services. Continuous data exchange strengthens operational agility and reliability.
Emergence of Integrated Mobility Ecosystems Across Transportation Networks
Fleet management now aligns with wider mobility ecosystems that include EVs and autonomous fleets. Integrated platforms link ELDs with smart logistics systems for real-time control. The Electronic Logging Device Market adapts to these ecosystem changes. It allows interoperability with various telematics and transport management solutions. Operators gain visibility across vehicle types and service models. Such integration simplifies operations and strengthens compliance efficiency. Growing investment in smart mobility expands product applications. The evolution of connected infrastructure fuels global adoption.
- For instance, Geotab’s AI Safety Center benchmarks collision risk across mixed fleets and predicts incidents using data from over 100,000 miles traveled, supporting integrated smart mobility platforms
Adoption of Data-Driven Solutions for Predictive Compliance and Decision Support
Fleets depend on advanced software to anticipate compliance risks early. Predictive compliance tools help managers maintain records without manual checks. The Electronic Logging Device Market embraces these digital innovations. It enables data harmonization between inspection agencies and carriers. Managers gain predictive insights that enhance decision reliability. Real-time alerts support corrective actions before rule violations occur. Companies adopt systems that simplify audit processes and reporting. Data automation continues to define future compliance frameworks globally.
Market Challenges Analysis
High Implementation Costs and Integration Barriers Among Small Fleet Operators
Initial hardware, installation, and software expenses challenge smaller transport companies. Many small fleets delay ELD adoption due to limited budgets and lack of digital infrastructure. The Electronic Logging Device Market faces uneven growth across business sizes. It often requires training, technical support, and software upgrades. Integration with legacy systems becomes complex for traditional operators. It limits adoption speed and increases total ownership costs. Some firms remain hesitant to invest due to uncertain ROI. The financial and operational strain slows penetration in cost-sensitive markets.
Data Privacy Concerns and Limited Standardization Across Global Regulations
Concerns over data security and unauthorized access remain significant. Drivers worry about constant surveillance, while carriers seek secure data transmission. The Electronic Logging Device Market must align with multiple regional rules. It faces challenges in standardizing data formats and reporting systems. Privacy laws differ across jurisdictions, making compliance complex. Companies need strong encryption and transparent data policies. It increases software development and certification costs. Trust-building through secure platforms becomes critical for long-term market confidence.
Market Opportunities
Expansion into Developing Regions with Growing Logistics Infrastructure and Regulation
Emerging economies expand their logistics and transport infrastructure rapidly. Governments introduce digital compliance laws to improve safety and accountability. The Electronic Logging Device Market sees strong entry potential in Asia and Latin America. It benefits from rising cross-border trade and modernization programs. Local manufacturers invest in affordable, region-specific ELD solutions. Partnerships with fleet operators accelerate technology adoption. It enables smaller carriers to meet evolving safety standards. Regulation-driven growth creates new revenue channels across developing markets.
Adoption of Advanced Features Such as Predictive Maintenance and Smart Analytics
Manufacturers add predictive analytics, AI, and vehicle health tracking to attract fleets. These features enhance value beyond compliance by improving operational insights. The Electronic Logging Device Market evolves toward integrated fleet intelligence. It empowers managers to anticipate failures and manage performance. Smart analytics support decision-making and performance benchmarking. Fleets using such devices gain measurable efficiency improvements. It creates long-term savings and supports sustainability goals. ELD evolution into intelligent platforms ensures continued growth opportunities.
Market Segmentation Analysis:
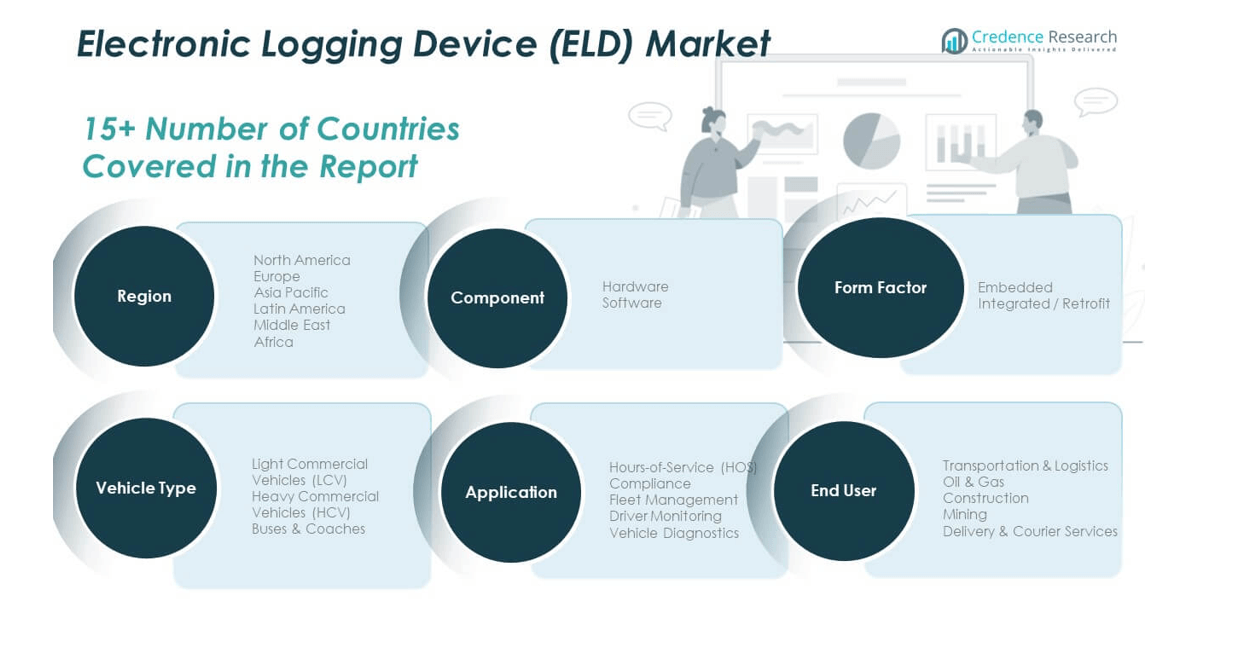
The Electronic Logging Device Market is segmented by component, application, end-user, form factor, and vehicle type.
By component, hardware holds a major share due to high demand for durable and compliant tracking units across commercial fleets. Software grows steadily with the adoption of data analytics, cloud integration, and mobile connectivity that enhance real-time reporting and compliance accuracy. Integration between hardware and software platforms improves automation and fleet visibility, supporting seamless operational control across transport networks.
- For instance, MiX Telematics hardware supports fleet and asset tracking with high system uptime of 99.9%. Software grows steadily with the adoption of data analytics, cloud integration, and mobile connectivity that enhance real-time reporting and compliance accuracy.
By application, Hours-of-Service (HOS) compliance leads due to strict enforcement of driver working hours. Fleet management follows, driven by the need for efficient routing and vehicle tracking. Driver monitoring and vehicle diagnostics gain momentum as fleets seek predictive maintenance and performance analytics to ensure safety and reduce downtime. By end-user, transportation and logistics dominate the demand landscape, supported by heavy fleet deployment. Oil and gas, construction, and mining sectors adopt ELDs for compliance and safety in remote operations. Delivery and courier services expand usage to manage increasing urban delivery volumes.
- For instance, Lytx Compliance Services audits driver logs from multiple ELD providers, processes data within 24-48 hours, and offers dashboards for detailed compliance risk visibility.
By form factor, embedded systems gain traction in new-generation vehicles for reliable integration, while retrofit devices remain popular among existing fleets. By vehicle type, heavy commercial vehicles lead adoption due to regulatory obligations and long-haul operations. Light commercial vehicles and buses follow as ELD use expands to passenger and regional delivery segments. This diverse segmentation highlights the market’s broad industrial relevance and increasing alignment with digital fleet transformation.
Segmentation:
By Component
- Hardware
- Software
By Application
- Hours-of-Service (HOS) Compliance
- Fleet Management
- Driver Monitoring
- Vehicle Diagnostics
By End-User
- Transportation & Logistics
- Oil & Gas
- Construction
- Mining
- Delivery & Courier Services
By Form Factor
- Embedded
- Integrated / Retrofit
By Vehicle Type
- Light Commercial Vehicles (LCV)
- Heavy Commercial Vehicles (HCV)
- Buses & Coaches
By Region
- North America
- U.S.
- Canada
- Mexico
- Europe
- Germany
- France
- U.K.
- Italy
- Spain
- Rest of Europe
- Asia Pacific
- China
- Japan
- India
- South Korea
- South-east Asia
- Rest of Asia Pacific
- Latin America
- Brazil
- Argentina
- Rest of Latin America
- Middle East & Africa
- GCC Countries
- South Africa
- Rest of the Middle East and Africa
Regional Analysis:
North America
The North America Electronic Logging Device Market size was valued at USD 5,262.50 million in 2018 to USD 5,958.70 million in 2024 and is anticipated to reach USD 8,466.39 million by 2032, at a CAGR of 4.5% during the forecast period. North America accounts for nearly 41.7% of the global market share, driven by early regulatory mandates and strong telematics adoption. The region’s Federal Motor Carrier Safety Administration (FMCSA) rule enforces strict compliance across commercial fleets, ensuring near-universal use of ELDs. It benefits from advanced connectivity, high vehicle digitization, and established fleet management infrastructure. Key providers such as Samsara, Geotab, and Omnitracs lead innovation with AI-enabled analytics and integrated compliance systems. Transport companies across the U.S., Canada, and Mexico continue expanding ELD integration to enhance transparency and safety. It maintains technological leadership through advanced software ecosystems and scalable service models that support regional logistics expansion.
Europe
The Europe Electronic Logging Device Market size was valued at USD 3,175.00 million in 2018 to USD 3,486.77 million in 2024 and is anticipated to reach USD 4,674.76 million by 2032, at a CAGR of 3.8% during the forecast period. Europe contributes about 24.4% of the total market, supported by growing fleet automation and unified transport policies. The region benefits from the EU’s mobility package and digital tachograph directives promoting driver safety and compliance. It emphasizes sustainable transport systems that integrate ELD data into eco-driving frameworks. Germany, the UK, and France remain leading adopters with advanced logistics and vehicle tracking networks. Fleet operators invest in cloud-based ELDs for multi-country reporting and analytics. Rising demand for cross-border visibility and performance efficiency boosts adoption across European carriers. It continues to evolve toward connected, low-emission logistics systems that align with environmental and operational goals.
Asia Pacific
The Asia Pacific Electronic Logging Device Market size was valued at USD 2,837.50 million in 2018 to USD 3,401.99 million in 2024 and is anticipated to reach USD 5,377.71 million by 2032, at a CAGR of 5.9% during the forecast period. The region represents nearly 27.1% of the global share, showing the fastest growth pace globally. Rising logistics activities in China, India, Japan, and Southeast Asia drive high adoption rates. Governments encourage transport digitalization through smart fleet programs and vehicle tracking mandates. It gains traction due to expanding e-commerce, infrastructure investment, and competitive telematics pricing. Local and global vendors collaborate to deliver cost-effective and scalable ELD solutions. The market benefits from increasing awareness of compliance, road safety, and performance management. It remains the most dynamic region, supported by industrial expansion and rapid fleet modernization.
Latin America
The Latin America Electronic Logging Device Market size was valued at USD 608.75 million in 2018 to USD 687.85 million in 2024 and is anticipated to reach USD 886.51 million by 2032, at a CAGR of 3.3% during the forecast period. Latin America contributes around 4.9% of the global market share, with gradual adoption supported by regulatory progress and logistics growth. Countries such as Brazil and Mexico show stronger implementation due to road transport modernization and regional trade expansion. It benefits from fleet safety awareness and the demand for operational efficiency in long-haul trucking. Local vendors develop affordable retrofit solutions to meet regional fleet requirements. Increasing private investment in digital logistics drives system integration across carriers. The market expands with urbanization and e-commerce growth, improving tracking and compliance capabilities. It holds potential for steady expansion through regulatory harmonization and connected fleet innovations.
Middle East
The Middle East Electronic Logging Device Market size was valued at USD 387.50 million in 2018 to USD 408.98 million in 2024 and is anticipated to reach USD 510.82 million by 2032, at a CAGR of 2.9% during the forecast period. The region accounts for nearly 3.2% of the global market, reflecting moderate adoption driven by fleet modernization programs. GCC countries lead in ELD usage due to smart transport initiatives and growing commercial logistics. It benefits from digital infrastructure and rising investment in intelligent transportation systems. Oil and gas fleets use ELDs to enhance safety and regulatory compliance. Regional players focus on integrating devices with existing telematics for asset tracking. Partnerships with global vendors support technology transfer and compliance monitoring. It continues to develop through diversified fleet operations and government support for transport automation.
Africa
The Africa Electronic Logging Device Market size was valued at USD 228.75 million in 2018 to USD 359.07 million in 2024 and is anticipated to reach USD 430.73 million by 2032, at a CAGR of 1.9% during the forecast period. Africa represents about 2.7% of the global market share, showing early adoption stages but rising interest in fleet safety systems. South Africa leads regional use due to established commercial transport infrastructure. It benefits from donor-funded logistics projects and growing digital awareness. Local fleet operators adopt ELDs to improve asset visibility and reduce downtime. Challenges include limited connectivity and high implementation costs in smaller economies. International vendors target partnerships to expand coverage in emerging corridors. It holds long-term potential through government-led safety campaigns and gradual logistics digitalization across key trade regions.
Key Player Analysis:
- Omnitracs
- Trimble Inc.
- Geotab Inc.
- Teletrac Navman
- Donlen Corporation
- Motive (formerly KeepTruckin)
- Verizon Connect
- Samsara Inc.
- EROAD
- AtlasTracker
- Gorilla Safety
- Pedigree Technologies
- Rand McNally
- Transflo
Competitive Analysis:
The Electronic Logging Device Market features intense competition among several global providers. Leading firms such as Geotab Inc., Samsara Inc., Omnitracs, Trimble Inc. and Verizon Connect compete on hardware-software integration, analytics capabilities and regulatory compliance coverage. Companies differentiate by offering cloud-based telematics, predictive maintenance tools, scalable pricing models and cross-region support. Smaller and niche providers attempt to gain share through cost-effective retrofit kits or flexible subscription models. The market rewards innovation in connectivity, data analytics and ease of deployment, placing pressure on firms to continuously upgrade their offerings. Consolidation and strategic partnerships also shape competitive dynamics. It remains critical for players to balance compliance features, reliability, and user-friendly interfaces to maintain or grow their market positions.
Recent Developments:
- In January 2025, Trimble partnered with Qualcomm to launch an ultra-precise positioning technology for heavy vehicles, offering centimeter-level accuracy designed to improve navigation and safety for automated trucks, with commercial deployment expected by 2028.
- In February 2024, Geotab Inc. partnered with Daimler Trucks North America to integrate its MyGeotab platform with Daimler trucks, boosting data connectivity and fleet management for trucking operations.
Report Coverage:
The research report offers an in-depth analysis based on component, application, end-user, form factor, and vehicle type. It details leading market players, providing an overview of their business, product offerings, investments, revenue streams, and key applications. Additionally, the report includes insights into the competitive environment, SWOT analysis, current market trends, as well as the primary drivers and constraints. Furthermore, it discusses various factors that have driven market expansion in recent years. The report also explores market dynamics, regulatory scenarios, and technological advancements that are shaping the industry. It assesses the impact of external factors and global economic changes on market growth. Lastly, it provides strategic recommendations for new entrants and established companies to navigate the complexities of the market.
Future Outlook:
- The Electronic Logging Device Market will experience consistent growth driven by fleet modernization and regulatory mandates.
- Expansion of cloud-based analytics platforms will increase demand for connected and automated compliance tools.
- Integration of artificial intelligence and machine learning will enhance predictive fleet management and driver monitoring.
- The market will witness greater adoption across small and mid-sized fleets due to affordable ELD subscription models.
- Growing emphasis on fuel efficiency and route optimization will push demand for data-driven fleet management systems.
- Embedded ELD solutions will gain traction in next-generation vehicles, replacing conventional plug-in models.
- Regional regulatory harmonization will create opportunities for international logistics companies to standardize ELD systems.
- Partnerships between OEMs and telematics providers will strengthen hardware–software integration across fleets.
- ELD platforms will evolve toward full telematics ecosystems supporting EV fleets and autonomous logistics operations.
- Sustainability goals will encourage the development of low-power, eco-friendly ELD devices with extended lifecycle performance.
Request a Free Sample
Fill in your details and we'll send you a free sample report.
- Sample data tables & charts
- Research methodology
Market Dynamics
Strict Regulatory Mandates for Fleet Compliance
Government regulations such as the U.S. ELD mandate and similar global policies require commercial fleets to adopt electronic logging devices, making compliance mandatory and driving widespread market adoption.
Emphasis on Road Safety and Driver Accountability
Transport companies are increasingly focused on improving road safety and reducing driver fatigue, using ELDs to monitor driving hours, behaviors, and ensure adherence to safety standards.
Expansion of Logistics and E-Commerce Industries
The rapid growth of logistics and e-commerce sectors increases the need for real-time fleet visibility and automated tracking, fueling demand for ELDs to optimize delivery operations and manage expanding fleets.
Integration of Cloud, IoT, and Analytics Solutions
The adoption of cloud-based platforms and IoT connectivity enhances data accuracy, compliance reporting, and operational transparency, encouraging large-scale ELD deployment across commercial vehicle operators.
Operational Cost Reduction and Efficiency Gains
Fleets seek to lower fuel and labor costs while improving workflow efficiency; ELDs automate recordkeeping, reduce paperwork, and provide actionable insights that help managers optimize routes and minimize idle time.
Need a Custom Version of This Report?
Tailor the scope, geography, or segments to your exact requirements.
- Custom geography or segment scope
- Direct access to our analyst team
Frequently Asked Questions
What is the projected growth of the Electronic Logging Device (ELD) market?
At what Compound Annual Growth Rate is the Electronic Logging Device Market projected to grow between 2024 and 2032?
What are the main drivers of the ELD market?
How do ELDs benefit businesses?
Which regions are driving the ELD market growth?
How is technology influencing the ELD market?
Table of Content
Chapter 1 Market Segmentation
- 1.1 Segmentation Framework
- 1.1.1 Product and Service Classification
- 1.1.2 Application and End-Use Classification
- 1.1.3 Technology and Solution Classification
- 1.1.4 Customer and Distribution Channel Classification
- 1.1.5 Geographic Segmentation
- 1.1.6 Market Segment Definitions and Boundaries
- 1.2 By End-User
- 1.2.1 Transportation & Logistics
- 1.2.2 Oil & Gas
- 1.2.3 Construction
- 1.2.4 Mining
- 1.2.5 Delivery & Courier Services
- 1.3 By Component
- 1.3.1 Hardware
- 1.3.2 Software
- 1.4 By Application
- 1.4.1 Hours-of-Service (HOS) Compliance
- 1.4.2 Fleet Management
- 1.4.3 Driver Monitoring
- 1.4.4 Vehicle Diagnostics
- 1.5 By Vehicle Type
- 1.5.1 Light Commercial Vehicles (LCV)
- 1.5.2 Heavy Commercial Vehicles (HCV)
- 1.5.3 Buses & Coaches
Chapter 2 Introduction
- 2.1 Report Objectives and Scope
- 2.2 Product Definition and Industry Terminology
- 2.3 Market Inclusions and Exclusions
- 2.4 Research Process
- 2.4.1 Primary Research and Expert Interviews
- 2.4.2 Secondary Research and Source Review
- 2.4.3 Top-Down and Bottom-Up Estimation
- 2.4.4 Data Triangulation and Verification
- 2.5 Market Size Measurement Basis
- 2.5.1 2024: USD 14,303.36 million → 2032: USD 20,346.91 million
- 2.6 Historical and Forecast Reference Periods
- 2.6.1 Base Year: 2024
- 2.6.2 Forecast Period: 2024-2032
- 2.7 Research Assumptions and Limitations
Chapter 3 Executive Summary
- 3.1 Market Snapshot and Key Findings
- 3.2 Base-Year Market Size, 2024
- 3.3 Forecast Market Size, 2032
- 3.4 Revenue and Volume Growth Outlook
- 3.5 Key Demand and Supply Indicators
- 3.6 Leading Market Segments
- 3.7 Fastest-Growing Market Opportunities
- 3.8 Regional Performance Highlights
- 3.9 Technology and Industry Transformation
- 3.10 Competitive Landscape Summary
- 3.11 Analyst View and Strategic Implications
Chapter 4 Global Electronic Logging Device Market Trends and Developments
- 4.1 Historical Industry Development
- 4.2 Recent Market Trends and Developments
- 4.3 Demand and Customer Behavior Trends
- 4.4 Technology and Product Innovation
- 4.5 Artificial Intelligence, Automation and Digitalization
- 4.6 Local Manufacturing and Supply Chain Realignment
- 4.7 Industry Partnerships, Mergers and Acquisitions
- 4.8 Sustainability and Circular Economy Developments
- 4.9 Government and Private Sector Investment Trends
- 4.10 Emerging Business Models and Commercialization
- 4.11 Industry Developments and Announcements
Chapter 5 Global Electronic Logging Device Market Production, Supply and Demand Analysis
- 5.1 Demand Trend and Consumption Analysis
- 5.2 Demand Forecast, 2024-2032
- 5.3 Production and Output Trend
- 5.4 Production and Output Forecast, 2024-2032
- 5.5 Installed Capacity and Capacity Utilization
- 5.6 Company-Wise Production Plants and Statistics
- 5.6.1 Installed Production Capacity
- 5.6.2 Actual Production
- 5.6.3 Planned Capacity and Expansion Targets
- 5.7 Supply Chain Structure and Procurement Trends
- 5.8 Supply-Demand Gap and Bottlenecks
- 5.9 Import Dependence and Sourcing Structure
- 5.10 Contract Manufacturing and Outsourcing
- 5.11 Regional Supply and Demand Concentration
Chapter 6 Global Electronic Logging Device Market Pricing Analysis
- 6.1 Pricing Structure and Measurement
- 6.2 Historical Pricing Trends
- 6.3 Pricing Outlook, 2024-2032
- 6.4 Average Selling Price and Unit Economics
- 6.5 Pricing by Product and Market Segment
- 6.6 Geographic Pricing Differences
- 6.7 Key Input, Energy, Labor and Logistics Costs
- 6.8 Contract Pricing and Purchasing Models
- 6.9 Pricing Sensitivity and Competitive Positioning
- 6.10 Price, Margin and Profitability Implications
Chapter 7 Global Electronic Logging Device Market Dynamics
- 7.1 Market Growth Drivers
- 7.1.1 Demand-Side Drivers
- 7.1.2 Technology and Innovation Drivers
- 7.1.3 Infrastructure and Investment Drivers
- 7.1.4 Regulatory and Policy Drivers
- 7.2 Market Restraints
- 7.2.1 Cost and Affordability Constraints
- 7.2.2 Technology and Adoption Barriers
- 7.2.3 Supply Chain and Operational Constraints
- 7.3 Market Challenges
- 7.3.1 Competitive Pressure and Margin Erosion
- 7.3.2 Skills, Infrastructure and Implementation Gaps
- 7.4 Emerging Market Opportunities
- 7.5 Market Dynamics Impact and Time-Horizon Assessment
Chapter 8 Global Electronic Logging Device Value Chain Analysis
- 8.1 Industry Value Chain Overview
- 8.2 Upstream Suppliers and Critical Inputs
- 8.3 Technology and Component Providers
- 8.4 Manufacturing or Service Delivery
- 8.5 Distribution, Channel Partners and Integrators
- 8.6 Downstream Applications and End Users
- 8.7 Value Addition and Profit Pools
- 8.8 Vertical Integration and Outsourcing
- 8.9 Supplier Concentration and Risk
- 8.10 Supply Chain Localization and Resilience
Chapter 9 Global Electronic Logging Device Market Regulations and Policies
- 9.1 Relevant Laws, Standards and Compliance Frameworks
- 9.2 Product, Service, Safety and Quality Requirements
- 9.3 Government Policies, Incentives and Subsidies
- 9.4 Imports, Exports and Trade Barriers
- 9.5 Public Procurement and Local Content Requirements
- 9.6 Environmental and Sustainability Compliance
- 9.7 Upcoming Policy Changes and Market Implications
Chapter 10 Global Electronic Logging Device Market Hotspots and Opportunities
- 10.1 Market Opportunity Mapping and Growth Hotspots
- 10.2 High-Growth Applications and Customer Groups
- 10.3 Underserved Markets and White-Space Opportunities
- 10.4 Emerging Technology and Product Opportunities
- 10.5 New Capacity and Investment Hotspots
- 10.6 Market Entry and Expansion Opportunities
- 10.7 Distribution and Partnership Opportunities
- 10.8 Near-Term and Long-Term Commercial Potential
- 10.9 Opportunity Attractiveness and Execution Risks
Chapter 11 Global Electronic Logging Device Market Outlook, 2024-2032
- 11.1 Market Size and Analysis
- 11.1.1 Revenue (Market Measurement: 2024: USD 14,303.36 million → 2032: USD 20,346.91 million)
- 11.1.2 Market Volume and Quantity Sold
- 11.1.3 Historical Market Size
- 11.1.4 Base-Year Market Size, 2024
- 11.2 Market Forecast, 2024-2032
- 11.2.1 Revenue Forecast to 2032
- 11.2.2 Volume Forecast to 2032
- 11.2.3 CAGR and Year-on-Year Growth
- 11.2.4 Incremental Revenue Opportunity
- 11.3 Forecast Assumptions and Scenario Analysis
- 11.3.1 Base-Case Forecast
- 11.3.2 Optimistic and Conservative Scenarios
- 11.3.3 Technology, Pricing and Policy Sensitivities
- 11.4 Market Attractiveness and Growth Outlook
Chapter 12 Global Electronic Logging Device Market Segmentation and Outlook
- 12.1 Segmentation Summary and Market Shares, 2024
- 12.2 Largest and Fastest-Growing Segments
- 12.3 By End-User - Market Size and Forecast, 2024-2032
- 12.3.1 Segment Definition and Scope
- 12.3.2 Historical Market Size
- 12.3.3 Revenue Forecast, 2024-2032
- 12.3.4 Volume Forecast, 2024-2032
- 12.3.5 Base-Year Market Share, 2024
- 12.3.6 Segment CAGR and Growth Drivers
- 12.3.7 Subsegment Market Size and Forecast
- 12.3.7.1 Transportation & Logistics
- 12.3.7.2 Oil & Gas
- 12.3.7.3 Construction
- 12.3.7.4 Mining
- 12.3.7.5 Delivery & Courier Services
- 12.3.8 Subsegment Pricing and Adoption Trends
- 12.3.9 Leading Suppliers and Competition
- 12.3.10 Regional Demand and Opportunities
- 12.4 By Component - Market Size and Forecast, 2024-2032
- 12.4.1 Segment Definition and Scope
- 12.4.2 Historical Market Size
- 12.4.3 Revenue Forecast, 2024-2032
- 12.4.4 Volume Forecast, 2024-2032
- 12.4.5 Base-Year Market Share, 2024
- 12.4.6 Segment CAGR and Growth Drivers
- 12.4.7 Subsegment Market Size and Forecast
- 12.4.7.1 Hardware
- 12.4.7.2 Software
- 12.4.8 Subsegment Pricing and Adoption Trends
- 12.4.9 Leading Suppliers and Competition
- 12.4.10 Regional Demand and Opportunities
- 12.5 By Application - Market Size and Forecast, 2024-2032
- 12.5.1 Segment Definition and Scope
- 12.5.2 Historical Market Size
- 12.5.3 Revenue Forecast, 2024-2032
- 12.5.4 Volume Forecast, 2024-2032
- 12.5.5 Base-Year Market Share, 2024
- 12.5.6 Segment CAGR and Growth Drivers
- 12.5.7 Subsegment Market Size and Forecast
- 12.5.7.1 Hours-of-Service (HOS) Compliance
- 12.5.7.2 Fleet Management
- 12.5.7.3 Driver Monitoring
- 12.5.7.4 Vehicle Diagnostics
- 12.5.8 Subsegment Pricing and Adoption Trends
- 12.5.9 Leading Suppliers and Competition
- 12.5.10 Regional Demand and Opportunities
- 12.6 By Vehicle Type - Market Size and Forecast, 2024-2032
- 12.6.1 Segment Definition and Scope
- 12.6.2 Historical Market Size
- 12.6.3 Revenue Forecast, 2024-2032
- 12.6.4 Volume Forecast, 2024-2032
- 12.6.5 Base-Year Market Share, 2024
- 12.6.6 Segment CAGR and Growth Drivers
- 12.6.7 Subsegment Market Size and Forecast
- 12.6.7.1 Light Commercial Vehicles (LCV)
- 12.6.7.2 Heavy Commercial Vehicles (HCV)
- 12.6.7.3 Buses & Coaches
- 12.6.8 Subsegment Pricing and Adoption Trends
- 12.6.9 Leading Suppliers and Competition
- 12.6.10 Regional Demand and Opportunities
- 12.7 Segment Growth Comparison
- 12.8 Segment Attractiveness and Priority Matrix
Chapter 13 Global Electronic Logging Device End-Use and Application Market Outlook
- 13.1 End-Use Industry and Customer Demand Structure
- 13.2 Leading Applications and Customer Groups
- 13.3 End-Use Market Size, Share and Forecast
- 13.4 Major End-Use Industry Deep Dives
- 13.4.1 Customer Requirements and Use Cases
- 13.4.2 Demand and Replacement Cycles
- 13.4.3 Technical and Regulatory Considerations
- 13.4.4 Purchasing and Procurement Models
- 13.4.5 Leading Vendors and Distribution Channels
- 13.4.6 Forecast and Commercial Opportunities
- 13.5 Emerging Applications and Cross-Segment Demand
- 13.6 End-Use Industry Investment Priorities
Chapter 14 Global Electronic Logging Device Geographic Market Outlook, 2024-2032
- 14.1 Regional Market Size and Share, 2024
- 14.2 Regional Market Forecast, 2024-2032
- 14.3 Regional Pricing, Production and Demand Differences
- 14.4 North America
- 14.4.1 United States
- 14.4.2 Canada
- 14.4.3 Mexico
- 14.5 Europe
- 14.5.1 Germany
- 14.5.2 France
- 14.5.3 Italy
- 14.5.4 United Kingdom
- 14.5.5 Spain
- 14.5.6 Poland
- 14.5.7 Russia
- 14.5.8 Netherlands
- 14.5.9 Belgium
- 14.5.10 Sweden
- 14.5.11 Denmark
- 14.5.12 Norway
- 14.5.13 Rest of Europe
- 14.6 Asia Pacific
- 14.6.1 China
- 14.6.2 India
- 14.6.3 Japan
- 14.6.4 South Korea
- 14.6.5 Thailand
- 14.6.6 Indonesia
- 14.6.7 Vietnam
- 14.6.8 Malaysia
- 14.6.9 Australia
- 14.6.10 Rest of Asia Pacific
- 14.7 Latin America
- 14.7.1 Brazil
- 14.7.2 Argentina
- 14.7.3 Colombia
- 14.7.4 Chile
- 14.7.5 Rest of Latin America
- 14.8 Middle East
- 14.8.1 Saudi Arabia
- 14.8.2 United Arab Emirates
- 14.8.3 Turkey
- 14.8.4 Israel
- 14.8.5 Iran
- 14.8.6 Rest of the Middle East
- 14.9 Africa
- 14.9.1 South Africa
- 14.9.2 Egypt
- 14.9.3 Nigeria
- 14.9.4 Morocco
- 14.9.5 Rest of Africa
- 14.10 Regional Investment, Policy and Supply Chain Differences
- 14.11 Regional Competitive Landscape
- 14.12 Geographic Growth Hotspots
Chapter 15 Global Electronic Logging Device Technology, Innovation and Sustainability Outlook
- 15.1 Technology Landscape and Maturity
- 15.2 Product, Process and Service Innovation
- 15.3 AI, Automation and Digital Tools in the Industry
- 15.4 Technology Adoption and Performance Benchmarking
- 15.5 Innovation Pipeline and R&D Investment
- 15.6 Patent and Intellectual Property Trends
- 15.7 Energy Efficiency and Resource Management
- 15.8 Sustainability, Recycling and Circularity
- 15.9 Technology Roadmap, 2024-2032
- 15.10 Risks of Obsolescence and Technology Substitution
Chapter 16 Global Electronic Logging Device Market Key Strategic Imperatives
- 16.1 Growth and Market Entry Priorities
- 16.2 High-Return Products and Segments
- 16.3 Pricing, Profitability and Cost Optimization
- 16.4 Technology Investment and Product Differentiation
- 16.5 Supply Chain Localization and Resilience
- 16.6 Distribution and Customer Acquisition
- 16.7 Partnership, Acquisition and Capacity Strategy
- 16.8 Regional Expansion Priorities
- 16.9 Short-, Medium- and Long-Term Actions
Chapter 17 Competition Outlook
- 17.1 Industry Competition Characteristics
- 17.2 Market Structure and Concentration
- 17.3 Market Share and Competitive Positioning, 2024
- 17.4 Company-Wise Revenue and Product Benchmarking
- 17.5 Production and Service Capacity Benchmarking
- 17.6 Technology, Pricing and Differentiation
- 17.7 Regional Footprint and Distribution Strength
- 17.8 Mergers, Acquisitions and Strategic Alliances
- 17.9 New Entrants and Competitive Threats
- 17.10 Porter's Five Forces and Industry Attractiveness
- 17.11 Competitive Outlook, 2024-2032
Chapter 18 Company Profiles
- 18.1 Company Coverage and Selection Criteria
- 18.2 Omnitracs
- 18.2.1 Business Description
- 18.2.2 Company Ownership and Geographic Presence
- 18.2.3 Product and Service Portfolio
- 18.2.4 Manufacturing and Operating Footprint
- 18.2.5 Production Capacity and Expansion Plans
- 18.2.6 Financial Performance and Investment
- 18.2.7 Market Share and Competitive Position
- 18.2.8 Technology and Innovation Capabilities
- 18.2.9 Strategic Alliances or Partnerships
- 18.2.10 Recent Developments
- 18.2.11 Growth Strategy and Outlook
- 18.3 Trimble Inc.
- 18.4 Geotab Inc.
- 18.5 Teletrac Navman
- 18.6 Motive (formerly KeepTruckin)
- 18.7 Verizon Connect
- 18.8 Samsara Inc.
- 18.9 EROAD
- 18.10 Rand McNally
- 18.11 Pedigree Technologies
- 18.12 Other Relevant Market Participants
Note: Every listed company is profiled on the structure shown under the first company. The company list is preliminary and may change based on research findings, market developments, data availability and client requirements.
Chapter 19 Disclaimer
- 19.1 Research and Forecast Disclaimer
- 19.2 Data Source and Estimation Limitations
Note: The depth of individual sections depends on data availability for this market. Volume, capacity, trade and other unit-based metrics are included where applicable.

