
Market Overview
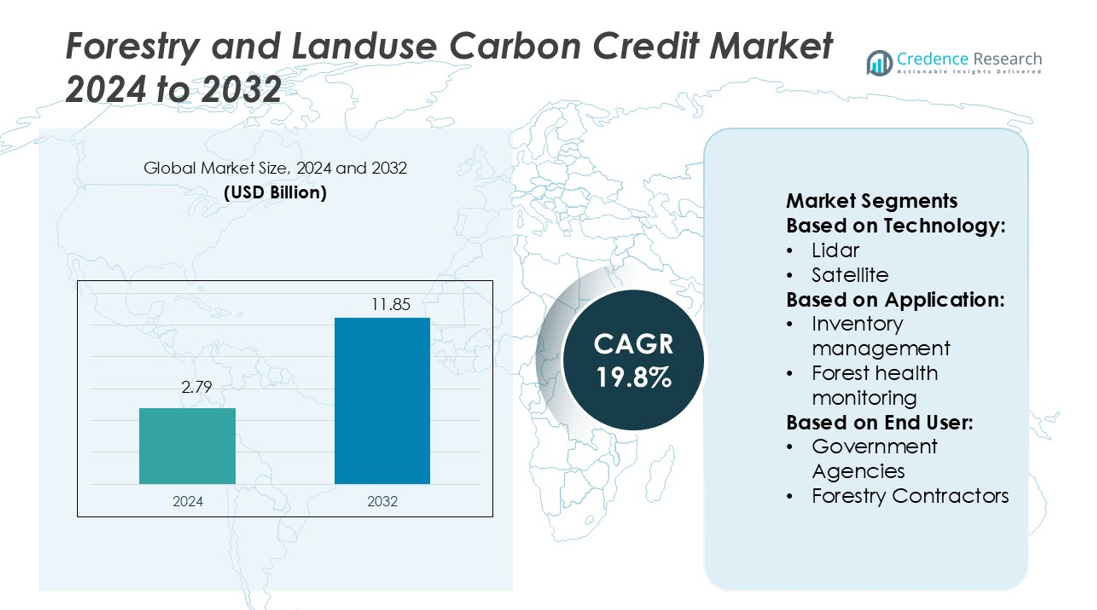
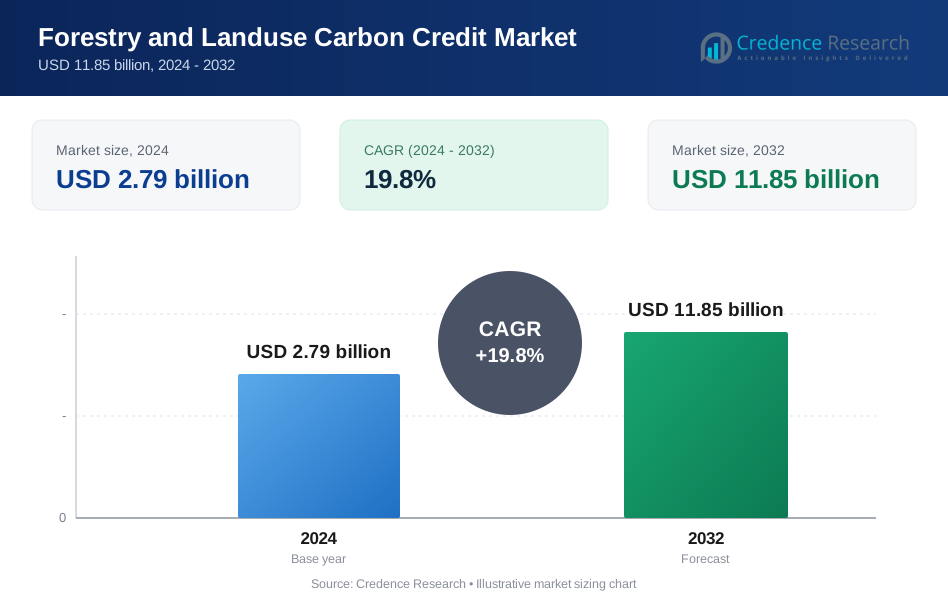
Forestry and Landuse Carbon Credit Market size was valued USD 2.79 billion in 2024 and is anticipated to reach USD 11.85 billion by 2032, at a CAGR of 19.8% during the forecast period.
| REPORT ATTRIBUTE | DETAILS |
|---|---|
| Historical Period | 2020-2023 |
| Base Year | 2024 |
| Forecast Period | 2025-2032 |
| Forestry and Landuse Carbon Credit Market Size 2024 | USD 2.79 billion |
| Forestry and Landuse Carbon Credit Market, CAGR | 7.3% |
| Forestry and Landuse Carbon Credit Market Size 2032 | USD 11.85 billion |
The Forestry and Landuse Carbon Credit Market is supported by prominent companies such as EcoAct, Green Mountain Energy Company, PwC, CarbonClear, ClimeCo LLC., ALLCOT, Atmosfair, Climate Impact Partners, 3Degrees, and Ecosecurities. These players focus on developing high-integrity carbon projects, integrating digital MRV systems, and expanding global offset portfolios. Their strategies emphasize technological innovation, transparent credit verification, and strong partnerships with governments and private organizations. North America leads the market with a 36% share, driven by advanced regulatory frameworks, strong investor participation, and large-scale reforestation programs. This leadership position enables consistent credit supply, enhanced project scalability, and greater global market influence.
Market Insights
- The Forestry and Landuse Carbon Credit Market was valued at USD 2.79 billion in 2024 and is projected to reach USD 11.85 billion by 2032, growing at a CAGR of 19.8%.
- The market is driven by rising net-zero commitments, increasing investment in nature-based solutions, and strong government support for large-scale reforestation and conservation projects.
- Digital MRV platforms and satellite monitoring are key trends enhancing credit transparency, reducing verification time, and increasing project scalability across regions.
- The competitive landscape features leading companies focusing on technological innovation, transparent credit verification, and global offset portfolio expansion.
- North America leads with a 36% market share, followed by Europe at 28% and Asia Pacific at 22%, while remote sensing technology holds the dominant segment share, supported by its accuracy in forest monitoring and carbon measurement.
Market Segmentation Analysis:
By Technology
Remote sensing leads the Forestry and Landuse Carbon Credit Market with the largest share. Its dominance is driven by high adoption in carbon measurement and forest cover tracking. This technology provides accurate data on biomass and land-use changes. Lidar and satellite systems also support precise terrain mapping and canopy analysis. Drones combined with GIS and GPS enhance real-time monitoring of forest health and deforestation activities. Advanced mapping software further enables efficient reporting and verification for carbon credit projects, improving compliance with global carbon offset standards.
- For instance, Green Mountain Energy reports that through its Sun Club programme, its projects have helped generate 25,000,000 kWh of solar electricity and avoid over 40,000,000 pounds of CO₂.
By Application
Forest management holds the highest share in the application segment. This dominance comes from increased demand for sustainable land-use practices and accurate carbon stock estimation. Forest management involves planning, conservation, and monitoring activities essential for generating verified carbon credits. Fire detection and health monitoring solutions are also growing rapidly due to climate-related threats. Inventory management tools enhance the accuracy of forest asset tracking, supporting regulatory compliance. These applications collectively support governments and private entities in meeting emission reduction targets and strengthening carbon market credibility.
- For instance, PwC Network Environment Report confirms that the firm achieved a 71% reduction in its scope 1 and 2 emissions in FY24, based on its FY19 baseline. The firm is actively working toward its science-based target of a 50% absolute reduction in these emissions by FY30.
By End User
Government agencies represent the dominant end-user segment in the market. Their leadership is driven by large-scale reforestation programs, conservation projects, and regulatory mandates for carbon credit validation. Forestry contractors follow with increasing investments in sustainable timber operations and site planning tools. Academic and research institutes contribute through technological innovation and advanced modeling techniques. The growing involvement of public agencies ensures reliable verification and certification processes, enhancing trust in carbon credit trading. This structure supports transparent reporting and drives global investment in forestry-based carbon offsets.
Key Growth Drivers
Rising Global Carbon Neutrality Commitments
Countries and corporations are adopting strict carbon reduction goals to meet climate targets. Forestry and land-use projects offer efficient carbon sequestration solutions. Governments are implementing regulatory frameworks to boost afforestation and reforestation initiatives. This growing demand for verified carbon credits strengthens the market structure. Large emitters are investing in nature-based solutions to balance emissions. These efforts align with net-zero strategies, positioning forestry as a crucial pillar in global decarbonization programs and driving consistent credit generation and trading activity.
- For instance, CarbonClear partnered with ENGIE Energy Access to certify approximately 500 000 metric tons CO₂e from off-grid solar deployments in sub-Saharan Africa by 2025.
Advancements in Forest Monitoring Technologies
The adoption of technologies such as remote sensing, LiDAR, and drones is transforming forest monitoring. These tools enable precise carbon stock estimation, deforestation tracking, and land-use change detection. Real-time data improves verification accuracy, reducing credit issuance time. Technology integration supports large-scale carbon projects with better transparency and lower costs. Governments and private developers benefit from reliable reporting standards. These innovations enhance project scalability and credibility, driving increased investor confidence and accelerating the growth of forestry-based carbon credit markets.
- For instance, ClimeCo’s nature-based solutions described the Andean Cloud Forests of Colombia project which will plant over 400 native tree species and aims to sequester more than 250,000 tonnes CO₂e over its duration.
Increasing Private and Institutional Investments
Investment in forestry-based carbon credit projects is growing rapidly. Institutional investors are channeling funds into reforestation and conservation programs due to stable returns and strong ESG alignment. Carbon credits are becoming attractive financial assets for portfolio diversification. Private players are forming partnerships with governments to develop long-term forest management initiatives. Carbon finance instruments are also expanding, improving liquidity and price stability. This rising capital inflow supports project expansion, technology integration, and regulatory compliance, strengthening overall market momentum.
Key Trends & Opportunities
Integration of Digital MRV Platforms
Measurement, Reporting, and Verification (MRV) systems are shifting to digital platforms for higher transparency. Blockchain, satellite imaging, and AI-based models enhance traceability and credibility of credit issuance. Automated MRV tools reduce verification time and operational costs. These solutions support standardization and simplify carbon accounting processes. Project developers can scale operations with reduced manual intervention. The trend creates strong opportunities for technology providers and investors to collaborate on reliable and efficient carbon credit ecosystems.
- For instance, 3Degrees launched its climate-tech advisory services at COP27 to help clients adopt and onboard climate management software solutions.
Expansion of Nature-Based Solutions
Nature-based solutions, including reforestation and soil carbon sequestration, are gaining policy support. These projects offer cost-effective mitigation while promoting biodiversity. Governments and corporations are prioritizing sustainable land use to meet compliance targets. Regional markets are seeing increased project registration under voluntary and compliance mechanisms. Companies investing in nature-based credits enhance their ESG performance and reputation. This shift creates new opportunities for large-scale afforestation, conservation finance, and ecosystem restoration programs.
- For instance, EcoSecurities reports having generated more than 400 million carbon credits across its project portfolio. Their project pipeline features over 700 emission-reduction projects developed in more than 45 countries.
Regional Market Diversification
Carbon credit projects are expanding beyond traditional regions like North America and Europe. Asia Pacific, Latin America, and Africa are emerging as high-potential markets due to abundant forest resources. Governments in these regions are easing approval processes and encouraging foreign investment. Local communities are increasingly participating in carbon offset programs, boosting social impact. This diversification enhances global supply and helps balance credit demand, creating strategic opportunities for project developers and investors.
Key Challenges
Inconsistent Regulatory Frameworks
Varying carbon credit regulations across regions create uncertainty for investors and developers. Lack of uniformity in verification standards affects credit credibility. Complex approval processes delay project timelines and increase costs. Countries with weak enforcement mechanisms face low investor confidence. These challenges restrict cross-border trading and market integration. Addressing regulatory gaps is essential to ensure stability, boost investment, and support large-scale carbon credit deployment in forestry and land-use projects.
Risks of Overestimation and Greenwashing
Inaccurate carbon accounting can lead to overestimation of credits and reputational risks. Weak monitoring and verification mechanisms increase the chance of fraudulent claims. Greenwashing concerns reduce trust in voluntary carbon markets. Buyers and regulators demand more transparency and science-based measurement methods. Addressing these issues requires stronger MRV frameworks and independent third-party verification. Building trust in credit quality is essential to sustain market growth and attract institutional investment.
Regional Analysis
North America
North America holds a 36% market share in the Forestry and Landuse Carbon Credit Market. The region benefits from strong regulatory frameworks, advanced forest monitoring technologies, and a mature carbon trading ecosystem. The U.S. and Canada lead in large-scale afforestation and reforestation projects backed by government incentives and corporate net-zero goals. High adoption of digital MRV systems improves credit verification accuracy and transparency. Institutional investors play a major role in financing forest carbon projects, driving project scalability. Robust voluntary and compliance markets further strengthen regional credit supply and trading activity.
Europe
Europe accounts for 28% of the global market share, driven by strict climate policies and sustainability goals under the EU Green Deal. The region has well-established compliance mechanisms and strong demand for verified forestry-based credits. Countries such as Germany, France, and the Nordic nations are leading reforestation and forest conservation efforts. Digital monitoring and policy incentives enhance project accountability and investor confidence. Corporates actively participate in voluntary offset programs to meet ESG targets. Europe’s mature policy landscape and advanced carbon pricing models make it one of the most structured regional markets globally.
Asia Pacific
Asia Pacific holds a 22% market share, supported by abundant forest resources and growing government involvement. Countries such as Indonesia, Malaysia, and India are expanding reforestation and conservation initiatives. The region benefits from rising foreign investment in voluntary carbon projects. Local communities are increasingly engaged in forest protection, enhancing project credibility. Adoption of satellite and drone technologies is improving measurement accuracy and verification. With supportive regulatory reforms and a strong carbon sink potential, Asia Pacific is emerging as a key contributor to global forestry-based carbon credit supply.
Latin America
Latin America represents 8% of the market share, driven by its vast tropical forests and biodiversity. Brazil, Peru, and Colombia lead project development, supported by international funding. Forest preservation and sustainable land management programs are gaining traction, particularly under REDD+ initiatives. The region focuses on preventing deforestation while generating high-quality carbon credits. Community-based forest management and indigenous partnerships are increasing credit credibility. Although the regulatory landscape remains less structured than in Europe, the region’s natural assets position it as a strong growth area for carbon credit generation and trading.
Middle East & Africa
The Middle East & Africa region holds a 6% market share and is gradually building capacity in forestry-based carbon credit programs. African nations, particularly Kenya and Gabon, are expanding afforestation projects supported by global climate finance. The region’s focus on sustainable land use aligns with national climate adaptation plans. In the Middle East, emerging initiatives are targeting mangrove restoration and desert greening. While market maturity is lower compared to other regions, increasing foreign partnerships, rising policy support, and abundant land availability provide strong potential for future market expansion.
Market Segmentations:
By Technology:
- Lidar
- Satellite
By Application:
- Inventory management
- Forest health monitoring
By End User:
- Government Agencies
- Forestry Contractors
By Geography
- North America
- U.S.
- Canada
- Mexico
- Europe
- Germany
- France
- U.K.
- Italy
- Spain
- Rest of Europe
- Asia Pacific
- China
- Japan
- India
- South Korea
- South-east Asia
- Rest of Asia Pacific
- Latin America
- Brazil
- Argentina
- Rest of Latin America
- Middle East & Africa
- GCC Countries
- South Africa
- Rest of the Middle East and Africa
Competitive Landscape
The Forestry and Landuse Carbon Credit Market is shaped by key players including EcoAct, Green Mountain Energy Company, PwC, CarbonClear, ClimeCo LLC., ALLCOT, Atmosfair, Climate Impact Partners, 3Degrees, and Ecosecurities. The Forestry and Landuse Carbon Credit Market is becoming increasingly competitive as companies focus on technological innovation, project diversification, and strategic partnerships. Market participants are investing in advanced monitoring tools such as satellite imaging, LiDAR, and blockchain-based MRV platforms to enhance credit transparency and trust. Strong collaboration with governments and private organizations helps expand project pipelines and strengthen global carbon offset programs. Companies are also prioritizing community-driven reforestation initiatives and biodiversity protection to meet international sustainability standards. This competitive dynamic fosters continuous innovation, drives credit quality improvements, and supports the rapid scaling of forestry-based carbon projects worldwide.
Key Player Analysis
- EcoAct
- Green Mountain Energy Company
- PwC
- CarbonClear
- ClimeCo LLC.
- ALLCOT
- Atmosfair
- Climate Impact Partners
- 3Degrees
- Ecosecurities
Recent Developments
- In January 2025, Indonesian Forestry Minister announced developed an innovative mechanism to aid the trading of carbon from the forestry and other land use (FOLU) sector.
- In July 2024, Andhra Pradesh Forest Department (APFD) announced an initiative of an innovative carbon market to restore mangrove forests in the state. The project aims to achieve 1,650,000 emission reductions over next 20 years.
- In April 2024, The Soil and Water Outcomes Fund (SWOF) and John Deere launched a new partnership aimed at integrating digital field data to enhance efficiency and support foresters and farmers in conservation efforts. Through this collaboration, farmers participating in SWOF's ecosystem services program can seamlessly manage and share operational data via the John Deere Operations Center
- In July 2023, Trimble introduced LIMS PRO, a new cloud-based iteration of its Log Inventory and Management System (LIMS), tailored for small- and medium-sized forestry companies. This Software-as-a-Service (SaaS) solution enhances operational visibility and efficiency in managing sawmill raw material procurement
Report Coverage
The research report offers an in-depth analysis based on Technology, Application, End-User and Geography. It details leading market players, providing an overview of their business, product offerings, investments, revenue streams, and key applications. Additionally, the report includes insights into the competitive environment, SWOT analysis, current market trends, as well as the primary drivers and constraints. Furthermore, it discusses various factors that have driven market expansion in recent years. The report also explores market dynamics, regulatory scenarios, and technological advancements that are shaping the industry. It assesses the impact of external factors and global economic changes on market growth. Lastly, it provides strategic recommendations for new entrants and established companies to navigate the complexities of the market.
Future Outlook
- The market will see strong growth driven by rising global net-zero commitments.
- Digital MRV platforms will enhance transparency and speed up credit verification.
- Nature-based solutions will play a central role in meeting climate targets.
- Governments will expand incentives to boost reforestation and conservation projects.
- Private and institutional investments in carbon projects will increase steadily.
- Emerging economies will become major hubs for forestry-based credit generation.
- Technological innovation will reduce project costs and improve accuracy.
- Standardized regulations will strengthen investor confidence and market stability.
- Corporate demand for verified carbon credits will drive new project development.
- Global collaboration will enhance scalability and long-term market growth
Request a Free Sample
Fill in your details and we'll send you a free sample report.
- Sample data tables & charts
- Research methodology
Need a Custom Version of This Report?
Tailor the scope, geography, or segments to your exact requirements.
- Custom geography or segment scope
- Direct access to our analyst team
Frequently Asked Questions
What is the current market size for the Forestry and Landuse Carbon Credit Market, and what is its projected size in 2032?
At what Compound Annual Growth Rate is the Forestry and Landuse Carbon Credit Market projected to grow between 2025 and 2032?
Which Forestry and Landuse Carbon Credit Market segment held the largest share in 2024?
What are the primary factors fueling the growth of the Forestry and Landuse Carbon Credit Market?
Who are the leading companies in the Forestry and Landuse Carbon Credit Market?
Table of Content
Chapter 1. Report Introduction
- 1.1 Report Description & Purpose
- 1.1.1 Report Title & Market Definition
- 1.1.2 Unique Selling Propositions (USP) & Key Differentiators
- 1.1.3 Value Proposition for Stakeholders
- 1.2 Research Objectives
- 1.2.1 Market Sizing Objectives (Volume & Revenue)
- 1.2.2 Segmentation Objectives
- 1.2.3 Competitive Intelligence Objectives
- 1.2.4 Forecast & Scenario Objectives
- 1.3 Report Scope
- 1.3.1 Forestry and Landuse Carbon Credit Scope – Types & Subtypes Covered
- 1.3.2 Geographic Scope – Regions & Countries Covered
- 1.3.3 Historical Period, Base Year & Forecast Period (2024; forecast to 2032)
- 1.3.4 Inclusions & Exclusions
- 1.4 HS Code & Classification Framework
- 1.5 Currency, Units & Pricing Basis
- 1.6 Target Stakeholders
- 1.7 Limitations & Assumptions
Chapter 2. Executive Summary
- 2.1 Global Forestry and Landuse Carbon Credit Market Snapshot
- 2.1.1 Market Size – Historical (2024) & Forecast (2024-2032) (2024: USD 2.79 billion → 2032: USD 11.85 billion)
- 2.1.2 Volume & Revenue – Global Totals
- 2.1.3 Key Market Highlights – Top Five Facts
- 2.2 Forestry and Landuse Carbon Credit Market Segmentation Snapshot
- 2.2.1 Market Split by Region – 2024 vs. 2032
- 2.3 Competitive Snapshot
- 2.3.1 Top 10 Players by Revenue Share – 2024
- 2.3.2 Top 10 Players by Volume Share – 2024
- 2.3.3 Recent Strategic Developments (18-Month Summary)
- 2.4 Key Investment Highlights & Strategic Conclusions
Chapter 3. Forestry and Landuse Carbon Credit Market Dynamics & Industry Analysis
- 3.1 Market Overview & Context
- 3.1.1 Forestry and Landuse Carbon Credit Market Position in the Broader Automotive Value Chain
- 3.1.2 OEM vs. Replacement Market Dynamics
- 3.1.3 Market Maturity & Development Stage by Region
- 3.2 Forestry and Landuse Carbon Credit Market Drivers
- 3.3 Forestry and Landuse Carbon Credit Market Restraints & Challenges
- 3.4 Forestry and Landuse Carbon Credit Market Opportunities
- 3.5 Porter's Five Forces Analysis
- 3.5.1 Threat of New Entrants
- 3.5.2 Bargaining Power of Suppliers
- 3.5.3 Bargaining Power of Buyers
- 3.5.4 Threat of Substitutes
- 3.5.5 Competitive Rivalry – Intensity Assessment
- 3.6 Forestry and Landuse Carbon Credit Value Chain Analysis
- 3.6.1 Upstream – Raw Material/Input Suppliers
- 3.6.1.1 Raw Material/Input 1
- 3.6.1.2 Raw Material/Input 2
- 3.6.1.3 Raw Material/Input 3
- 3.6.2 Midstream – Production/Manufacturing/Service Delivery
- 3.6.2.1 Production/Process Overview
- 3.6.2.2 Key Facility Locations & Capacity by Manufacturer
- 3.6.3 Downstream – Distribution & End Consumer
- 3.6.3.1 Primary Channel – B2B/OEM
- 3.6.3.2 Secondary Channels – Dealer, Retail, Online, Direct
- 3.6.4 Value Chain Profitability Analysis
- 3.6.1 Upstream – Raw Material/Input Suppliers
- 3.7 PESTEL Analysis
- 3.7.1 Political Factors
- 3.7.2 Economic Factors
- 3.7.3 Social Factors
- 3.7.4 Technological Factors
- 3.7.5 Environmental Factors
- 3.7.6 Legal Factors
- 3.8 Forestry and Landuse Carbon Credit Supply Chain Analysis
- 3.8.1 Raw Material/Input Supply Risk Assessment
- 3.8.2 Manufacturing Concentration Risk (Geographic Exposure)
- 3.8.3 Trade Disruption Impact Analysis
- 3.9 Regulatory & Policy Landscape
Note: The regulatory and policy landscape section covers regulations based on their applicability to the market, Forestry and Landuse Carbon Credit category, geography, and scope of the study. Only regulatory frameworks with a material impact on operations, compliance, trade, sustainability, or market access are analyzed in detail.
Chapter 4. Key Investment Pockets & Opportunity Analysis
- 4.1 Forestry and Landuse Carbon Credit Market Attractiveness Analysis
- 4.1.1 By Region – Investment Attractiveness Matrix (Volume × CAGR)
- 4.2 Absolute Revenue Growth Opportunity
- 4.2.1 By Region – Absolute USD Growth Through 2032
- 4.3 Incremental Volume Opportunity
- 4.3.1 By Region – Incremental Volume Through 2032
- 4.3.2 Segment – Incremental Volume
- 4.4 Emerging Submarket Opportunity Deep Dive (Subject to Applicability)
- 4.5 Emerging Market Opportunity Scorecards
- 4.5.1 United States
- 4.5.2 Europe
- 4.5.3 Asia
- 4.5.4 Middle East & Africa
Note: Emerging Market Opportunity Scorecards will be included based on relevance and strategic importance. Regions listed are indicative and may vary depending on data availability and market dynamics.
Chapter 5. Forestry and Landuse Carbon Credit Import-Export Analysis & Trade Flows
- 5.1 Global Trade Overview
- 5.1.1 Global Export Value by Country (2024)
- 5.1.2 Global Export Volume by Country (2024)
- 5.1.3 Global Import Value by Country (2024)
- 5.1.4 Global Import Volume by Country (2024)
- 5.1.5 Net Trade Balance by Country (2024)
- 5.2 Export Analysis – Segment
- 5.2.1 Type 1 (HS Code)
- 5.2.2 Type 2 (HS Code)
- 5.2.3 Type 3 (HS Code)
- 5.2.4 Type 4 (HS Code)
- 5.2.5 Type 5 (HS Code)
- 5.3 Import Analysis – Segment
- 5.3.1 Type 1 (HS Code)
- 5.3.2 Type 2 (HS Code)
- 5.3.3 Type 3 (HS Code)
- 5.3.4 Type 4 (HS Code)
- 5.3.5 Type 5 (HS Code)
- 5.4 Average Unit Trade Prices
- 5.4.1 Average Export Price – Segment & Country
- 5.4.2 Average Import Price – Segment & Source Country
- 5.4.3 Price Trends (2024)
- 5.5 Key Trade Route Analysis
- 5.5.1 Trade Route 1
- 5.5.2 Trade Route 2
- 5.5.3 Trade Route 3
- 5.5.4 Trade Route 4
- 5.5.5 Trade Route 5
- 5.6 Trade Policy Impact Assessment
- 5.6.1 US Anti-Dumping & Section 301 Tariffs
- 5.6.2 EU Customs Union Impact
- 5.6.3 Major Free Trade Agreements
- 5.6.4 USMCA Rules of Origin
Note: Trade policy analysis will be included only where relevant to the Forestry and Landuse Carbon Credit market.
Chapter 6. Competitive Landscape & Company Benchmarking
- 6.1 Forestry and Landuse Carbon Credit Market Concentration & Structure
- 6.1.1 Herfindahl-Hirschman Index (HHI) – vs. 2024
- 6.1.2 Tier 1, Tier 2 & Tier 3 Market Structure
- 6.1.3 Global, Regional & Local Player Dynamics
- 6.2 Forestry and Landuse Carbon Credit Market Share Analysis – 2024
- 6.2.1 Global Revenue Share by Company
- 6.2.2 Global Volume Share by Company
- 6.2.3 Regional Revenue Share
- 6.2.4 Market Share Evolution ( vs. 2024)
- 6.2.5 OEM Segment Share by Company
- 6.2.6 Replacement Segment Share by Company
- 6.3 Production/Delivery Capacity & Facility Analysis
- 6.3.1 Global Installed Capacity
- 6.3.2 Capacity Utilization Rates
- 6.3.3 Production/Output Volume
- 6.3.4 Facility Locations & Capacity Map
- 6.3.5 Planned Capacity Additions
- 6.4 Forestry and Landuse Carbon Credit Competitive Benchmarking Matrix
- 6.4.1 Revenue, Volume, CAGR & Profitability Comparison
- 6.4.2 Channel Revenue Mix
- 6.4.3 Geographic Revenue Exposure
- 6.4.4 R&D Intensity
- 6.4.5 Sustainability Maturity
- 6.5 Strategic Developments in Forestry and Landuse Carbon Credit (Last 24 Months)
- 6.5.1 Mergers, Acquisitions & Divestments
- 6.5.2 New Forestry and Landuse Carbon Credit Launches
- 6.5.3 Facility Expansions
- 6.5.4 Strategic Alliances, Joint Ventures & Partnerships
- 6.5.5 Distribution Expansion & Market Entry
- 6.5.6 Sustainability & ESG Initiatives
- 6.6 Competitive Strategy Mapping
- 6.6.1 Leader, Challenger, Follower & Niche Classification
- 6.6.2 Pricing Strategy Comparison
- 6.6.3 Channel Strategy Matrix
Note: Strategic developments are included based on their materiality and the availability of reliable information.
Chapter 7. Global Forestry and Landuse Carbon Credit Market – By Distribution Channel
- 7.1 Segment Overview
- 7.1.1 Volume & Revenue Split by Channel (2024 & 2032)
- 7.1.2 Channel Mix Evolution (2024-2032)
Chapter 8. Regional Market Analysis – Global Overview
- 8.1 Global Regional Overview
- 8.1.1 Regional Volume Share
- 8.1.2 Regional Revenue Share
- 8.1.3 Regional Volume by Region
- 8.1.4 Regional Revenue by Region
- 8.1.5 Regional Forecast Through 2032
- 8.2 Cross-Regional Segment Analysis
- 8.2.1 By Distribution Channel
- 8.2.2 By Brand/Price Tier
Chapter 9. North America Forestry and Landuse Carbon Credit Market
- 9.1 United States
- 9.2 Canada
- 9.3 Mexico
Chapter 10. Europe Forestry and Landuse Carbon Credit Market
- 10.1 Germany
- 10.2 France
- 10.3 Italy
- 10.4 United Kingdom
- 10.5 Spain
- 10.6 Poland
- 10.7 Russia
- 10.8 Netherlands
- 10.9 Belgium
- 10.10 Sweden
- 10.11 Denmark
- 10.12 Norway
- 10.13 Rest of Europe
Chapter 11. Asia Pacific Forestry and Landuse Carbon Credit Market
- 11.1 China
- 11.2 India
- 11.3 Japan
- 11.4 South Korea
- 11.5 Thailand
- 11.6 Indonesia
- 11.7 Vietnam
- 11.8 Malaysia
- 11.9 Australia
- 11.10 Rest of Asia Pacific
Chapter 12. Latin America Forestry and Landuse Carbon Credit Market
- 12.1 Brazil
- 12.2 Argentina
- 12.3 Colombia
- 12.4 Chile
- 12.5 Rest of Latin America
Chapter 13. Middle East Forestry and Landuse Carbon Credit Market
- 13.1 Saudi Arabia
- 13.2 United Arab Emirates
- 13.3 Turkey
- 13.4 Israel
- 13.5 Iran
- 13.6 Rest of the Middle East
Chapter 14. Africa Forestry and Landuse Carbon Credit Market
- 14.1 South Africa
- 14.2 Egypt
- 14.3 Nigeria
- 14.4 Morocco
- 14.5 Rest of Africa
Chapter 15. Forestry and Landuse Carbon Credit Company Profiles
- 15.1 [Company 01]
- 15.1.1 Company Overview
- 15.1.2 Key Management Personnel
- 15.1.3 Products & Services Portfolio
- 15.1.4 Financial Performance
- 15.1.5 Key Market Focus & Geographic Presence
- 15.1.6 Recent Developments & Strategic Initiatives
Note: The company profile list is preliminary and may change based on research findings, market developments, data availability, and client requirements.
Chapter 16. Appendices
- Appendix A – List of Abbreviations & Acronyms
- Appendix B – Industry Classification Code Reference – Full Series
- Appendix C – Production & Capacity Data Tables
- Appendix D – End-Use & Demand Base Tables
- Appendix E – Consumption & Replacement Rate Assumptions
- Appendix F – ASP Reference Tables
- Appendix G – Manufacturing & Facility Database
- Appendix H – Import-Export Data Tables
- Appendix I – Regulatory Summary Tables
- Appendix J – Primary Research Participant List (Anonymized)
- Appendix K – Primary Research Questionnaire Framework
- Appendix L – Data Sources & Bibliography
- Appendix M – Market Size Divergence & Source Comparison
Chapter 17. Research Methodology
- 17.1 Research Framework & Philosophy
- 17.2 Secondary Research – Sources, Hierarchy & Data Extraction
- 17.3 Data Modeling – Bottom-Up & Top-Down Market Sizing
- 17.4 Primary Research – Stakeholder Framework, LOI & Sample Sizes
- 17.5 Forecast Methodology – Regression, Scenario & Sensitivity Analysis
- 17.6 Quality Control – Four-Layer Validation Framework
- 17.7 Limitations & Standard Assumptions
- 17.8 Disclaimer
