
Market Overview
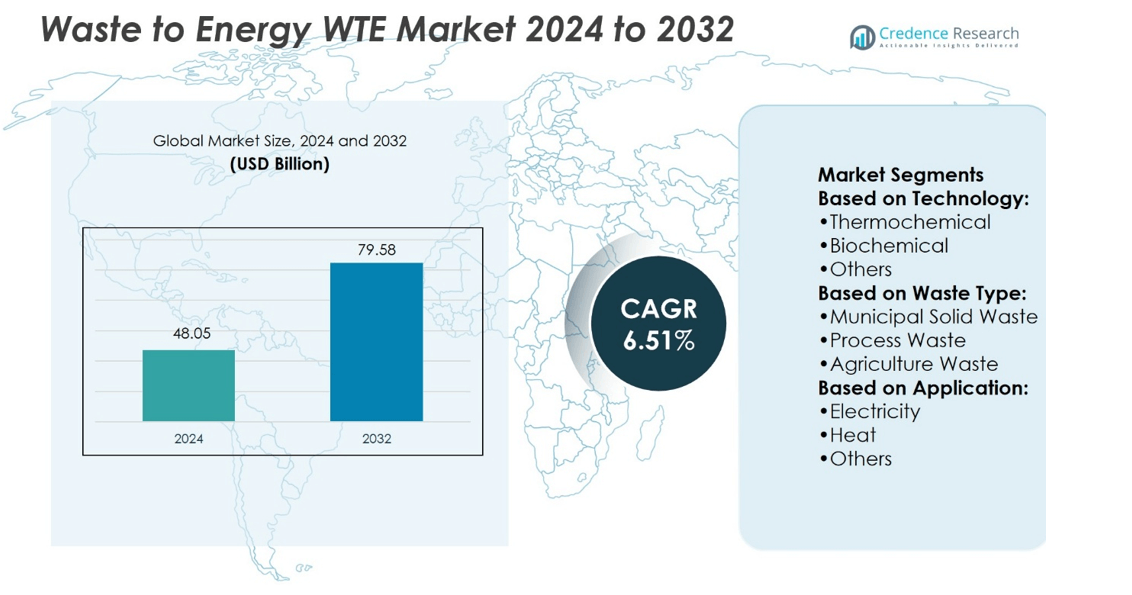
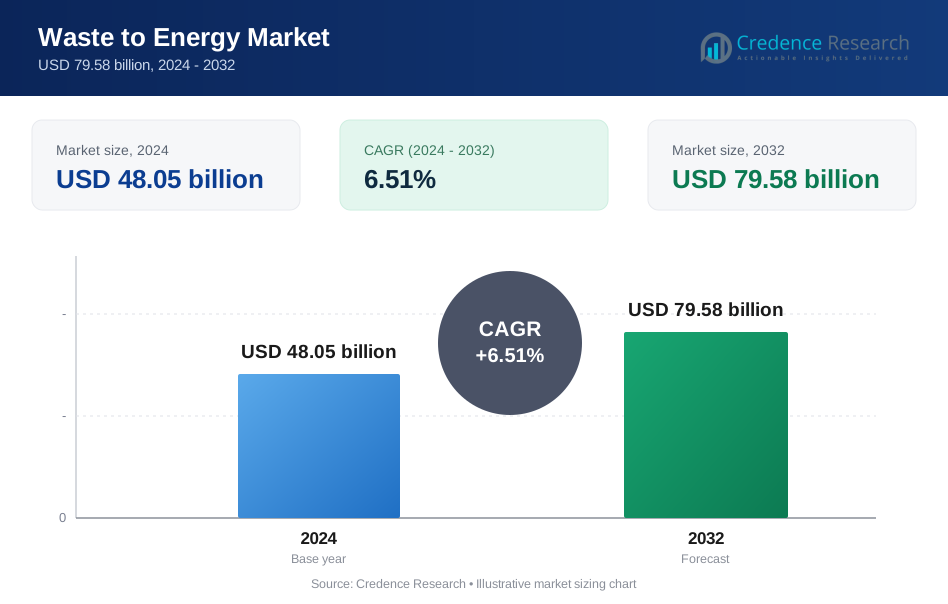
Waste to Energy WTE Market size was valued at USD 48.05 billion in 2024 and is anticipated to reach USD 79.58 billion by 2032, at a CAGR of 6.51% during the forecast period.
| REPORT ATTRIBUTE | DETAILS |
|---|---|
| Historical Period | 2020-2023 |
| Base Year | 2024 |
| Forecast Period | 2025-2032 |
| Waste to Energy (WTE) Market Size 2024 | USD 48.05 billion |
| Waste to Energy (WTE) Market, CAGR | 6.51% |
| Waste to Energy (WTE) Market Size 2032 | USD 79.58 billion |
The Waste to Energy WTE Market advances through strong drivers and evolving trends shaping global adoption. Governments enforce strict landfill diversion policies and renewable energy mandates, creating steady demand for new projects. Rising urban waste volumes push municipalities to adopt thermal and biochemical conversion methods that ensure reliable disposal and energy recovery. Technology providers integrate advanced flue gas cleaning, digital monitoring, and modular plant designs to improve efficiency and reduce emissions. Investors view the sector as a stable renewable source with long-term growth potential. The market strengthens its role within circular economy strategies and sustainable urban infrastructure planning.
Europe holds the largest share of the Waste to Energy WTE Market, supported by strict landfill restrictions and advanced district heating networks. Asia-Pacific follows with rapid expansion in China, India, and Japan due to urbanization and rising energy demand. North America maintains steady growth through plant upgrades and municipal contracts, while Latin America and the Middle East & Africa emerge as developing regions. Key players shaping the market include Hitachi Zosen, SUEZ, JFE Engineering, Mitsubishi Heavy Industries, and Everbright Environment.
Market Insights
- Waste to Energy WTE Market size was valued at USD 48.05 billion in 2024 and is projected to reach USD 79.58 billion by 2032, at a CAGR of 6.51%.
- Strong government regulations on landfill diversion and renewable energy mandates fuel consistent project demand.
- Technology trends include gasification, pyrolysis, digital monitoring, and advanced flue gas cleaning for higher efficiency.
- Competition remains strong with global firms expanding portfolios across thermal and biochemical processes.
- High capital investment and strict emission compliance act as restraints on rapid new deployments.
- Europe leads the market with 38% share, Asia-Pacific holds 45–47%, North America maintains 12%, while Latin America and Middle East & Africa contribute 5%.
- The sector gains importance in circular economy strategies, linking waste reduction with renewable power and material recovery.
Market Drivers
Growing Emphasis on Sustainable Waste Management Practices
The Waste to Energy WTE Market benefits from rising focus on sustainable waste solutions. Governments prioritize diversion of municipal solid waste away from landfills toward energy recovery. It enables cities to address growing waste volumes while producing reliable electricity. Policies encourage incineration, gasification, and pyrolysis facilities to reduce environmental impact. Municipal authorities sign long-term contracts to ensure consistent waste supply to operators. Strong emphasis on circular economy goals drives investment into advanced facilities.
- For instance, Mitsubishi Heavy Industries developed and operates the TuasOne WTE plant in Singapore. The plant processes 3,600 tonnes of waste every day and generates 120 MW of electricity. This power is sufficient to supply and the plant showcases the integration of waste processing and energy generation.
Rising Demand for Renewable and Alternative Energy Sources
Global energy demand pressures utilities to diversify sources beyond fossil fuels. The Waste to Energy WTE Market supports this goal by providing baseload renewable electricity. It generates power from non-recyclable waste, reducing dependency on coal and natural gas. Utilities adopt WTE facilities to meet renewable portfolio standards and emission targets. It also provides district heating in urban regions, improving overall energy efficiency. Investors view WTE as a stable long-term solution within energy transition strategies.
- For instance, Hitachi Zosen Inova and partners are building a new WTE plant in Abu Dhabi. It will treat 900,000 tonnes of municipal solid waste per year—about 2,700 tonnes per day—and generate 80 MW of electricity.
Advancements in Conversion and Emission Control Technologies
Technological progress strengthens adoption of modern WTE facilities worldwide. The Waste to Energy WTE Market integrates advanced flue gas cleaning, ensuring compliance with strict emission norms. It includes continuous monitoring systems that control nitrogen oxides, dioxins, and particulates. Gasification and pyrolysis systems improve thermal efficiency and maximize recovery of metals and ash. Operators deploy high-pressure boilers and turbines to boost electricity output per ton of waste. It builds confidence among regulators, investors, and local communities.
Strong Government Support and Public Funding Mechanisms
Policy frameworks remain central in shaping market development globally. The Waste to Energy WTE Market gains momentum through subsidies, tax credits, and green bonds. National governments allocate funds to expand capacity in both developed and emerging economies. It aligns with climate action commitments and sustainable development targets. Multilateral agencies also provide loans to large-scale projects in Asia, Europe, and Latin America. Consistent government support lowers investment risk and strengthens private sector participation.
Market Trends
Increasing Role of Advanced Thermal and Biological Processes
The Waste to Energy WTE Market evolves with adoption of advanced thermal and biological processes. Gasification and pyrolysis deliver higher efficiency compared to traditional incineration. It supports recovery of valuable by-products, including metals and synthetic fuels. Anaerobic digestion expands in regions prioritizing organic waste management. Technology providers emphasize modular and scalable designs for flexible deployment. This trend drives innovation pipelines and competitive differentiation.
- For instance, in France, SUEZ manages 31 energy recovery units (ERUs) treating 3.5 million tonnes of waste annually, thanks to advanced industrial and digital tech like computer vision for process optimization.
Growing Integration with Smart Grids and District Heating Networks
Utilities connect WTE facilities with smart grid infrastructure to maximize output and efficiency. The Waste to Energy WTE Market aligns with grid modernization strategies across developed economies. It ensures stable baseload supply while supporting variable renewable integration. District heating projects integrate with WTE plants to provide combined heat and power. Operators highlight efficiency gains when electricity and thermal energy are delivered simultaneously. This integration strengthens the role of WTE in sustainable urban development.
- For instance, JFE deployed advanced DEM‑CFD multiphase simulation for a 100 t/day furnace, optimizing waste feed behavior. That led to a 30 percent faster development cycle and a 20 percent reduction in NOₓ emissions, while boosting electricity output thanks to a new counterflow combustion design informed by Ansys simulations.
Expansion of Public-Private Partnerships in Infrastructure Projects
Public-private partnerships accelerate project execution and financing across multiple geographies. The Waste to Energy WTE Market benefits from shared investment risk and access to technical expertise. Municipalities contract private firms to design, build, and operate facilities under long-term agreements. It creates stable revenue models while ensuring compliance with waste management policies. Private equity and infrastructure funds enter the sector due to predictable cash flows. The trend enhances project bankability and global investment appeal.
Rising Focus on Circular Economy and Material Recovery
Circular economy objectives reshape priorities within waste management systems worldwide. The Waste to Energy WTE Market adapts by integrating metal recovery and ash utilization. Operators deploy advanced sorting to recover recyclable materials before combustion. It improves resource efficiency and reduces landfill dependency. Facilities also investigate secondary uses for bottom ash in construction materials. This trend aligns WTE projects with sustainability goals and industrial decarbonization agendas.
Market Challenges Analysis
High Capital Investment and Complex Regulatory Compliance
The Waste to Energy WTE Market faces challenges from high upfront investment requirements. Construction of large-scale plants demands advanced technology, land, and infrastructure, raising financial barriers. It relies on long-term contracts and supportive policies to ensure economic viability. Regulatory frameworks often impose strict emission standards, which require costly control systems. Operators must install continuous monitoring and flue gas treatment, increasing operational expenses. These factors slow down new project approvals, especially in emerging economies.
Public Opposition and Concerns Over Environmental Impact
Public resistance remains a key challenge for many proposed WTE projects. The Waste to Energy WTE Market must address fears of air pollution and health risks. Communities express concern over dioxins, particulates, and potential odor issues near plants. It pushes operators to invest in transparent monitoring and advanced emission control. Opposition often leads to delays in permitting, litigation, and higher development costs. Overcoming these perceptions is critical for long-term acceptance and expansion.
Market Opportunities
Expansion Potential in Emerging Economies and Rapidly Urbanizing Regions
The Waste to Energy WTE Market holds strong growth opportunities in emerging economies with rising waste volumes. Rapid urbanization creates pressure on landfills, prompting governments to explore sustainable alternatives. It allows cities to convert municipal waste into energy while reducing environmental strain. International investors view these markets as attractive due to rising energy demand. Local authorities seek partnerships to bring in advanced technology and financing support. Expansion in Asia, Latin America, and Africa offers untapped potential for project developers.
Rising Role of Innovation in Energy and Material Recovery
Technological innovation opens new opportunities for efficiency and resource recovery. The Waste to Energy WTE Market increasingly integrates systems that extract metals, plastics, and reusable ash. It creates additional revenue streams beyond electricity and heat generation. Advanced conversion methods also enable production of synthetic fuels and hydrogen. Operators leverage digital tools for predictive maintenance and improved performance. These innovations strengthen the long-term role of WTE within the circular economy.
Market Segmentation Analysis:
By Technology
The Waste to Energy WTE Market divides into thermochemical and biochemical processes. Thermochemical methods, including incineration, gasification, and pyrolysis, dominate large-scale operations due to high efficiency in reducing waste volume and generating electricity. It allows consistent baseload power, making it suitable for urban centers with high waste generation. Biochemical methods, primarily anaerobic digestion, focus on processing organic fractions of waste. This segment appeals to municipalities targeting organic diversion and production of biogas for power and heat. Growing adoption of modular designs strengthens flexibility in both approaches.
- For instance, the Kelvin WTE facility under construction in West Bromwich, U.K., will divert of non-recyclable waste per year, generating 44 MW of gross baseload electricity, enough to power over 95,000 homes.
By Waste Type
The Waste to Energy WTE Market processes diverse waste streams, with municipal solid waste holding a central role. Municipal contracts ensure consistent feedstock, securing steady output for energy plants. It drives deployment in densely populated regions facing landfill shortages. Process waste from industrial facilities also gains importance, particularly where regulations demand sustainable disposal. Agriculture waste, including crop residues and animal by-products, supports rural energy projects and bio-digestion facilities. The “others” category includes hazardous and commercial waste, serving specialized conversion applications.
- For instance, Enerkem’s demonstration facility in Edmonton, Alberta, which was retired in January 2024, was designed to process up to 350 metric tonnes of MSW per day and had a nameplate capacity of approximately 38 million liters of biofuels annually. Over its operational lifespan, the plant produced a total of 5 million liters of biofuels (methanol and ethanol combined).
By Application
Application segments in the Waste to Energy WTE Market emphasize electricity and heat generation. Electricity remains the dominant output, supplied directly into national grids through long-term power purchase agreements. It provides utilities with reliable renewable energy that complements variable sources like solar and wind. Heat applications expand where district heating infrastructure is developed, particularly in European cities. Operators highlight efficiency improvements when plants deliver combined heat and power, raising overall output from the same tonnage of waste. Industrial sites also explore localized heat supply to reduce fossil fuel use.
Segments:
Based on Technology:
- Thermochemical
- Biochemical
- Others
Based on Waste Type:
- Municipal Solid Waste
- Process Waste
- Agriculture Waste
Based on Application:
- Electricity
- Heat
- Others
Based on the Geography:
- North America
- U.S.
- Canada
- Mexico
- Europe
- UK
- France
- Germany
- Italy
- Spain
- Russia
- Belgium
- Netherlands
- Austria
- Sweden
- Poland
- Denmark
- Switzerland
- Rest of Europe
- Asia Pacific
- China
- Japan
- South Korea
- India
- Australia
- Thailand
- Indonesia
- Vietnam
- Malaysia
- Philippines
- Taiwan
- Rest of Asia Pacific
- Latin America
- Brazil
- Argentina
- Peru
- Chile
- Colombia
- Rest of Latin America
- Middle East
- UAE
- KSA
- Israel
- Turkey
- Iran
- Rest of Middle East
- Africa
- Egypt
- Nigeria
- Algeria
- Morocco
- Rest of Africa
Regional Analysis
North America
North America contributes close to 12% share of the Waste to Energy WTE Market. The United States leads with established plants, mostly in the Northeast and Florida. Policies encourage landfill diversion and promote renewable sources. Canada supports smaller projects in provinces with strong green targets. Existing plants undergo retrofits to meet modern efficiency and emission standards. Public opposition slows down new approvals in some states. The region focuses on gradual upgrades rather than rapid new construction.
Europe
Europe holds about 38% share of the Waste to Energy WTE Market. Strong laws against landfills and strict environmental standards drive the demand. Countries like Germany, Sweden, and Denmark lead with advanced plants and district heating networks. Governments support projects through subsidies and public funding. Technology innovation, including cleaner flue gas systems, keeps adoption high. Europe also invests in both thermal and biological solutions to meet climate targets. The region continues to expand capacity as cities face space limits for waste.
Asia-Pacific
Asia-Pacific accounts for nearly 45–47% share of the global market, the largest share worldwide. China operates hundreds of incineration plants that supply renewable power to the grid. India expands anaerobic digestion projects to process municipal waste. Japan and South Korea integrate WTE plants with strict emission controls. Rapid urbanization increases waste levels, pushing cities to adopt energy recovery systems. Governments set ambitious renewable targets that include WTE capacity. Investors find the region attractive for large-scale projects with steady feedstock.
North America
North America contributes close to 12% share of the Waste to Energy WTE Market. The United States leads with established plants, mostly in the Northeast and Florida. Policies encourage landfill diversion and promote renewable sources. Canada supports smaller projects in provinces with strong green targets. Existing plants undergo retrofits to meet modern efficiency and emission standards. Public opposition slows down new approvals in some states. The region focuses on gradual upgrades rather than rapid new construction.
Latin America
Latin America holds about 3% share of the global market. Brazil, Mexico, and Chile show interest in WTE to reduce landfill use. Governments test pilot projects in capital cities where waste volumes are high. Financing challenges slow down large-scale adoption. Partnerships with private firms and international banks support progress. The region looks at both thermal and biological solutions. Growth is expected as urban populations rise.
Middle East & Africa
The Middle East & Africa together account for around 2% share. The UAE and Saudi Arabia invest in large-scale incineration plants as part of renewable programs. Ethiopia’s Reppie plant is a key project in Africa. Other countries, including Kenya and South Africa, explore WTE potential. Limited funding and technical barriers remain challenges. International partnerships and aid play a major role in project development. Governments see WTE as a way to reduce landfills and create energy security.
Key Player Analysis
- Stellar3
- Hitachi Zosen
- SUEZ
- JFE Engineering
- Reworld
- Marubeni
- Babcock & Wilcox
- Enerkem
- Everbright Environment
- Mitsubishi Heavy Industries
Competitive Analysis
The Waste to Energy WTE Market players including Stellar3, Hitachi Zosen, SUEZ, JFE Engineering, Reworld, Marubeni, Babcock & Wilcox, Enerkem, Everbright Environment, and Mitsubishi Heavy Industries. The Waste to Energy WTE Market remains highly competitive, shaped by technology innovation, project financing, and regional expansion strategies. Companies invest heavily in advanced incineration, gasification, and pyrolysis systems to improve efficiency and comply with tightening emission standards. Competition intensifies in Asia-Pacific, where rapid urbanization and government mandates generate large-scale opportunities. Europe continues to be a hub for integrated waste management solutions, supported by strong policy frameworks and circular economy goals. In North America, operators focus on upgrading existing facilities and forming long-term contracts with municipalities to secure steady feedstock. Emerging markets in Latin America and the Middle East & Africa attract global attention due to growing waste volumes and limited landfill capacity. Competitive advantage is built through proven track records, access to project financing, and the ability to deliver turnkey solutions. Strategic alliances, public-private partnerships, and cross-border investments further reinforce market positions. Continuous development of biochemical pathways, such as biofuel and biogas production, expands the competitive landscape beyond thermal technologies. With governments enforcing stricter environmental policies and communities demanding sustainable waste solutions, the market rewards firms that combine technical expertise with reliable project delivery. The competitive environment is expected to remain strong, with innovation and regional diversification driving leadership.
Recent Developments
- In May 2025, Veolia North America partnered with Ingenium to launch a high-temperature treatment site in Gum Springs, Arkansas, integrating waste-heat recovery and on-site solar generation to boost energy efficiency.
- In October 2024, SUEZ and CMA CGM Group signed a memorandum of understanding to collaborate on biomethane production in Europe. This partnership aims to support the low-carbon conversion of maritime transport, aligning with sustainability goals.
- In July 2024, Babcock & Wilcox Renewable Service A/S was acquired by Hitachi Zosen Inova AG from Babcock & Wilcox Enterprise, enhancing its capabilities in renewable energy solutions. This strategic acquisition expands service offerings in the biomass and waste-to-energy sectors, strengthening Hitachi Zosen Inova's position in the global renewable energy market.
- In October 2023, Mitsubishi Heavy Industries secured a contract to rebuild the Abukuma Clean Center in Fukushima, Japan, including two 60-tpd stoker incinerators with next-generation flue-gas conditioning.
Report Coverage
The research report offers an in-depth analysis based on Technology, Waste Type, Application and Geography. It details leading market players, providing an overview of their business, product offerings, investments, revenue streams, and key applications. Additionally, the report includes insights into the competitive environment, SWOT analysis, current market trends, as well as the primary drivers and constraints. Furthermore, it discusses various factors that have driven market expansion in recent years. The report also explores market dynamics, regulatory scenarios, and technological advancements that are shaping the industry. It assesses the impact of external factors and global economic changes on market growth. Lastly, it provides strategic recommendations for new entrants and established companies to navigate the complexities of the market.
Future Outlook
- The market will expand with stronger government policies on landfill reduction.
- Urbanization will increase municipal waste volumes and drive new WTE projects.
- Advanced gasification and pyrolysis will gain wider adoption for efficiency gains.
- Biochemical processes will support growth in organic waste conversion to energy.
- Public-private partnerships will remain central to large project financing.
- Integration with smart grids will improve power stability from WTE facilities.
- District heating networks will expand in regions adopting combined heat and power.
- Technology upgrades will reduce emissions and strengthen public acceptance of projects.
- Circular economy goals will increase focus on material recovery with energy production.
- Emerging economies will present strong opportunities for new WTE infrastructure development.
Request a Free Sample
Fill in your details and we'll send you a free sample report.
- Sample data tables & charts
- Research methodology
Need a Custom Version of This Report?
Tailor the scope, geography, or segments to your exact requirements.
- Custom geography or segment scope
- Direct access to our analyst team
Frequently Asked Questions
What is the current size of the Waste to Energy (WTE) Market?
What factors are driving the growth of the Waste to Energy (WTE) Market?
What are some challenges faced by the Waste to Energy (WTE) Market?
Who are the major players in the Waste to Energy (WTE) Market?
Table of Content
Chapter 1. Report Introduction
- 1.1 Report Description & Purpose
- 1.1.1 Report Title & Market Definition
- 1.1.2 Unique Selling Propositions (USP) & Key Differentiators
- 1.1.3 Value Proposition for Stakeholders
- 1.2 Research Objectives
- 1.2.1 Market Sizing Objectives (Volume & Revenue)
- 1.2.2 Segmentation Objectives
- 1.2.3 Competitive Intelligence Objectives
- 1.2.4 Forecast & Scenario Objectives
- 1.3 Report Scope
- 1.3.1 Waste to Energy Scope – Types & Subtypes Covered
- 1.3.2 Geographic Scope – Regions & Countries Covered
- 1.3.3 Historical Period, Base Year & Forecast Period (2024; forecast to 2032)
- 1.3.4 Inclusions & Exclusions
- 1.4 HS Code & Classification Framework
- 1.5 Currency, Units & Pricing Basis
- 1.6 Target Stakeholders
- 1.7 Limitations & Assumptions
Chapter 2. Executive Summary
- 2.1 Global Waste to Energy Market Snapshot
- 2.1.1 Market Size – Historical (2024) & Forecast (2024-2032) (2024: USD 48.05 billion → 2032: USD 79.58 billion)
- 2.1.2 Volume & Revenue – Global Totals
- 2.1.3 Key Market Highlights – Top Five Facts
- 2.2 Waste to Energy Market Segmentation Snapshot
- 2.2.1 Market Split by Region – 2024 vs. 2032
- 2.3 Competitive Snapshot
- 2.3.1 Top 10 Players by Revenue Share – 2024
- 2.3.2 Top 10 Players by Volume Share – 2024
- 2.3.3 Recent Strategic Developments (18-Month Summary)
- 2.4 Key Investment Highlights & Strategic Conclusions
Chapter 3. Waste to Energy Market Dynamics & Industry Analysis
- 3.1 Market Overview & Context
- 3.1.1 Waste to Energy Market Position in the Broader Automotive Value Chain
- 3.1.2 OEM vs. Replacement Market Dynamics
- 3.1.3 Market Maturity & Development Stage by Region
- 3.2 Waste to Energy Market Drivers
- 3.3 Waste to Energy Market Restraints & Challenges
- 3.4 Waste to Energy Market Opportunities
- 3.5 Porter's Five Forces Analysis
- 3.5.1 Threat of New Entrants
- 3.5.2 Bargaining Power of Suppliers
- 3.5.3 Bargaining Power of Buyers
- 3.5.4 Threat of Substitutes
- 3.5.5 Competitive Rivalry – Intensity Assessment
- 3.6 Waste to Energy Value Chain Analysis
- 3.6.1 Upstream – Raw Material/Input Suppliers
- 3.6.1.1 Raw Material/Input 1
- 3.6.1.2 Raw Material/Input 2
- 3.6.1.3 Raw Material/Input 3
- 3.6.2 Midstream – Production/Manufacturing/Service Delivery
- 3.6.2.1 Production/Process Overview
- 3.6.2.2 Key Facility Locations & Capacity by Manufacturer
- 3.6.3 Downstream – Distribution & End Consumer
- 3.6.3.1 Primary Channel – B2B/OEM
- 3.6.3.2 Secondary Channels – Dealer, Retail, Online, Direct
- 3.6.4 Value Chain Profitability Analysis
- 3.6.1 Upstream – Raw Material/Input Suppliers
- 3.7 PESTEL Analysis
- 3.7.1 Political Factors
- 3.7.2 Economic Factors
- 3.7.3 Social Factors
- 3.7.4 Technological Factors
- 3.7.5 Environmental Factors
- 3.7.6 Legal Factors
- 3.8 Waste to Energy Supply Chain Analysis
- 3.8.1 Raw Material/Input Supply Risk Assessment
- 3.8.2 Manufacturing Concentration Risk (Geographic Exposure)
- 3.8.3 Trade Disruption Impact Analysis
- 3.9 Regulatory & Policy Landscape
Note: The regulatory and policy landscape section covers regulations based on their applicability to the market, Waste to Energy category, geography, and scope of the study. Only regulatory frameworks with a material impact on operations, compliance, trade, sustainability, or market access are analyzed in detail.
Chapter 4. Key Investment Pockets & Opportunity Analysis
- 4.1 Waste to Energy Market Attractiveness Analysis
- 4.1.1 By Region – Investment Attractiveness Matrix (Volume × CAGR)
- 4.2 Absolute Revenue Growth Opportunity
- 4.2.1 By Region – Absolute USD Growth Through 2032
- 4.3 Incremental Volume Opportunity
- 4.3.1 By Region – Incremental Volume Through 2032
- 4.3.2 Segment – Incremental Volume
- 4.4 Emerging Submarket Opportunity Deep Dive (Subject to Applicability)
- 4.5 Emerging Market Opportunity Scorecards
- 4.5.1 United States
- 4.5.2 Europe
- 4.5.3 Asia
- 4.5.4 Middle East & Africa
Note: Emerging Market Opportunity Scorecards will be included based on relevance and strategic importance. Regions listed are indicative and may vary depending on data availability and market dynamics.
Chapter 5. Waste to Energy Import-Export Analysis & Trade Flows
- 5.1 Global Trade Overview
- 5.1.1 Global Export Value by Country (2024)
- 5.1.2 Global Export Volume by Country (2024)
- 5.1.3 Global Import Value by Country (2024)
- 5.1.4 Global Import Volume by Country (2024)
- 5.1.5 Net Trade Balance by Country (2024)
- 5.2 Export Analysis – Segment
- 5.2.1 Type 1 (HS Code)
- 5.2.2 Type 2 (HS Code)
- 5.2.3 Type 3 (HS Code)
- 5.2.4 Type 4 (HS Code)
- 5.2.5 Type 5 (HS Code)
- 5.3 Import Analysis – Segment
- 5.3.1 Type 1 (HS Code)
- 5.3.2 Type 2 (HS Code)
- 5.3.3 Type 3 (HS Code)
- 5.3.4 Type 4 (HS Code)
- 5.3.5 Type 5 (HS Code)
- 5.4 Average Unit Trade Prices
- 5.4.1 Average Export Price – Segment & Country
- 5.4.2 Average Import Price – Segment & Source Country
- 5.4.3 Price Trends (2024)
- 5.5 Key Trade Route Analysis
- 5.5.1 Trade Route 1
- 5.5.2 Trade Route 2
- 5.5.3 Trade Route 3
- 5.5.4 Trade Route 4
- 5.5.5 Trade Route 5
- 5.6 Trade Policy Impact Assessment
- 5.6.1 US Anti-Dumping & Section 301 Tariffs
- 5.6.2 EU Customs Union Impact
- 5.6.3 Major Free Trade Agreements
- 5.6.4 USMCA Rules of Origin
Note: Trade policy analysis will be included only where relevant to the Waste to Energy market.
Chapter 6. Competitive Landscape & Company Benchmarking
- 6.1 Waste to Energy Market Concentration & Structure
- 6.1.1 Herfindahl-Hirschman Index (HHI) – vs. 2024
- 6.1.2 Tier 1, Tier 2 & Tier 3 Market Structure
- 6.1.3 Global, Regional & Local Player Dynamics
- 6.2 Waste to Energy Market Share Analysis – 2024
- 6.2.1 Global Revenue Share by Company
- 6.2.2 Global Volume Share by Company
- 6.2.3 Regional Revenue Share
- 6.2.4 Market Share Evolution ( vs. 2024)
- 6.2.5 OEM Segment Share by Company
- 6.2.6 Replacement Segment Share by Company
- 6.3 Production/Delivery Capacity & Facility Analysis
- 6.3.1 Global Installed Capacity
- 6.3.2 Capacity Utilization Rates
- 6.3.3 Production/Output Volume
- 6.3.4 Facility Locations & Capacity Map
- 6.3.5 Planned Capacity Additions
- 6.4 Waste to Energy Competitive Benchmarking Matrix
- 6.4.1 Revenue, Volume, CAGR & Profitability Comparison
- 6.4.2 Channel Revenue Mix
- 6.4.3 Geographic Revenue Exposure
- 6.4.4 R&D Intensity
- 6.4.5 Sustainability Maturity
- 6.5 Strategic Developments in Waste to Energy (Last 24 Months)
- 6.5.1 Mergers, Acquisitions & Divestments
- 6.5.2 New Waste to Energy Launches
- 6.5.3 Facility Expansions
- 6.5.4 Strategic Alliances, Joint Ventures & Partnerships
- 6.5.5 Distribution Expansion & Market Entry
- 6.5.6 Sustainability & ESG Initiatives
- 6.6 Competitive Strategy Mapping
- 6.6.1 Leader, Challenger, Follower & Niche Classification
- 6.6.2 Pricing Strategy Comparison
- 6.6.3 Channel Strategy Matrix
Note: Strategic developments are included based on their materiality and the availability of reliable information.
Chapter 7. Global Waste to Energy Market – By Distribution Channel
- 7.1 Segment Overview
- 7.1.1 Volume & Revenue Split by Channel (2024 & 2032)
- 7.1.2 Channel Mix Evolution (2024-2032)
Chapter 8. Regional Market Analysis – Global Overview
- 8.1 Global Regional Overview
- 8.1.1 Regional Volume Share
- 8.1.2 Regional Revenue Share
- 8.1.3 Regional Volume by Region
- 8.1.4 Regional Revenue by Region
- 8.1.5 Regional Forecast Through 2032
- 8.2 Cross-Regional Segment Analysis
- 8.2.1 By Distribution Channel
- 8.2.2 By Brand/Price Tier
Chapter 9. North America Waste to Energy Market
- 9.1 United States
- 9.2 Canada
- 9.3 Mexico
Chapter 10. Europe Waste to Energy Market
- 10.1 Germany
- 10.2 France
- 10.3 Italy
- 10.4 United Kingdom
- 10.5 Spain
- 10.6 Poland
- 10.7 Russia
- 10.8 Netherlands
- 10.9 Belgium
- 10.10 Sweden
- 10.11 Denmark
- 10.12 Norway
- 10.13 Rest of Europe
Chapter 11. Asia Pacific Waste to Energy Market
- 11.1 China
- 11.2 India
- 11.3 Japan
- 11.4 South Korea
- 11.5 Thailand
- 11.6 Indonesia
- 11.7 Vietnam
- 11.8 Malaysia
- 11.9 Australia
- 11.10 Rest of Asia Pacific
Chapter 12. Latin America Waste to Energy Market
- 12.1 Brazil
- 12.2 Argentina
- 12.3 Colombia
- 12.4 Chile
- 12.5 Rest of Latin America
Chapter 13. Middle East Waste to Energy Market
- 13.1 Saudi Arabia
- 13.2 United Arab Emirates
- 13.3 Turkey
- 13.4 Israel
- 13.5 Iran
- 13.6 Rest of the Middle East
Chapter 14. Africa Waste to Energy Market
- 14.1 South Africa
- 14.2 Egypt
- 14.3 Nigeria
- 14.4 Morocco
- 14.5 Rest of Africa
Chapter 15. Waste to Energy Company Profiles
- 15.1 [Company 01]
- 15.1.1 Company Overview
- 15.1.2 Key Management Personnel
- 15.1.3 Products & Services Portfolio
- 15.1.4 Financial Performance
- 15.1.5 Key Market Focus & Geographic Presence
- 15.1.6 Recent Developments & Strategic Initiatives
Note: The company profile list is preliminary and may change based on research findings, market developments, data availability, and client requirements.
Chapter 16. Appendices
- Appendix A – List of Abbreviations & Acronyms
- Appendix B – Industry Classification Code Reference – Full Series
- Appendix C – Production & Capacity Data Tables
- Appendix D – End-Use & Demand Base Tables
- Appendix E – Consumption & Replacement Rate Assumptions
- Appendix F – ASP Reference Tables
- Appendix G – Manufacturing & Facility Database
- Appendix H – Import-Export Data Tables
- Appendix I – Regulatory Summary Tables
- Appendix J – Primary Research Participant List (Anonymized)
- Appendix K – Primary Research Questionnaire Framework
- Appendix L – Data Sources & Bibliography
- Appendix M – Market Size Divergence & Source Comparison
Chapter 17. Research Methodology
- 17.1 Research Framework & Philosophy
- 17.2 Secondary Research – Sources, Hierarchy & Data Extraction
- 17.3 Data Modeling – Bottom-Up & Top-Down Market Sizing
- 17.4 Primary Research – Stakeholder Framework, LOI & Sample Sizes
- 17.5 Forecast Methodology – Regression, Scenario & Sensitivity Analysis
- 17.6 Quality Control – Four-Layer Validation Framework
- 17.7 Limitations & Standard Assumptions
- 17.8 Disclaimer
