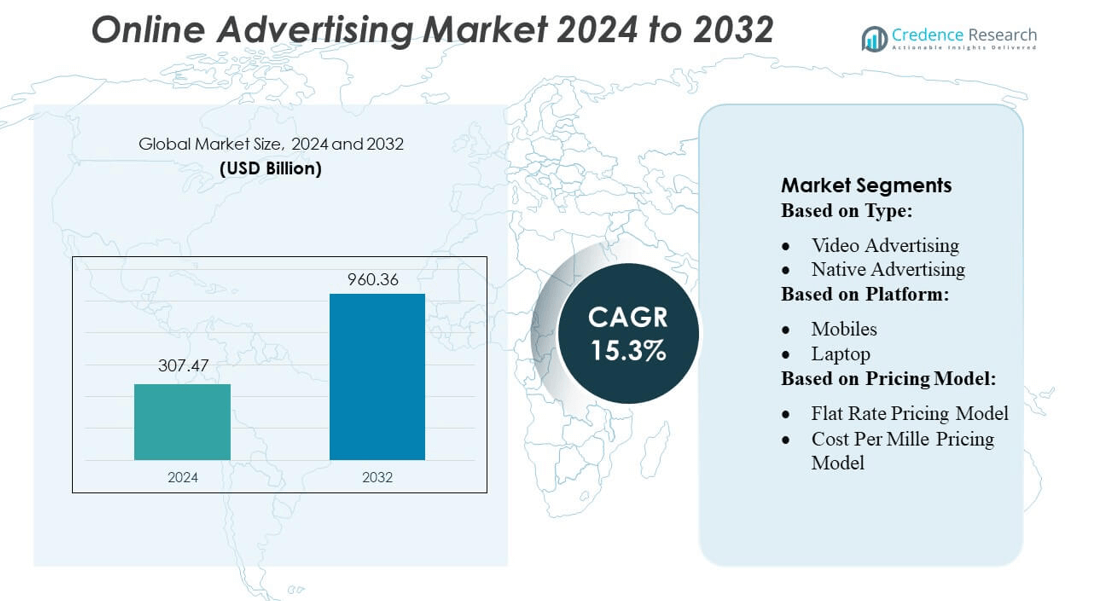
Online Advertising Market By Format Search Engine Marketing, Display Advertising, Classified, Mobile, Digital Video, Lead, Generation, Rich Media, Others By Vertical Automotive, BFSI, CPG, Education, Healthcare, Industrial, Media and Entertainment, Retail, Telecommunication and Information Technology-Enabled Services (ITES), Transport and Telecom, Others)-Growth, Future Prospects & Competitive Analysis, 2016 – 2030

Price: $4999

Published: | Report ID: 19038 | Report Format : PDF

Key Highlights of the Report

The global online advertising market is segmented by format, vertical and region. Search Engine Marketing is the most popular, while display advertising and classified are the primary user segments. Automotive and BFSI are the most commonly used verticals, with Asia Pacific leading the market growth.

The global online advertising market has several drivers, including the rising use of mobile devices further stimulates the online advertising market. Additionally, people are spending more time online and interacting with digital content due to the widespread adoption of smartphones and tablets. However, the market also faces significant challenges, such as the rising concern over data privacy and online tracking is another barrier to the market for online advertising.

Nonetheless, the global online advertising market offers significant growth opportunities, including huge growth potential in Asia. The single most significant factor has been the rising global internet adoption rate. Advertising offers sophisticated targeting options that allow advertisers to focus their messages on specific audiences based on their demographics, interests, behavior, and other characteristics. As more people access the Internet, the potential audience for online advertisements grows, opening up more opportunities for advertisers to provide further growth prospects for the industry.

Market Overview

The global online advertising market has witnessed steady growth in recent years and is expected to grow at a CAGR of 11.50% between 2023 and 2030. The market was valued at USD 215.9 billion in 2022 and is expected to reach USD 462.569 billion in 2030.

What Are The Main Drivers Of The Global Online Advertising Market?

The global online advertising market is driven by several factors, including the rising use of mobile devices further stimulates the online advertising market. Additionally, as a result of the widespread use of smartphones and tablets, people are spending more time online and interacting with digital content.

Design Element 2

Access crucial information at unmatched prices!

Request your free sample report today & start making informed decisions powered by Credence Research!

Download Free Sample
CTA Design Element 3

What Are The Major Challenges Faced By The Global Online Advertising Market?

The global online advertising market also faces several challenges, including the market also faces significant challenges, such as rising concern over data privacy and online tracking is another barrier to the market for online advertising.

What Are The Growth Opportunities In The Global Online Advertising Market?

The global online advertising market offers significant growth opportunities, including huge growth potential in the Asia Pacific region; online advertising provides sophisticated targeting options that enable advertisers to target particular audiences based on demographics, interests, behavior, and other factors.

Online Advertising Market

Executive Summary

Overview of the Global Online Advertising Market

The global online advertising market has been steadily growing in recent years, driven by The increasing rate of internet adoption worldwide has been the single most significant factor driving the market for online advertising globally in recent years. With more people having access to the Internet, there is a larger potential audience for online advertisements, providing more opportunities for advertisers to contribute to the industry’s continued growth.

Market Definition

Online marketing, also known as Internet marketing, digital marketing, or web marketing, is a subset of marketing and advertising that makes use of the Internet to advertise products and services to target markets and platform users. Online advertising includes practices like email marketing, search engine marketing (SEM), social media marketing, various display advertising (including web banner advertising), and mobile advertising. Automated software programs that work across numerous websites, media services, and platforms are increasingly used to deliver advertisements. This practice is known as programmatic advertising.

Market Insights

  • The global demand for online advertising was valued at USD 215.9 Billion in 2022 and is expected to reach USD 462.569 Billion in 2030, growing at a CAGR of 11.50% between 2023 and 2030.
  • Search engine marketing is the leading segment by material. It will hold over 45% share in value in 2022, while the display advertising segment is likely to exhibit the fastest CAGR during the forecast period.
  • The Automotive segment governs the demand for online advertising globally, holding a massive share of over 80% in 2022, and is expected to grow at a rapid CAGR.
  • The BFSI segment is expected to post the highest CAGR during the forecast period.
  • Asia Pacific is fueling the growth of the online advertising industry with over one-third share in 2022, while North America and Europe collectively account for just under 50% share in 2022. Europe held over 22% share in 2022.
  • The growing global internet adoption rate has been the most important factor in the market’s major driver. At the same time, the rising concern over data privacy and online tracking are the main restraints.
  • The huge growth potential in Asia Pacific and online advertising provides sophisticated targeting options that enable advertisers to target particular audiences based on demographics, interests, behavior, and other factors are the major opportunities in the market.

Segmentation by Format

  • Search engine marketing is the leading segment by format and held over 45% share in value in 2022.
  • The Display advertising segment will likely exhibit the fastest CAGR during the forecast period.
  • Classified is another segment but contributes very little to the global online advertising market compared to the search engine marketing and display advertising segments.

Segmentation by Vertical

  • The automotive segment governs the demand for online advertising worldwide, holding a massive share of over 80% in 2022, and is also expected to grow at a rapid CAGR.
  • The BFSI segment contributes to the rest of the demand for online advertising.

Segmentation by Region

  • Asia Pacific is fueling the growth of the online advertising industry with over one-third share in 2022.
  • North America and Europe collectively account for just under 50% share in 2022, with Europe holding over 22% share in the same year.
  • The rest of the World, including Latin America, The Middle East, and Africa, contributes the remainder to the demand for online advertising.

The most crucial factor has been the rising rate of internet adoption across the globe. The potential audience for online advertisements expands as more people gain access to the Internet, giving advertisers more chances to contribute to the industry’s continued growth.

The United States has a sizable market share and is one of North America’s largest markets for online advertising. Thanks to social media platforms’ sophisticated targeting tools and huge user databases, online advertising is now more cost-effective and targeted. Additionally, the COVID-19 pandemic has raised interest in indoor pursuits like puzzles, increasing demand for them and driving up sales in the U. S.

Additionally, advertisers are now better equipped to measure and optimize their online advertising campaigns thanks to the expanding availability and accessibility of data analytics tools. With the ability to track key performance indicators like click-through rates, conversions, and return on investment (ROI), advertisers can make strategic adjustments and use their budgets more effectively. This data-driven strategy has facilitated the overall expansion and efficacy of the online advertising market.

The Rising Use Of Mobile Devices

The rising use of mobile devices further stimulates the online advertising market. The increasing use of smartphones and tablets has increased internet activity and interaction with digital information. Due to this change in consumer behavior, advertisers are focusing on mobile advertising formats like in-app ads and mobile-friendly websites to effectively reach their target audience.

The advertising landscape has also changed dramatically due to the growth of social media platforms. With billions of users on social media platforms like Facebook, Instagram, Twitter, and LinkedIn, advertisers now have the option to target particular demographics and tailor their campaigns. Online advertising is now more targeted and cost-effective thanks to social media platforms’ sophisticated targeting tools and vast user databases.

More People Have Access To The Internet

The market for online advertising has grown significantly over the past few years as a result of many significant factors. The single most significant factor has been the increasing rate of internet adoption around the world. The potential audience for online advertisements expands as more people gain access to the Internet, providing more opportunities for advertisers. Additionally, thanks to the expanding availability and accessibility of data analytics tools, advertisers are now better prepared to measure and optimize their online advertising campaigns. Advertisers can use their budgets more wisely and make strategic adjustments by tracking key performance indicators like click-through rates, conversions, and return on investment (ROI). This data-driven approach has made the online advertising market more effective and expanded overall.

Finally, the COVID-19 pandemic has sped up the transition to digital advertising. Advertisers have realized the value of interacting with consumers online because people are spending more time at home and relying heavily on digital platforms for information, entertainment, and shopping. In order to maintain their brand visibility, boost sales, and adjust to the shifting consumer behavior during the pandemic, many companies have increased their investments in online advertising.

The Rising Concern Over Data Privacy And Online Tracking

While the online advertising market has experienced significant growth, it also needs some limitations that may limit its future growth and potential. The problem of ad-blocking software and consumer ad fatigue is one of the main barriers. By blocking or filtering online ads, users of ad-blocking software can lessen the impact and visibility of digital ads. Advertisers need help to reach their target audience and achieve desired conversion rates as more internet users use ad-blocking software. Additionally, annoying or pointless advertisements have worn down consumers, resulting in ad fatigue. This indicates that users might form a negative opinion of online advertising, which would lower engagement and ad effectiveness. Ad blockers are increasingly popular, especially on desktop and mobile devices, as users try to regulate their online experiences by obstructing intrusive or pointless ads. Advertisers are now exploring more innovative and non-intrusive ad formats to effectively reach their target audience. The General Data Protection Regulation (GDPR) in the European Union and the California Consumer Privacy Act (CCPA) in the United States are just two examples of the increased regulations brought on by growing privacy and data protection concerns. These laws have affected how online advertisers gather, use, and store user data. Advertisers are turning more of their attention to mobile advertising due to the growing popularity of smartphones and tablets. With platforms like YouTube and social media networks providing video ad formats to effectively engage users, video advertising has also grown in popularity.

Ad Fraud And Invalid Traffic Present 

Ad fraud and invalid traffic present a problem for the online advertising market. False ad impressions, clicks, or conversions result from dishonest or dishonest behavior, referred to as “ad fraud”. This undermines the trust and credibility of the online advertising ecosystem and costs advertisers money in wasted advertising expenditures. Advertisers need to implement effective fraud detection and prevention mechanisms to reduce the risk of ad fraud and ensure that their advertising budgets are used effectively.

Changes in consumer behavior and technology can also have an impact on the market for online advertising. The traditional advertising formats may be disrupted by new technologies like ad-blocking, virtual reality, or voice-activated devices, necessitating the modification of advertising strategies. The reach and efficiency of online advertising can also be affected by changes in consumer behavior, such as the expansion of ad-free subscription services or a rise in interest in ad-free experiences.

Mobile Advertising In Asia Pacific

The Asia Pacific area offers a sizable opportunity for the internet advertising business because of its sizable population and rising standard of living. As smartphones and tablets are used more regularly, mobile advertising has grown to be a key possibility within the internet advertising business. Employing location data in mobile advertising that give tailored experiences allows advertisers to contact customers while they are on the go and boost engagement. Through the automated purchase and sale of ad inventory, programmatic advertising offers effectiveness, scalability, and improved targeting. It gives marketers the chance to hone their ads, target the correct demographics, and boost cost efficiency. The growth of internet video consumption has made prospects for video advertising available.

Provides Sophisticated Targeting Options

Another barrier to the market for online advertising is the growing concern over data privacy and online tracking. As user data is gathered and used for targeted advertising on a larger scale, people are becoming more concerned about their privacy and the security of their personal information. The ability of advertisers to compile thorough user insights and deliver personalized ads has been hampered by regulations like the General Data Protection Regulation (GDPR) in Europe and comparable data privacy laws in other regions.

Competitive Landscape

Key Players

The global online advertising market is highly competitive, with the presence of several key players. Some of the major players in the market and their market share are as follows:

These companies focus on product innovation, expanding their distribution channels, and mergers and acquisitions to stay ahead in the market. The major players in the global online advertising market are constantly striving to stay ahead by introducing new products and innovations.

The California Consumer Privacy Act (CCPA) in the United States and the General Data Protection Regulation (GDPR) in the European Union are just two examples of the stricter laws brought on by growing privacy and data protection concerns. These rules have an effect on the gathering, using, and archiving of user data by online advertising. Advertisers are concentrating more on mobile advertising due to the growing popularity of smartphones and tablets. Because platforms like YouTube and social media networks provide video ad formats that effectively engage people, video advertising has grown in popularity.

Ad blockers are becoming more and more common in 2021, particularly on desktop and mobile devices as users try to control their online experiences by blocking intrusive or pointless ads. In order to effectively reach their target audience, advertisers are now experimenting with more creative and unobtrusive ad formats.

Summary of Key Findings

  • The rising use of mobile devices for online advertising is driving market growth
  • Market segmented by format, vertical and region.
  • Search Engine Marketing is the most popular, with Automotive and BFSI segments.
  • The rising concern over data privacy and online tracking is another barrier to the market for online advertising
  • Asia Pacific is leading market growth; the market is highly competitive with key players including Aol, Inc, Baidu, Facebook, Google, IAC, Linkedin, Microsoft, and Twitter

Shape Your Report to Specific Countries or Regions & Enjoy 30% Off!

Future Outlook

  • Positive outlook for the global online advertising market with significant growth potential in the Asia Pacific region
  • Increasing adoption of online advertising in educational settings and innovative distribution channels such as e-commerce to drive growth
  • Challenges from the rising popularity of online games and economic instability
  • Key players to focus on product innovation, expanding market reach and maintaining competitive pricing to stay ahead in the market.

Segmentation

  • By Format
    • Search Engine Marketing
    • Display Advertising
    • Classified
    • Mobile
    • Digital Video
    • Lead Generation
    • Rich Media
    • Others
  • By Vertical
    • Automotive
    • BFSI
    • CPG
    • Education
    • Healthcare
    • Industrial
    • Media and Entertainment
    • Retail
    • Telecommunication and Information Technology-Enabled Services (ITES)
    • Transport and Telecom
    • Others
  • By Region
  • North America
    • The US.
    • Canada
    • Mexico
  • Europe
    • Germany
    • France
    • The U.K.
    • Italy
    • Spain
    • Rest of Europe
  • Asia Pacific
    • China
    • Japan
    • India
    • South Korea
    • South-east Asia
    • Rest of Asia Pacific
  • Latin America
    • Brazil
    • Argentina
    • Rest of Latin America
  • Middle East & Africa
    • GCC Countries
    • South Africa
    • Rest of the Middle East and Africa

1. Preface
1.1. Report Description
1.1.1. Purpose of the Report
1.1.2. Target Audience
1.1.3. USP and Key Offerings
1.2. Research Scope
1.3. Research Methodology
1.3.1. Phase I – Secondary Research
1.3.2. Phase II – Data Modelling
1.3.2.1. Company Share Analysis Model
1.3.2.2. Revenue Based Modelling
1.3.3. Phase III – Primary Research
1.3.4. Research Limitations
1.3.5. Assumptions
1.4. Market Introduction
1.5. Market Research Scope

2. Executive Summary
2.1. Market Snapshot: Online Advertising Market
2.2. Online Advertising Market, By Format
2.3. Online Advertising Market, By Vertical
2.4. Online Advertising Market, By Region

3. Market Dynamics & Factors Analysis
3.1. Introduction
3.1.1. Online Advertising Market Value, 2017-2030, (US$ Bn)
3.1.2. Y-o-Y Growth Trend Analysis
3.2. Market Dynamics
3.2.1. Market Drivers
3.2.1.1. Driver 1
3.2.1.2. Driver 2
3.2.1.3. Driver 3
3.2.2. Market Restraints
3.2.2.1. Restraint 1
3.2.2.2. Restraint 2
3.2.3. Market Opportunities
3.2.3.1. Opportunity 1
3.2.3.2. Opportunity 2
3.2.4. Major Industry Challenges
3.2.4.1. Challenge 1
3.2.4.2. Challenge 2
3.3. Growth and Development Patterns
3.4. Investment Feasibility Analysis
3.5. Market Opportunity Analysis
3.5.1. Format
3.5.2. Vertical
3.5.3. Geography

4. Premium Insights
4.1. STAR (Situation, Task, Action, Results) Analysis
4.2. Porter’s Five Forces Analysis
4.2.1. Threat of New Entrants
4.2.2. Bargaining Power of Buyers/Consumers
4.2.3. Bargaining Power of Suppliers
4.2.4. Threat of Substitute Types
4.2.5. Intensity of Competitive Rivalry
4.3. Key Market Trends
4.3.1. Demand Side Trends
4.3.2. Supply Side Trends
4.4. Value Chain Analysis
4.5. Format Analysis
4.6. Analysis and Recommendations
4.7. Marketing Strategy Analysis
4.7.1. Direct Marketing
4.7.2. Indirect Marketing
4.7.3. Marketing Channel Development Trend

5. Market Positioning of Key Players, 2022
5.1. Company market share of key players, 2022
5.2. Competitive Benchmarking
5.3. Market Positioning of Key Vendors
5.4. Geographical Presence Analysis
5.5. Major Strategies Adopted by Key Players
5.5.1. Key Strategies Analysis
5.5.2. Mergers and Acquisitions
5.5.3. Partnerships
5.5.4. Product Launch
5.5.5. Geographical Expansion
5.5.6. Others

6. Economic Impact Analysis
6.1. Recession Impact
6.1.1. North America
6.1.2. Europe
6.1.3. Asia Pacific
6.1.4. Latin America
6.1.5. Middle East and Africa
6.2. Ukraine-Russia War Impact
6.2.1. North America
6.2.2. Europe
6.2.3. Asia Pacific
6.2.4. Latin America
6.2.5. Middle East and Africa
6.3. COVID-19 Impact Analysis
6.3.1. North America
6.3.2. Europe
6.3.3. Asia Pacific
6.3.4. Latin America
6.3.5. Middle East and Africa

7. Online Advertising Market, By Format
7.1. Online Advertising Market Overview, by Format
7.1.1. Online Advertising Market Revenue Share, By Format, 2022 Vs 2030 (in %)
7.2. Search Engine Marketing
7.2.1. Online Advertising Market, By Region, 2017-2030 (US$ Bn)
7.3. Display Advertising
7.3.1. Online Advertising Market, By Region, 2017-2030 (US$ Bn)
7.4. Classified
7.4.1. Online Advertising Market, By Region, 2017-2030 (US$ Bn)
7.5. Mobile
7.5.1. Online Advertising Market, By Region, 2017-2030 (US$ Bn)
7.6. Digital Video
7.6.1. Online Advertising Market, By Region, 2017-2030 (US$ Bn)
7.7. Lead Generation
7.7.1. Online Advertising Market, By Region, 2017-2030 (US$ Bn)
7.8. Rich Media
7.8.1. Online Advertising Market, By Region, 2017-2030 (US$ Bn)
7.9. Others
7.9.1. Online Advertising Market, By Region, 2017-2030 (US$ Bn)

8. Online Advertising Market, By Vertical
8.1. Online Advertising Market Overview, by Vertical
8.1.1. Online Advertising Market, By Vertical, 2022 vs 2030 (in %)
8.2. Automotive
8.2.1. Online Advertising Market, By Region, 2017-2030 (US$ Bn)
8.3. BFSI
8.3.1. Online Advertising Market, By Region, 2017-2030 (US$ Bn)
8.4. CPG
8.4.1. Online Advertising Market, By Region, 2017-2030 (US$ Bn)
8.5. Education
8.5.1. Online Advertising Market, By Region, 2017-2030 (US$ Bn)
8.6. Healthcare
8.6.1. Online Advertising Market, By Region, 2017-2030 (US$ Bn)
8.7. Industrial
8.7.1. Online Advertising Market, By Region, 2017-2030 (US$ Bn)
8.8. Media and Entertainment
8.8.1. Online Advertising Market, By Region, 2017-2030 (US$ Bn)
8.9. Retail
8.9.1. Online Advertising Market, By Region, 2017-2030 (US$ Bn)
8.10. Telecommunication and Information Technology-Enabled Services (ITES)
8.10.1. Online Advertising Market, By Region, 2017-2030 (US$ Bn)
8.11. Transport and Telecom
8.11.1. Online Advertising Market, By Region, 2017-2030 (US$ Bn)
8.12. Others
8.12.1. Online Advertising Market, By Region, 2017-2030 (US$ Bn)

9. Online Advertising Market, By Region
9.1. Online Advertising Market Overview, by Region
9.1.1. Online Advertising Market, By Region, 2022 vs 2030 (in%)
9.2. Format
9.2.1. Online Advertising Market, By Format, 2017-2030 (US$ Bn)
9.3. Vertical
9.3.1. Online Advertising Market, By Vertical, 2017-2030 (US$ Bn)

10. North America Online Advertising Market Analysis
10.1. North America Online Advertising Market, by Format, 2017-2030(US$ Bn)
10.1.1. Overview
10.1.2. SRC Analysis
10.2. North America Online Advertising Market, by Vertical, 2017-2030(US$ Bn)
10.2.1. Overview
10.2.2. SRC Analysis
10.3. North America Online Advertising Market, by Country, 2017-2030 (US$ Bn)
10.3.1. North America Online Advertising Market, by Country, 2022 Vs 2030 (in%)
10.3.2. U.S.
10.3.2.1. U.S. Online Advertising Market Estimates and Forecast, 2017-2030 (US$ Bn)
10.3.2.2. U.S. Smart Shopping Cart, By Format, 2017-2030 (US$ Bn)
10.3.2.3. U.S. Smart Shopping Cart, By Vertical, 2017-2030 (US$ Bn)
10.3.3. Canada
10.3.3.1. Canada Online Advertising Market Estimates and Forecast, 2017-2030 (US$ Bn)
10.3.3.2. Canada Smart Shopping Cart, By Format, 2017-2030 (US$ Bn)
10.3.3.3. Canada Smart Shopping Cart, By Vertical, 2017-2030 (US$ Bn)
10.3.4. Mexico
10.3.4.1. Mexico Online Advertising Market Estimates and Forecast, 2017-2030 (US$ Bn)
10.3.4.2. Mexico Smart Shopping Cart, By Format, 2017-2030 (US$ Bn)
10.3.4.3. Mexico Smart Shopping Cart, By Vertical, 2017-2030 (US$ Bn)

11. Europe Online Advertising Market Analysis
11.1. Europe Online Advertising Market, by Format, 2017-2030(US$ Bn)
11.1.1. Overview
11.1.2. SRC Analysis
11.2. Europe Online Advertising Market, by Vertical, 2017-2030(US$ Bn)
11.2.1. Overview
11.2.2. SRC Analysis
11.3. Europe Online Advertising Market, by Country, 2017-2030 (US$ Bn)
11.3.1. Europe Online Advertising Market, by Country, 2022 Vs 2030 (in%)
11.3.2. Germany
11.3.2.1. Germany Online Advertising Market Estimates and Forecast, 2017-2030 (US$ Bn)
11.3.2.2. Germany Smart Shopping Cart, By Format, 2017-2030 (US$ Bn)
11.3.2.3. Germany Smart Shopping Cart, By Vertical, 2017-2030 (US$ Bn)
11.3.3. France
11.3.3.1. France Online Advertising Market Estimates and Forecast, 2017-2030 (US$ Bn)
11.3.3.2. France Smart Shopping Cart, By Format, 2017-2030 (US$ Bn)
11.3.3.3. France Smart Shopping Cart, By Vertical, 2017-2030 (US$ Bn)
11.3.4. UK
11.3.4.1. UK Online Advertising Market Estimates and Forecast, 2017-2030 (US$ Bn)
11.3.4.2. UK Smart Shopping Cart, By Format, 2017-2030 (US$ Bn)
11.3.4.3. UK Smart Shopping Cart, By Vertical, 2017-2030 (US$ Bn)
11.3.5. Italy
11.3.5.1. Italy Online Advertising Market Estimates and Forecast, 2017-2030 (US$ Bn)
11.3.5.2. Italy Smart Shopping Cart, By Format, 2017-2030 (US$ Bn)
11.3.5.3. Italy Smart Shopping Cart, By Vertical, 2017-2030 (US$ Bn)
11.3.6. Spain
11.3.6.1. Spain Online Advertising Market Estimates and Forecast, 2017-2030 (US$ Bn)
11.3.6.2. Spain Smart Shopping Cart, By Format, 2017-2030 (US$ Bn)
11.3.6.3. Spain Smart Shopping Cart, By Vertical, 2017-2030 (US$ Bn)
11.3.7. Rest of Europe
11.3.7.1. Rest of Europe Online Advertising Market Estimates and Forecast, 2017-2030 (US$ Bn)
11.3.7.2. Rest of Europe Smart Shopping Cart, By Format, 2017-2030 (US$ Bn)
11.3.7.3. Rest of Europe Smart Shopping Cart, By Vertical, 2017-2030 (US$ Bn)

12. Asia Pacific Online Advertising Market Analysis
12.1. Asia Pacific Online Advertising Market, by Format, 2017-2030(US$ Bn)
12.1.1. Overview
12.1.2. SRC Analysis
12.2. Asia Pacific Online Advertising Market, by Vertical, 2017-2030(US$ Bn)
12.2.1. Overview
12.2.2. SRC Analysis
12.3. Asia Pacific Online Advertising Market, by Country, 2017-2030 (US$ Bn)
12.3.1. Asia Pacific Online Advertising Market, by Country, 2022 Vs 2030 (in%)
12.3.2. China
12.3.2.1. China Online Advertising Market Estimates and Forecast, 2017-2030 (US$ Bn)
12.3.2.2. China Smart Shopping Cart, By Format, 2017-2030 (US$ Bn)
12.3.2.3. China Smart Shopping Cart, By Vertical, 2017-2030 (US$ Bn)
12.3.3. Japan
12.3.3.1. Japan Online Advertising Market Estimates and Forecast, 2017-2030 (US$ Bn)
12.3.3.2. Japan Smart Shopping Cart, By Format, 2017-2030 (US$ Bn)
12.3.3.3. Japan Smart Shopping Cart, By Vertical, 2017-2030 (US$ Bn)
12.3.4. India
12.3.4.1. India Online Advertising Market Estimates and Forecast, 2017-2030 (US$ Bn)
12.3.4.2. India Smart Shopping Cart, By Format, 2017-2030 (US$ Bn)
12.3.4.3. India Smart Shopping Cart, By Vertical, 2017-2030 (US$ Bn)
12.3.5. South Korea
12.3.5.1. South Korea Online Advertising Market Estimates and Forecast, 2017-2030 (US$ Bn)
12.3.5.2. South Korea Smart Shopping Cart, By Format, 2017-2030 (US$ Bn)
12.3.5.3. South Korea Smart Shopping Cart, By Vertical, 2017-2030 (US$ Bn)
12.3.6. South-East Asia
12.3.6.1. South-East Asia Online Advertising Market Estimates and Forecast, 2017-2030 (US$ Bn)
12.3.6.2. South-East Asia Smart Shopping Cart, By Format, 2017-2030 (US$ Bn)
12.3.6.3. South-East Asia Smart Shopping Cart, By Vertical, 2017-2030 (US$ Bn)
12.3.7. Rest of Asia Pacific
12.3.7.1. Rest of Asia Pacific Online Advertising Market Estimates and Forecast, 2017-2030 (US$ Bn)
12.3.7.2. Rest of Asia Pacific Smart Shopping Cart, By Format, 2017-2030 (US$ Bn)
12.3.7.3. Rest of Asia Pacific Smart Shopping Cart, By Vertical, 2017-2030 (US$ Bn)

13. Latin America Online Advertising Market Analysis
13.1. Latin America Online Advertising Market, by Format, 2017-2030(US$ Bn)
13.1.1. Overview
13.1.2. SRC Analysis
13.2. Latin America Online Advertising Market, by Vertical, 2017-2030(US$ Bn)
13.2.1. Overview
13.2.2. SRC Analysis
13.3. Latin America Online Advertising Market, by Country, 2017-2030 (US$ Bn)
13.3.1. Latin America Online Advertising Market, by Country, 2022 Vs 2030 (in%)
13.3.2. Brazil
13.3.2.1. Brazil Online Advertising Market Estimates and Forecast, 2017-2030 (US$ Bn)
13.3.2.2. Brazil Smart Shopping Cart, By Format, 2017-2030 (US$ Bn)
13.3.2.3. Brazil Smart Shopping Cart, By Vertical, 2017-2030 (US$ Bn)
13.3.3. Argentina
13.3.3.1. Argentina Online Advertising Market Estimates and Forecast, 2017-2030 (US$ Bn)
13.3.3.2. Argentina Smart Shopping Cart, By Format, 2017-2030 (US$ Bn)
13.3.3.3. Argentina Smart Shopping Cart, By Vertical, 2017-2030 (US$ Bn)
13.3.4. Rest of Latin America
13.3.4.1. Rest of Latin America Online Advertising Market Estimates and Forecast, 2017-2030 (US$ Bn)
13.3.4.2. Rest of Latin America Smart Shopping Cart, By Format, 2017-2030 (US$ Bn)
13.3.4.3. Rest of Latin America Smart Shopping Cart, By Vertical, 2017-2030 (US$ Bn)

14. Middle East and Africa Online Advertising Market Analysis
14.1. Middle East and Africa Online Advertising Market, by Format, 2017-2030(US$ Bn)
14.1.1. Overview
14.1.2. SRC Analysis
14.2. Middle East and Africa Online Advertising Market, by Vertical, 2017-2030(US$ Bn)
14.2.1. Overview
14.2.2. SRC Analysis
14.3. Middle East and Africa Online Advertising Market, by Country, 2017-2030 (US$ Bn)
14.3.1. Middle East and Africa Online Advertising Market, by Country, 2022 Vs 2030 (in%)
14.3.2. GCC Countries
14.3.2.1. GCC Countries Online Advertising Market Estimates and Forecast, 2017-2030 (US$ Bn)
14.3.2.2. GCC Countries Smart Shopping Cart, By Format, 2017-2030 (US$ Bn)
14.3.2.3. GCC Countries Smart Shopping Cart, By Vertical, 2017-2030 (US$ Bn)
14.3.3. South Africa
14.3.3.1. South Africa Online Advertising Market Estimates and Forecast, 2017-2030 (US$ Bn)
14.3.3.2. South Africa Smart Shopping Cart, By Format, 2017-2030 (US$ Bn)
14.3.3.3. South Africa Smart Shopping Cart, By Vertical, 2017-2030 (US$ Bn)
14.3.4. Rest of Middle East and Africa
14.3.4.1. Rest of Middle East and Africa Online Advertising Market Estimates and Forecast, 2017-2030 (US$ Bn)
14.3.4.2. Rest of Middle East and Africa Smart Shopping Cart, By Format, 2017-2030 (US$ Bn)
14.3.4.3. Rest of Middle East and Africa Smart Shopping Cart, By Vertical, 2017-2030 (US$ Bn)

15. Company Profiles
15.1. Amazon.Com, Inc
15.1.1. Company Overview
15.1.2. Products/Services Portfolio
15.1.3. Geographical Presence
15.1.4. Financial Summary
15.1.4.1. Market Revenue and Net Profit (2019-2022)
15.1.4.2. Business Segment Revenue Analysis
15.1.4.3. Geographical Revenue Analysis
15.2. Aol, Inc
15.3. Baidu
15.4. Facebook
15.5. Google
15.6. IAC
15.7. Linkedin
15.8. Microsoft
15.9. Twitter
15.10. Yahoo

List of Figures
FIG. 1 Online Advertising Market: Research Methodology
FIG. 2 Market Size Estimation – Top Down & Bottom up Approach
FIG. 3 Online Advertising Market Segmentation
FIG. 4 Online Advertising Market, by Format, 2022 (US$ Bn)
FIG. 5 Online Advertising Market, by Vertical, 2022 (US$ Bn)
FIG. 6 Online Advertising Market, by Geography, 2022 (US$ Bn)
FIG. 7 Attractive Investment Proposition, by Format, 2022
FIG. 8 Attractive Investment Proposition, by Vertical, 2022
FIG. 9 Attractive Investment Proposition, by Geography, 2022
FIG. 10 Global Market Share Analysis of Key Online Advertising Market Manufacturers, 2022
FIG. 11 Global Market Positioning of Key Online Advertising Market Manufacturers, 2022
FIG. 12 Online Advertising Market Value Contribution, By Format, 2022 & 2030 (Value %)
FIG. 13 Online Advertising Market, by Search Engine Marketing, Value, 2017-2030 (US$ Bn)
FIG. 14 Online Advertising Market, by Display Advertising, Value, 2017-2030 (US$ Bn)
FIG. 15 Online Advertising Market, by Classified, Value, 2017-2030 (US$ Bn)
FIG. 16 Online Advertising Market, by Mobile, Value, 2017-2030 (US$ Bn)
FIG. 17 Online Advertising Market, by Digital Video, Value, 2017-2030 (US$ Bn)
FIG. 18 Online Advertising Market, by Lead Generation, Value, 2017-2030 (US$ Bn)
FIG. 19 Online Advertising Market, by Rich Media, Value, 2017-2030 (US$ Bn)
FIG. 20 Online Advertising Market, by Others, Value, 2017-2030 (US$ Bn)
FIG. 21 Online Advertising Market Value Contribution, By Vertical, 2022 & 2030 (Value %)
FIG. 22 Online Advertising Market, by Automotive, Value, 2017-2030 (US$ Bn)
FIG. 23 Online Advertising Market, by BFSI, 2017-2030 (US$ Bn)
FIG. 24 Online Advertising Market, by CPG, 2017-2030 (US$ Bn)
FIG. 25 Online Advertising Market, by Education, 2017-2030 (US$ Bn)
FIG. 26 Online Advertising Market, by Healthcare, 2017-2030 (US$ Bn)
FIG. 27 Online Advertising Market, by Industrial, 2017-2030 (US$ Bn)
FIG. 28 Online Advertising Market, by Media and Entertainment, 2017-2030 (US$ Bn)
FIG. 29 Online Advertising Market, by Retail, 2017-2030 (US$ Bn)
FIG. 30 Online Advertising Market, by Telecommunication and Information Technology-Enabled Services (ITES), 2017-2030 (US$ Bn)
FIG. 31 Online Advertising Market, by Transport and Telecom, 2017-2030 (US$ Bn)
FIG. 32 Online Advertising Market, by Others, 2017-2030 (US$ Bn)
FIG. 33 North America Online Advertising Market, 2017-2030 (US$ Bn)
FIG. 34 U.S. Online Advertising Market, 2017-2030 (US$ Bn)
FIG. 35 Canada Online Advertising Market, 2017-2030 (US$ Bn)
FIG. 36 Europe Online Advertising Market, 2017-2030 (US$ Bn)
FIG. 37 Germany Online Advertising Market, 2017-2030 (US$ Bn)
FIG. 38 France Online Advertising Market, 2017-2030 (US$ Bn)
FIG. 39 U.K. Online Advertising Market, 2017-2030 (US$ Bn)
FIG. 40 Italy Online Advertising Market, 2017-2030 (US$ Bn)
FIG. 41 Spain Online Advertising Market, 2017-2030 (US$ Bn)
FIG. 42 Rest of Europe Online Advertising Market, 2017-2030 (US$ Bn)
FIG. 43 Asia Pacific Online Advertising Market, 2017-2030 (US$ Bn)
FIG. 44 China Online Advertising Market, 2017-2030 (US$ Bn)
FIG. 45 Japan Online Advertising Market, 2017-2030 (US$ Bn)
FIG. 46 India Online Advertising Market, 2017-2030 (US$ Bn)
FIG. 47 South Korea Online Advertising Market, 2017-2030 (US$ Bn)
FIG. 48 South-East Asia Online Advertising Market, 2017-2030 (US$ Bn)
FIG. 49 Rest of Asia Pacific Online Advertising Market, 2017-2030 (US$ Bn)
FIG. 50 Latin America Online Advertising Market, 2017-2030 (US$ Bn)
FIG. 51 Brazil Online Advertising Market, 2017-2030 (US$ Bn)
FIG. 52 Mexico Online Advertising Market, 2017-2030 (US$ Bn)
FIG. 53 Rest of Latin America Online Advertising Market, 2017-2030 (US$ Bn)
FIG. 54 Middle East & Africa Online Advertising Market, 2017-2030 (US$ Bn)
FIG. 55 GCC Countries Online Advertising Market, 2017-2030 (US$ Bn)
FIG. 56 South Africa Online Advertising Market, 2017-2030 (US$ Bn)
FIG. 57 Rest of Middle East and Africa Online Advertising Market, 2017-2030 (US$ Bn)

List of Tables
TABLE 1 Market Snapshot: Online Advertising Market
TABLE 2 Online Advertising Market: Market Drivers Impact Analysis
TABLE 3 Online Advertising Market: Market Restraints Impact Analysis
TABLE 4 Online Advertising Market, by Competitive Benchmarking, 2022
TABLE 5 Online Advertising Market, by Geographical Presence Analysis, 2022
TABLE 6 Online Advertising Market, by Key Strategies Analysis, 2022
TABLE 7 Online Advertising Market, by Barcodes, By Region, 2017-2022 (US$ Bn)
TABLE 8 Online Advertising Market, by Barcodes, By Region, 2023-2030 (US$ Bn)
TABLE 9 Online Advertising Market, by Display Advertising, By Region, 2017-2022 (US$ Bn)
TABLE 10 Online Advertising Market, by Display Advertising, By Region, 2023-2030 (US$ Bn)
TABLE 11 Online Advertising Market, by Classified, By Region, 2017-2022 (US$ Bn)
TABLE 12 Online Advertising Market, by Classified, By Region, 2023-2030 (US$ Bn)
TABLE 13 Online Advertising Market, by Display Mobile, By Region, 2017-2022 (US$ Bn)
TABLE 14 Online Advertising Market, by Display Mobile, By Region, 2023-2030 (US$ Bn)
TABLE 15 Online Advertising Market, by Digital Video, By Region, 2017-2022 (US$ Bn)
TABLE 16 Online Advertising Market, by Digital Video, By Region, 2023-2030 (US$ Bn)
TABLE 17 Online Advertising Market, by Lead Generation, By Region, 2017-2022 (US$ Bn)
TABLE 18 Online Advertising Market, by Lead Generation, By Region, 2023-2030 (US$ Bn)
TABLE 19 Online Advertising Market, by Rich Media, By Region, 2017-2022 (US$ Bn)
TABLE 20 Online Advertising Market, by Rich Media, By Region, 2023-2030 (US$ Bn)
TABLE 21 Online Advertising Market, by Others, By Region, 2017-2022 (US$ Bn)
TABLE 22 Online Advertising Market, Others, By Region, 2023-2030 (US$ Bn)
TABLE 23 Online Advertising Market, by Automotive, By Region, 2017-2022 (US$ Bn)
TABLE 24 Online Advertising Market, by Automotive, By Region, 2023-2030 (US$ Bn)
TABLE 25 Online Advertising Market, by BFSI, By Region, 2017-2022 (US$ Bn)
TABLE 26 Online Advertising Market, by BFSI, By Region, 2023-2030 (US$ Bn)
TABLE 27 Online Advertising Market, by CPG, By Region, 2017-2022 (US$ Bn)
TABLE 28 Online Advertising Market, by CPG, By Region, 2023-2030 (US$ Bn)
TABLE 29 Online Advertising Market, by Education, By Region, 2017-2022 (US$ Bn)
TABLE 30 Online Advertising Market, by Education, By Region, 2023-2030 (US$ Bn)
TABLE 31 Online Advertising Market, by Healthcare, By Region, 2017-2022 (US$ Bn)
TABLE 32 Online Advertising Market, by Healthcare, By Region, 2023-2030 (US$ Bn)
TABLE 33 Online Advertising Market, by Industrial, By Region, 2017-2022 (US$ Bn)
TABLE 34 Online Advertising Market, by Industrial, By Region, 2023-2030 (US$ Bn)
TABLE 35 Online Advertising Market, by Media and Entertainment, By Region, 2017-2022 (US$ Bn)
TABLE 36 Online Advertising Market, by Media and Entertainment, By Region, 2023-2030 (US$ Bn)
TABLE 37 Online Advertising Market, by Retail, By Region, 2017-2022 (US$ Bn)
TABLE 38 Online Advertising Market, by Retail, By Region, 2023-2030 (US$ Bn)
TABLE 39 Online Advertising Market, by Telecommunication and Information Technology-Enabled Services (ITES), By Region, 2017-2022 (US$ Bn)
TABLE 40 Online Advertising Market, by Telecommunication and Information Technology-Enabled Services (ITES), By Region, 2023-2030 (US$ Bn)
TABLE 41 Online Advertising Market, by Transport and Telecom, By Region, 2017-2022 (US$ Bn)
TABLE 42 Online Advertising Market, by Transport and Telecom, By Region, 2023-2030 (US$ Bn)
TABLE 43 Online Advertising Market, by Others, By Region, 2017-2022 (US$ Bn)
TABLE 44 Online Advertising Market, by Others, By Region, 2023-2030 (US$ Bn)
TABLE 45 Online Advertising Market, by Format, 2017-2022 (US$ Bn)
TABLE 46 Online Advertising Market, by Format, 2023-2030 (US$ Bn)
TABLE 47 Online Advertising Market, by Vertical, 2017-2022 (US$ Bn)
TABLE 48 Online Advertising Market, by Vertical, 2023-2030 (US$ Bn)
TABLE 49 Online Advertising Market, by Region, 2017-2022 (US$ Bn)
TABLE 50 Online Advertising Market, by Region, 2023-2030 (US$ Bn)
TABLE 51 North America Online Advertising Market, by Format, 2017-2022 (US$ Bn)
TABLE 52 North America Online Advertising Market, by Format, 2023-2030 (US$ Bn)
TABLE 53 North America Online Advertising Market, by Vertical, 2017-2022 (US$ Bn)
TABLE 54 North America Online Advertising Market, by Vertical, 2023-2030 (US$ Bn)
TABLE 55 North America Online Advertising Market, by Country, 2017-2022 (US$ Bn)
TABLE 56 North America Online Advertising Market, by Country, 2023-2030 (US$ Bn)
TABLE 57 United States Online Advertising Market, by Format, 2017-2022 (US$ Bn)
TABLE 58 United States Online Advertising Market, by Format, 2023-2030 (US$ Bn)
TABLE 59 United States Online Advertising Market, by Vertical, 2017-2022 (US$ Bn)
TABLE 60 United States Online Advertising Market, by Vertical, 2023-2030 (US$ Bn)
TABLE 61 Canada Online Advertising Market, by Format, 2017-2022 (US$ Bn)
TABLE 62 Canada Online Advertising Market, by Format, 2023-2030 (US$ Bn)
TABLE 63 Canada Online Advertising Market, by Vertical, 2017-2022 (US$ Bn)
TABLE 64 Canada Online Advertising Market, by Vertical, 2023-2030 (US$ Bn)
TABLE 65 Mexico Online Advertising Market, by Format, 2017-2022 (US$ Bn)
TABLE 66 Mexico Online Advertising Market, by Format, 2023-2030 (US$ Bn)
TABLE 67 Mexico Online Advertising Market, by Vertical, 2017-2022 (US$ Bn)
TABLE 68 Mexico Online Advertising Market, by Vertical, 2023-2030 (US$ Bn)
TABLE 69 Europe Online Advertising Market, by Format, 2017-2022 (US$ Bn)
TABLE 70 Europe Online Advertising Market, by Format, 2023-2030 (US$ Bn)
TABLE 71 Europe Online Advertising Market, by Vertical, 2017-2022 (US$ Bn)
TABLE 72 Europe Online Advertising Market, by Vertical, 2023-2030 (US$ Bn)
TABLE 73 Europe Online Advertising Market, by Country, 2017-2022 (US$ Bn)
TABLE 74 Europe Online Advertising Market, by Country, 2023-2030 (US$ Bn)
TABLE 75 Germany Online Advertising Market, by Format, 2017-2022 (US$ Bn)
TABLE 76 Germany Online Advertising Market, by Format, 2023-2030 (US$ Bn)
TABLE 77 Germany Online Advertising Market, by Vertical, 2017-2022 (US$ Bn)
TABLE 78 Germany Online Advertising Market, by Vertical, 2023-2030 (US$ Bn)
TABLE 79 France Online Advertising Market, by Format, 2017-2022 (US$ Bn)
TABLE 80 France Online Advertising Market, by Format, 2023-2030 (US$ Bn)
TABLE 81 France Online Advertising Market, by Vertical, 2017-2022 (US$ Bn)
TABLE 82 France Online Advertising Market, by Vertical, 2023-2030 (US$ Bn)
TABLE 83 United Kingdom Online Advertising Market, by Format, 2017-2022 (US$ Bn)
TABLE 84 United Kingdom Online Advertising Market, by Format, 2023-2030 (US$ Bn)
TABLE 85 United Kingdom Online Advertising Market, by Vertical, 2017-2022 (US$ Bn)
TABLE 86 United Kingdom Online Advertising Market, by Vertical, 2023-2030 (US$ Bn)
TABLE 87 Italy Online Advertising Market, by Format, 2017-2022 (US$ Bn)
TABLE 88 Italy Online Advertising Market, by Format, 2023-2030 (US$ Bn)
TABLE 89 Italy Online Advertising Market, by Vertical, 2017-2022 (US$ Bn)
TABLE 90 Italy Online Advertising Market, by Vertical, 2023-2030 (US$ Bn)
TABLE 91 Spain Online Advertising Market, by Format, 2017-2022 (US$ Bn)
TABLE 92 Spain Online Advertising Market, by Format, 2023-2030 (US$ Bn)
TABLE 93 Spain Online Advertising Market, by Vertical, 2017-2022 (US$ Bn)
TABLE 94 Spain Online Advertising Market, by Vertical, 2023-2030 (US$ Bn)
TABLE 95 Rest of Europe Online Advertising Market, by Format, 2017-2022 (US$ Bn)
TABLE 96 Rest of Europe Online Advertising Market, by Format, 2023-2030 (US$ Bn)
TABLE 97 Rest of Europe Online Advertising Market, by Vertical, 2017-2022 (US$ Bn)
TABLE 98 Rest of Europe Online Advertising Market, by Vertical, 2023-2030 (US$ Bn)
TABLE 99 Asia Pacific Online Advertising Market, by Format, 2017-2022 (US$ Bn)
TABLE 100 Asia Pacific Online Advertising Market, by Format, 2023-2030 (US$ Bn)
TABLE 101 Asia Pacific Online Advertising Market, by Vertical, 2017-2022 (US$ Bn)
TABLE 102 Asia Pacific Online Advertising Market, by Vertical, 2023-2030 (US$ Bn)
TABLE 103 China Online Advertising Market, by Format, 2017-2022 (US$ Bn)
TABLE 104 China Online Advertising Market, by Format, 2023-2030 (US$ Bn)
TABLE 105 China Online Advertising Market, by Vertical, 2017-2022 (US$ Bn)
TABLE 106 China Online Advertising Market, by Vertical, 2023-2030 (US$ Bn)
TABLE 107 Japan Online Advertising Market, by Format, 2017-2022 (US$ Bn)
TABLE 108 Japan Online Advertising Market, by Format, 2023-2030 (US$ Bn)
TABLE 109 Japan Online Advertising Market, by Vertical, 2017-2022 (US$ Bn)
TABLE 110 Japan Online Advertising Market, by Vertical, 2023-2030 (US$ Bn)
TABLE 111 India Online Advertising Market, by Format, 2017-2022 (US$ Bn)
TABLE 112 India Online Advertising Market, by Format, 2023-2030 (US$ Bn)
TABLE 113 India Online Advertising Market, by Vertical, 2017-2022 (US$ Bn)
TABLE 114 India Online Advertising Market, by Vertical, 2023-2030 (US$ Bn)
TABLE 115 South Korea Online Advertising Market, by Format, 2017-2022 (US$ Bn)
TABLE 116 South Korea Online Advertising Market, by Format, 2023-2030 (US$ Bn)
TABLE 117 South Korea Online Advertising Market, by Vertical, 2017-2022 (US$ Bn)
TABLE 118 South Korea Online Advertising Market, by Vertical, 2023-2030 (US$ Bn)
TABLE 119 South-East Asia Online Advertising Market, by Format, 2017-2022 (US$ Bn)
TABLE 120 South-East Asia Online Advertising Market, by Format, 2023-2030 (US$ Bn)
TABLE 121 South-East Asia Online Advertising Market, by Vertical, 2017-2022 (US$ Bn)
TABLE 122 South-East Asia Online Advertising Market, by Vertical, 2023-2030 (US$ Bn)
TABLE 123 Rest of Asia Pacific Online Advertising Market, by Format, 2017-2022 (US$ Bn)
TABLE 124 Rest of Asia Pacific Online Advertising Market, by Format, 2023-2030 (US$ Bn)
TABLE 125 Rest of Asia Pacific Online Advertising Market, by Vertical, 2017-2022 (US$ Bn)
TABLE 126 Rest of Asia Pacific Online Advertising Market, by Vertical, 2023-2030 (US$ Bn)
TABLE 127 Latin America Online Advertising Market, by Format, 2017-2022 (US$ Bn)
TABLE 128 Latin America Online Advertising Market, by Format, 2023-2030 (US$ Bn)
TABLE 129 Latin America Online Advertising Market, by Vertical, 2017-2022 (US$ Bn)
TABLE 130 Latin America Online Advertising Market, by Vertical, 2023-2030 (US$ Bn)
TABLE 131 Brazil Online Advertising Market, by Format, 2017-2022 (US$ Bn)
TABLE 132 Brazil Online Advertising Market, by Format, 2023-2030 (US$ Bn)
TABLE 133 Brazil Online Advertising Market, by Vertical, 2017-2022 (US$ Bn)
TABLE 134 Brazil Online Advertising Market, by Vertical, 2023-2030 (US$ Bn)
TABLE 135 Argentina Online Advertising Market, by Format, 2017-2022 (US$ Bn)
TABLE 136 Argentina Online Advertising Market, by Format, 2023-2030 (US$ Bn)
TABLE 137 Argentina Online Advertising Market, by Vertical, 2017-2022 (US$ Bn)
TABLE 138 Argentina Online Advertising Market, by Vertical, 2023-2030 (US$ Bn)
TABLE 139 Rest of Latin America Online Advertising Market, by Format, 2017-2022 (US$ Bn)
TABLE 140 Rest of Latin America Online Advertising Market, by Format, 2023-2030 (US$ Bn)
TABLE 141 Rest of Latin America Online Advertising Market, by Vertical, 2017-2022 (US$ Bn)
TABLE 142 Rest of Latin America Online Advertising Market, by Vertical, 2023-2030 (US$ Bn)
TABLE 143 Middle East and Africa Online Advertising Market, by Format, 2017-2022 (US$ Bn)
TABLE 144 Middle East and Africa Online Advertising Market, by Format, 2023-2030 (US$ Bn)
TABLE 145 Middle East and Africa Online Advertising Market, by Vertical, 2017-2022 (US$ Bn)
TABLE 146 Middle East and Africa Online Advertising Market, by Vertical, 2023-2030 (US$ Bn)
TABLE 147 GCC Countries Online Advertising Market, by Format, 2017-2022 (US$ Bn)
TABLE 148 GCC Countries Online Advertising Market, by Format, 2023-2030 (US$ Bn)
TABLE 149 GCC Countries Online Advertising Market, by Vertical, 2017-2022 (US$ Bn)
TABLE 150 GCC Countries Online Advertising Market, by Vertical, 2023-2030 (US$ Bn)
TABLE 151 South Africa Online Advertising Market, by Format, 2017-2022 (US$ Bn)
TABLE 152 South Africa Online Advertising Market, by Format, 2023-2030 (US$ Bn)
TABLE 153 South Africa Online Advertising Market, by Vertical, 2017-2022 (US$ Bn)
TABLE 154 South Africa Online Advertising Market, by Vertical, 2023-2030 (US$ Bn)
TABLE 155 Rest of Middle East and Africa Online Advertising Market, by Format, 2017-2022 (US$ Bn)
TABLE 156 Rest of Middle East and Africa Online Advertising Market, by Format, 2023-2030 (US$ Bn)
TABLE 157 Rest of Middle East and Africa Online Advertising Market, by Vertical, 2017-2022 (US$ Bn)
TABLE 158 Rest of Middle East and Africa Online Advertising Market, by Vertical, 2023-2030 (US$ Bn)

Frequently Asked Questions

What is the current size of the global online advertising market?

The global online advertising market was valued at USD 215.9 Billion in 2022.

What is the expected growth rate of the online advertising market between 2023 and 2030?

The online advertising market is expected to grow at a CAGR of 11.50% between 2023 and 2030, reaching USD 462.569 Billion in 2030.

Which segment is leading the market share in terms of format?

Search Engine Marketing is the leading segment by format, holding over 43% share in value in 2022.

Which vertical segment governs the demand for online advertising worldwide?

The automotive segment governs the demand for online advertising worldwide, holding a massive share of over 80% in 2022.

Which segment is expected to post the highest CAGR during the forecast period?

The BFSI segment will post the highest CAGR during the forecast period.

Which region is fueling the growth of the online advertising industry?

Asia Pacific is fueling the growth of the online advertising industry, with over one-third share in 2022.

Who are the major players in the global online advertising market?

The top players include Aol, Inc, Baidu, Facebook, Google, IAC, Linkedin, Microsoft, and Twitter.

What are the major market drivers of the online advertising industry?

The rising use of mobile devices is the major market driver.

What are the major market restraints of the online advertising industry?

The rising concern over data privacy and online tracking is major market restraint.

What are the major market opportunities in the online advertising industry?

Mobile advertising has become a significant major opportunities in the online advertising industry.

Supervisory Control and Data Acquisition (SCADA) Market

Published:
Report ID: 10131

India CCTV Camera Market

Published:
Report ID: 37170

Simulation Software Market

Published:
Report ID: 36908

Bioinformatics Market

Published:
Report ID: 14530

Fish Hook Sensor Market

Published:
Report ID: 36774

Big Data Services Market

Published:
Report ID: 3020

Saudi Arabia Managed Security Services Market

Published:
Report ID: 36393

Microwave Oven Market

Published:
Report ID: 36314

Inkjet Coders Market

Published:
Report ID: 6669

Rich Communication Services Market

Published:
Report ID: 35774

Middle East and Africa Real-Time Payments Market

Published:
Report ID: 35770

Vietnam Managed Security Services (MSS) Market

Published:
Report ID: 35766

Purchase Options

$2999
Delivery Format: Excel.
$4999
Designed for the individual purchaser.
$6999
Users located at a single corporate site or regional office.
$7999
Allowed for unlimited sharing globally within one company.
Smallform of Sample request

Have a question?

User Profile

Don’t settle for less – trust Mitul to help you find the best solution.

Report delivery within 24 to 48 hours

– Other Info –

What people say?-

User Review

I am very impressed with the information in this report. The author clearly did their research when they came up with this product and it has already given me a lot of ideas.

Jana Schmidt
CEDAR CX Technologies

– Connect with us –

Phone

+91 6232 49 3207


support

24/7 Research Support


sales@credenceresearch.com

– Research Methodology –

Going beyond the basics: advanced techniques in research methodology

– Trusted By –

Pepshi, LG, Nestle
Motorola, Honeywell, Johnson and johnson
LG Chem, SIEMENS, Pfizer
Unilever, Samsonite, QIAGEN