
State plastic bans turn takeaway ware toward fiber
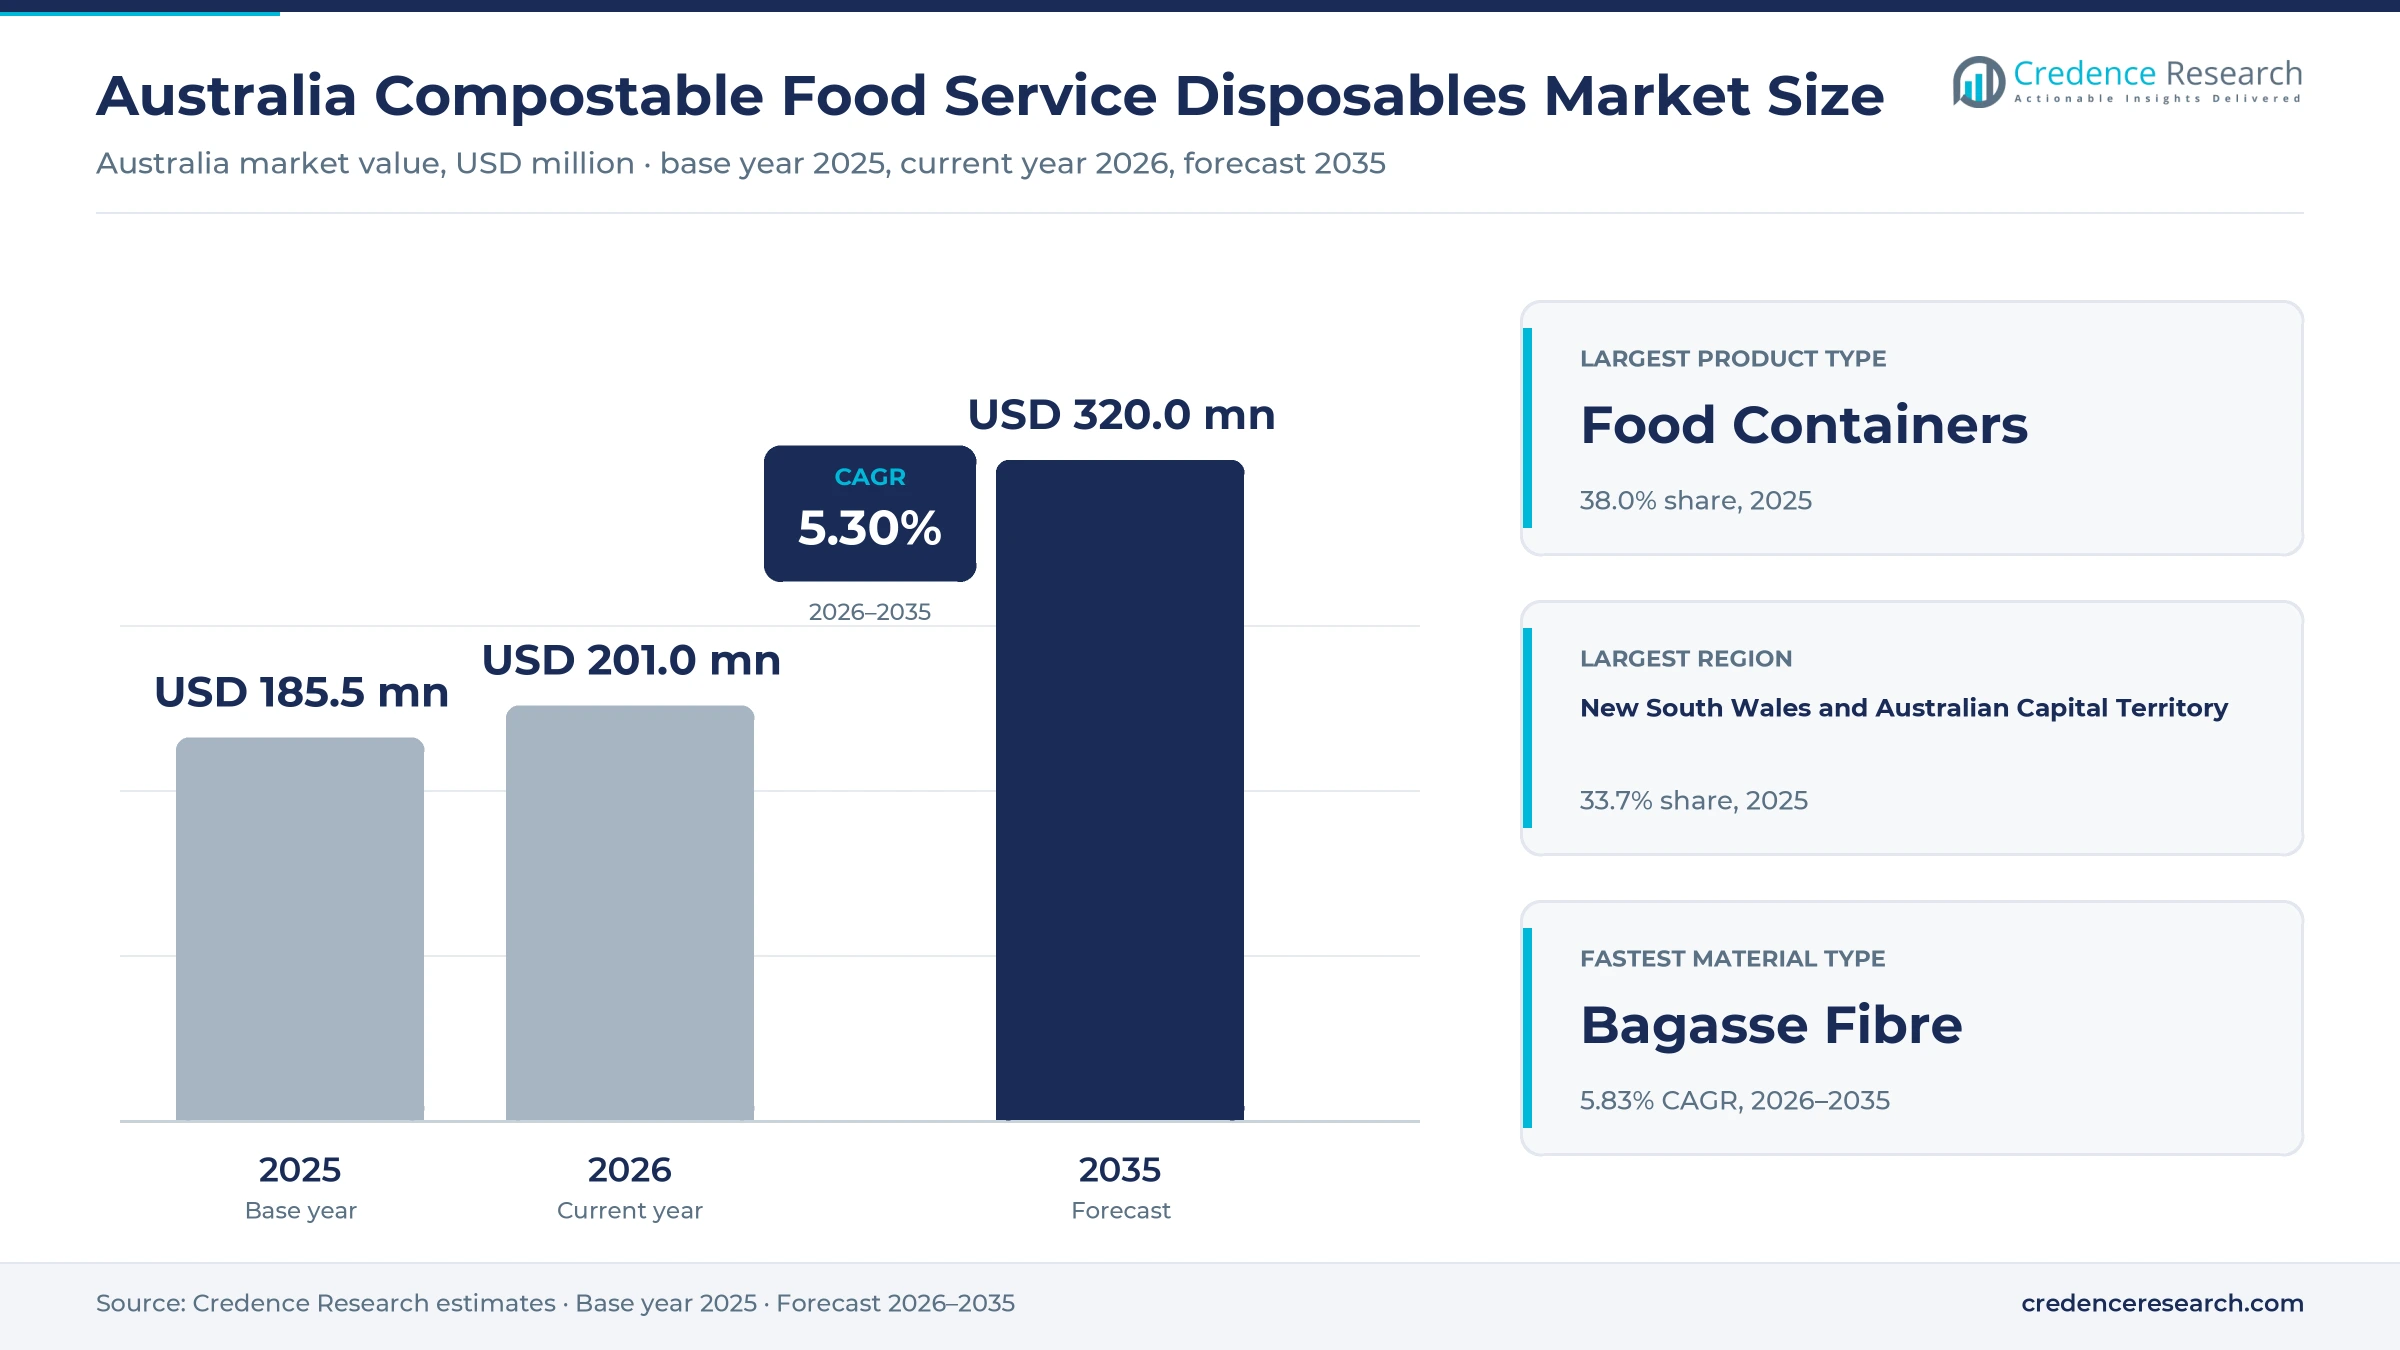
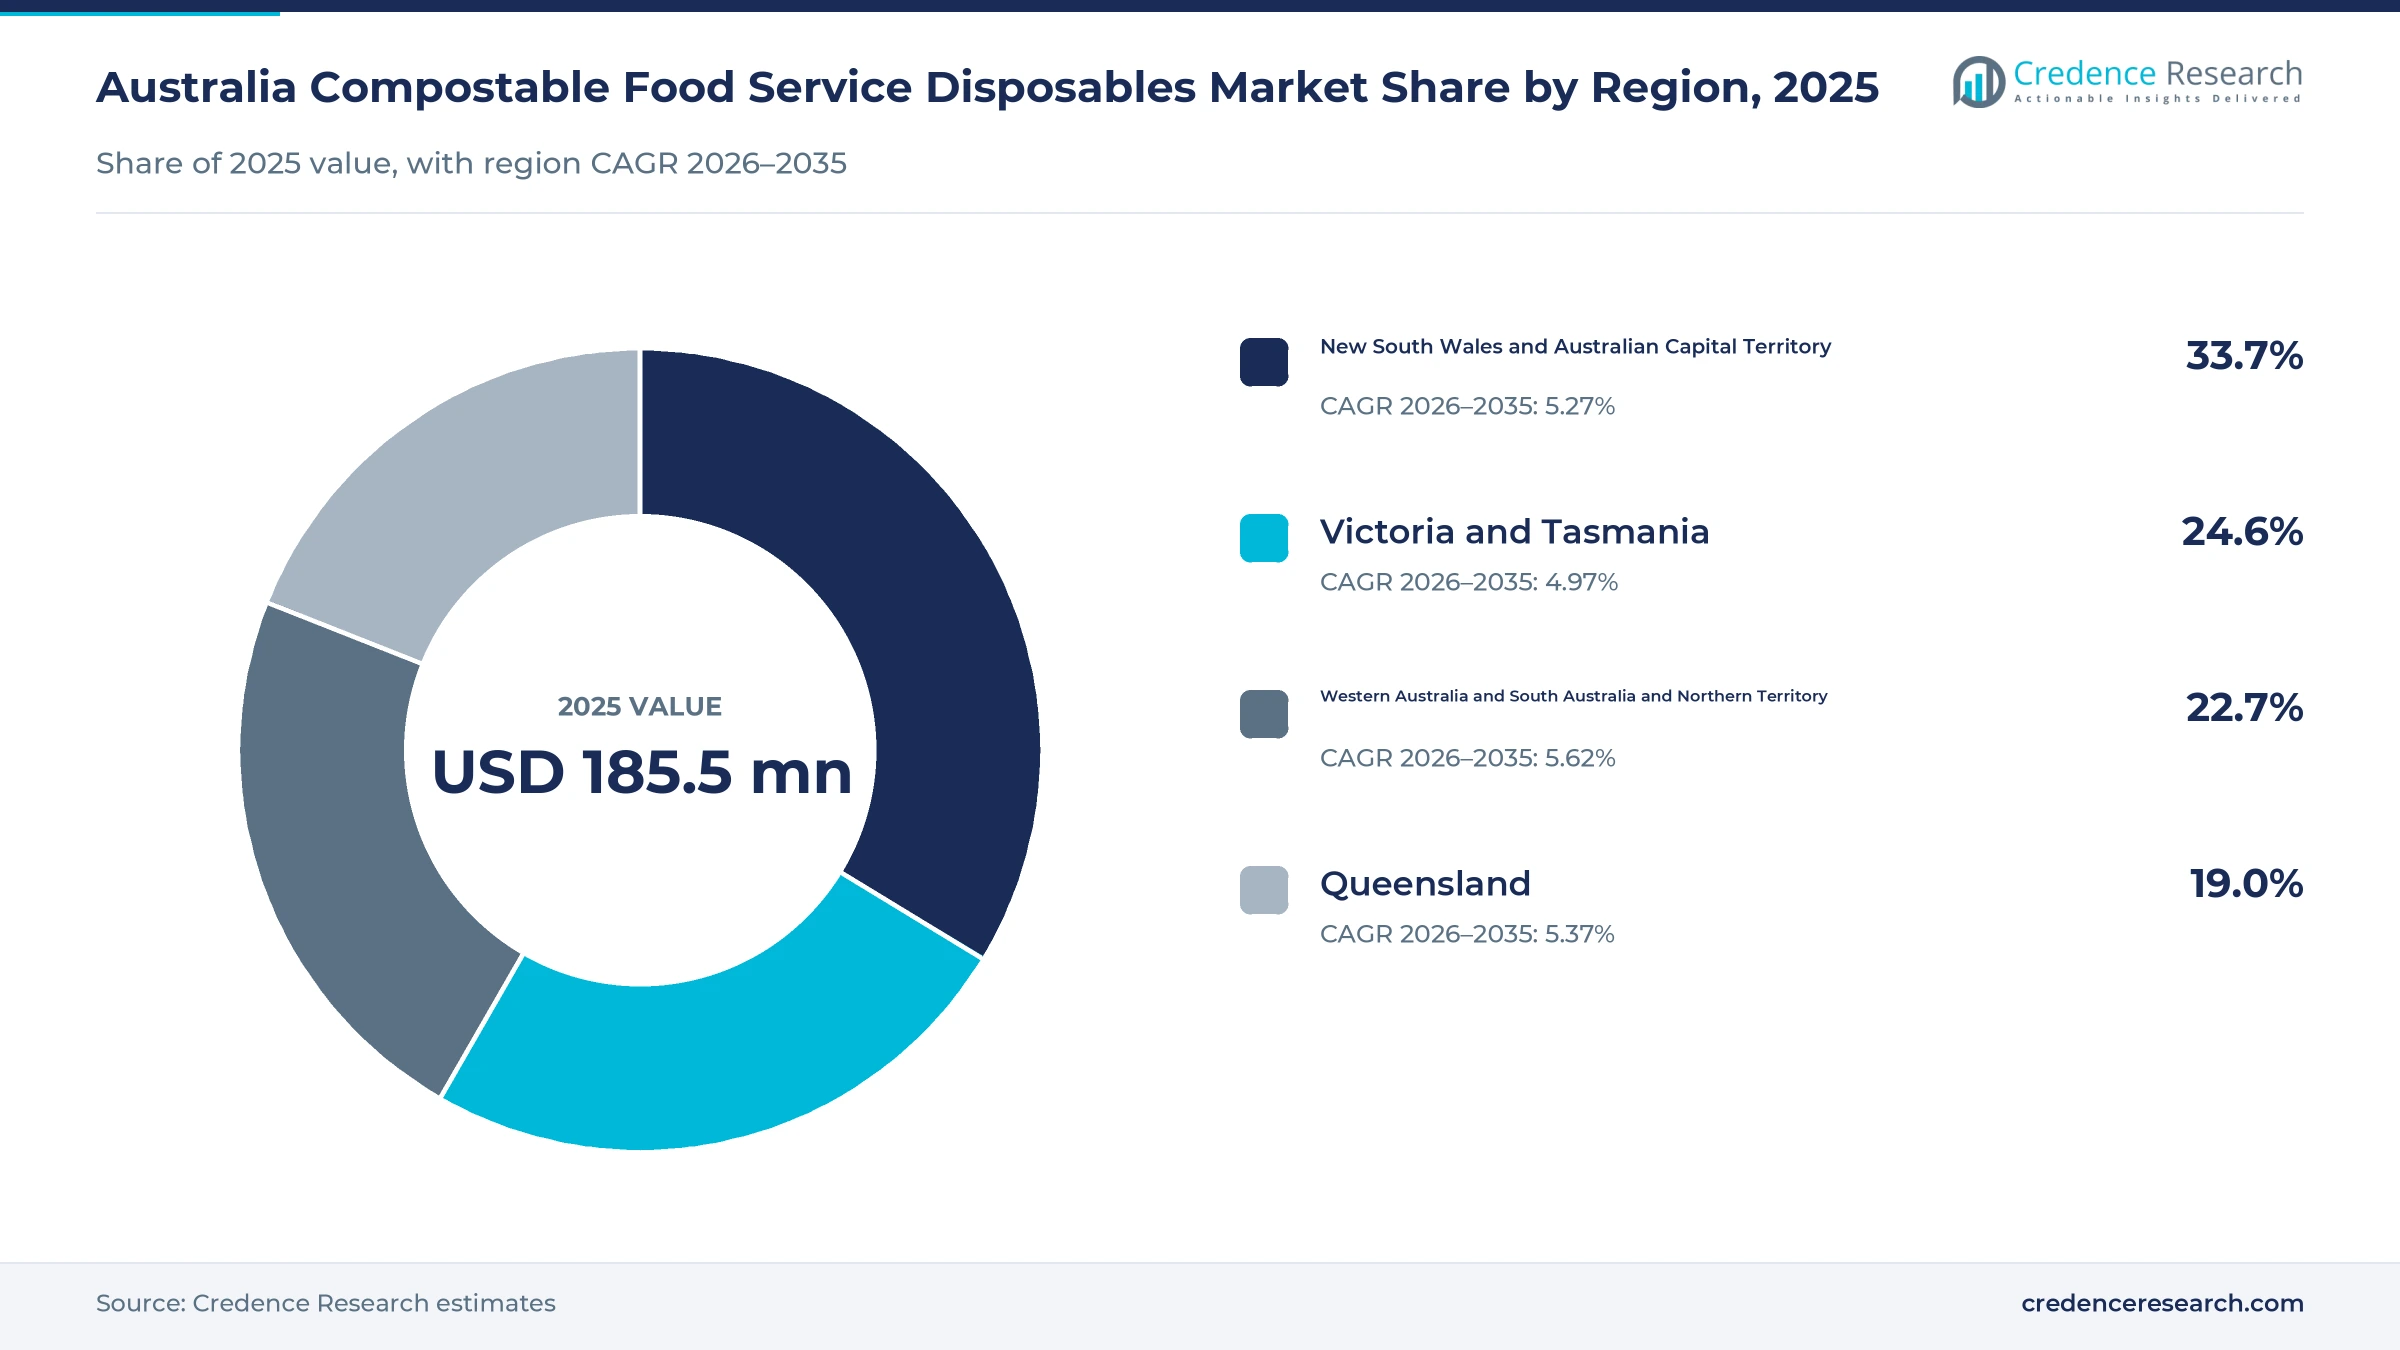
The Australia compostable food service disposables market was valued at USD 185.5 million in 2025 and is projected to increase from USD 201.0 million in 2026 to USD 320.0 million by 2035, registering a CAGR of 5.30% during 2026–2035. Demand comes from burger and chicken chains, cafés, restaurants, delivery kitchens, caterers and event operators that must replace banned plastic cups, plates, cutlery and takeaway containers. New South Wales and Australian Capital Territory held the largest regional share, 33.7% in 2025, because Sydney holds the largest concentration of food outlets and the state banned plastic plates, bowls and cutlery in November 2022. Western Australia and South Australia and Northern Territory is the fastest-growing region at 5.62% a year, as Western Australia and South Australia added cups, lids and takeaway containers to their bans in 2024. At the same time, New South Wales requires large food businesses to separate food scraps from July 2026, which gives certified compostable packaging a collection route.
Which compostable takeaway items does the estimate cover?
The estimate measures the value of single-use foodservice items sold in Australia that carry, or are sold against, a compostability claim. It counts hot and cold cups, lids and straws, clamshells, bowls, trays and containers, plates and cutlery, and compostable carry bags, napkins and caddy liners bought by food outlets, whether they order through distributors, direct contracts, supplier web stores or their own imports.
The estimate excludes reusable cups and containers, conventional plastic and recyclable-only paper items, grocery packaging filled by food manufacturers, and household bin liners sold through supermarkets. The value chain runs from pulp, board and biopolymer suppliers through local converters and importers to brand owners, wholesalers and the food outlets that hand the items to customers.
Australia Compostable Food Service Disposables Market Insights
- The Australia compostable food service disposables market was valued at USD 185.5 million in 2025 and is projected to reach USD 320.0 million by 2035, registering a CAGR of 5.30% during 2026–2035.
- New South Wales and Australian Capital Territory held a 33.7% share of 2025 value, because Sydney has the densest network of cafés and takeaway outlets in the country.
- Food containers led with a 38.0% share of 2025 value, because clamshells, bowls and trays carry most takeaway and delivery meals.
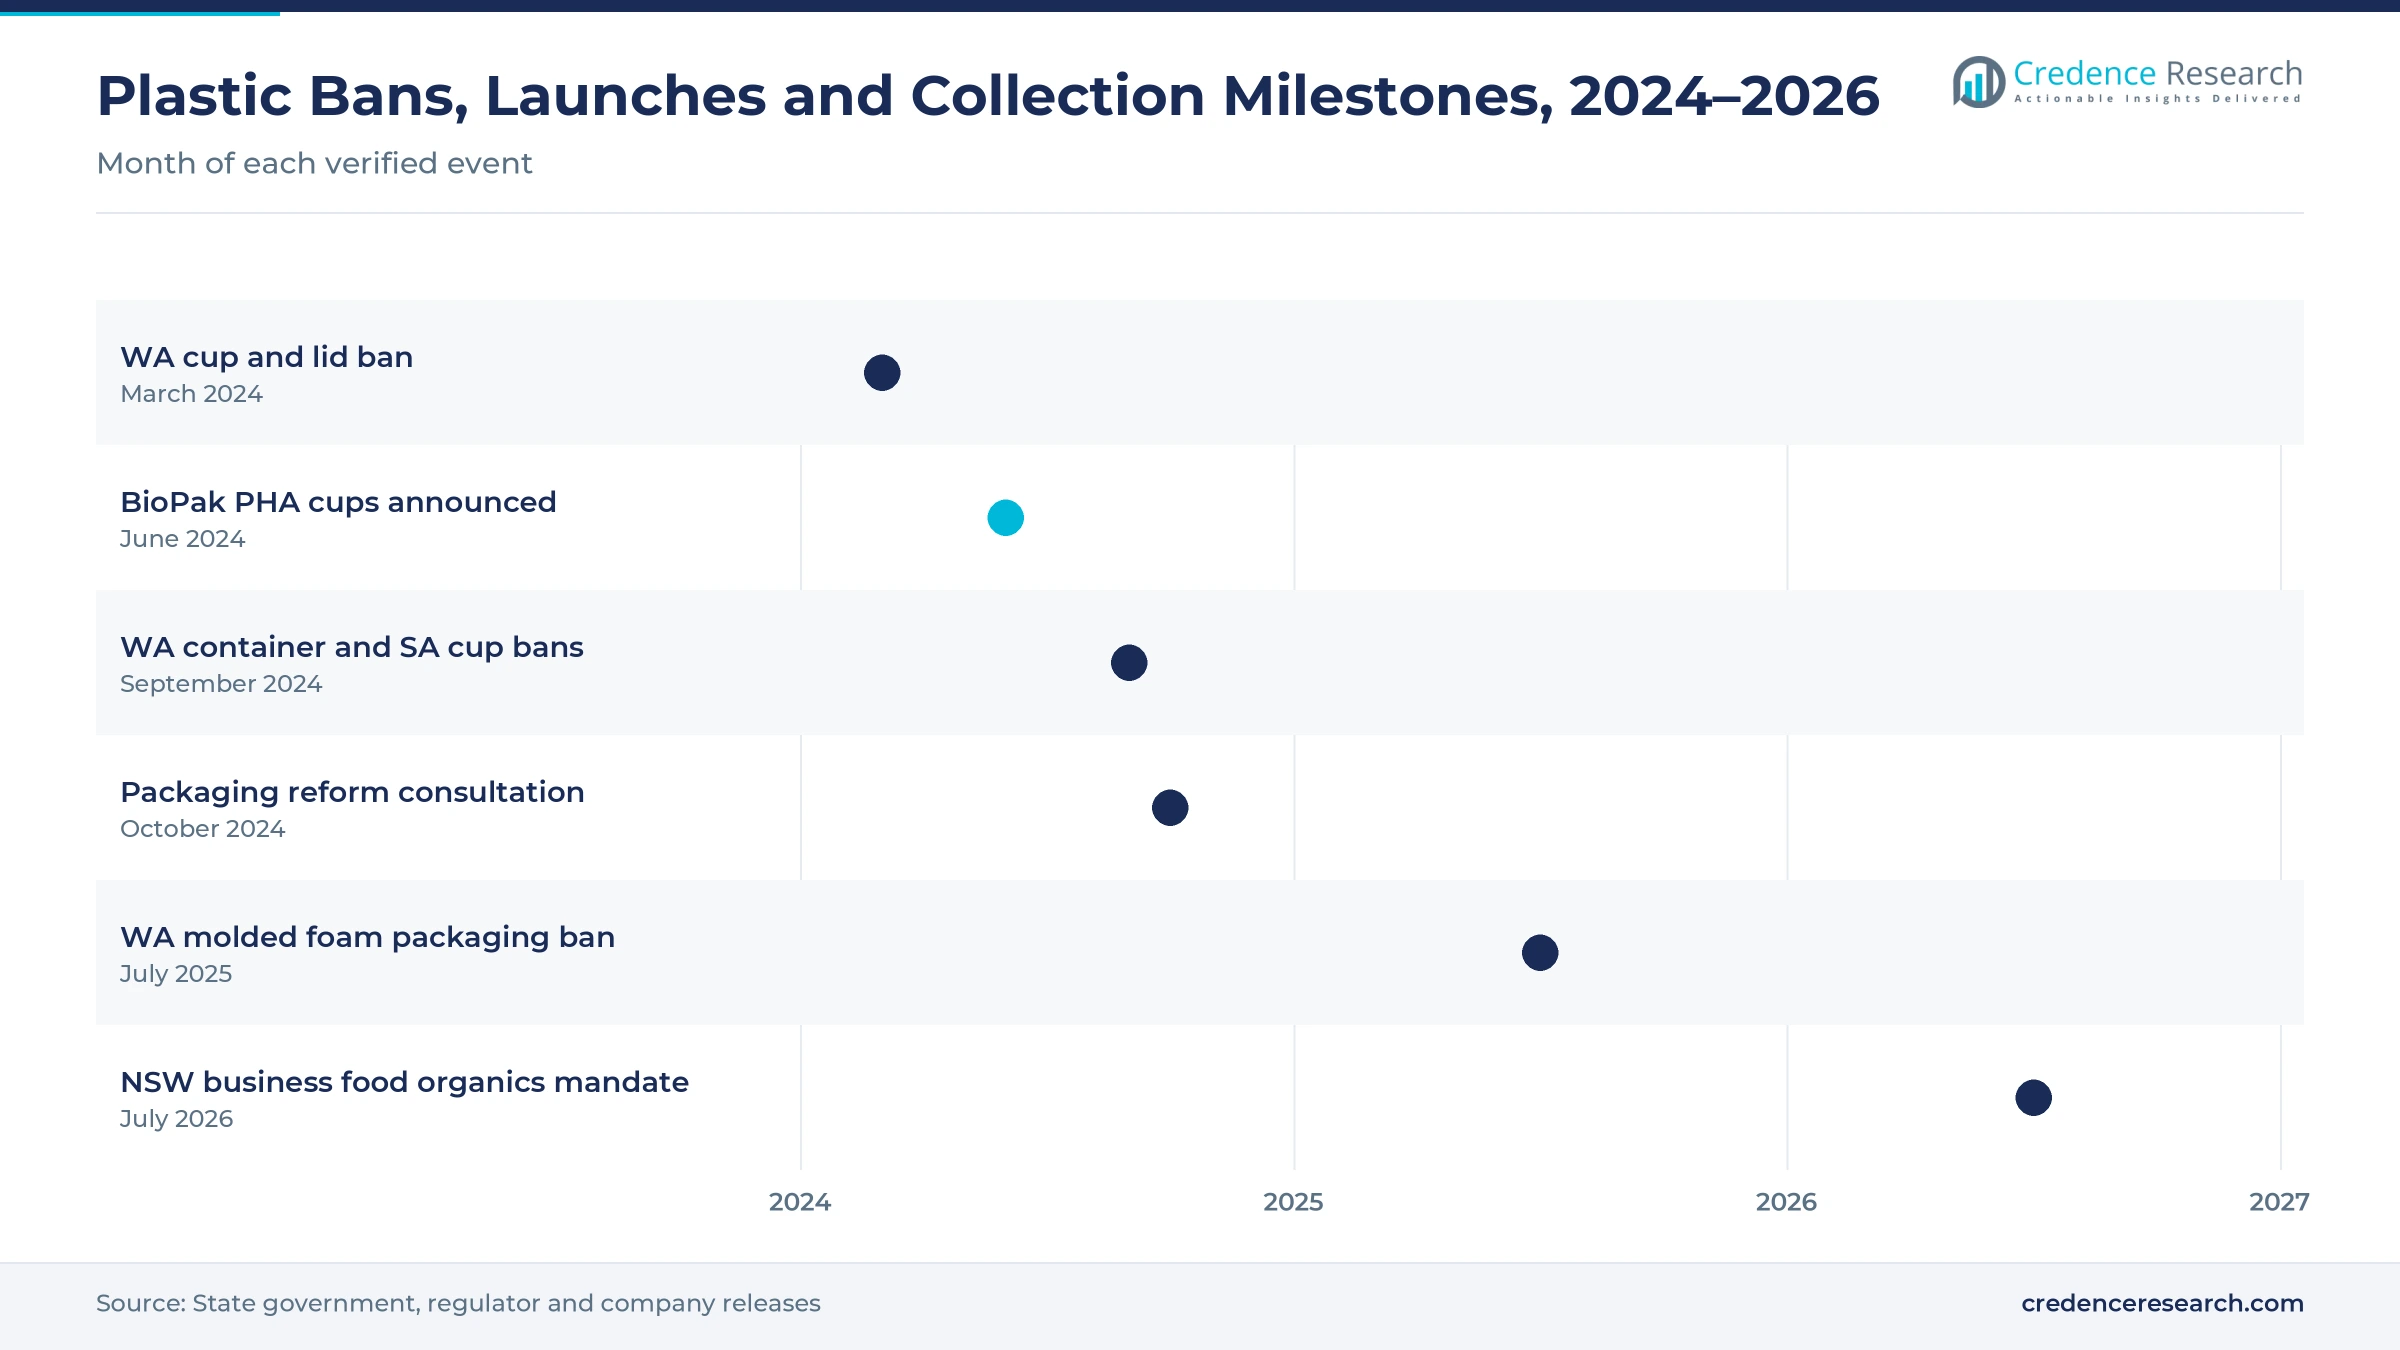
- Western Australia banned plastic coffee cups and lids from March 1, 2024 and plastic takeaway containers from Sept. 1, 2024, including most plant-based plastics.
- Supplier web stores grow fastest at 6.31% a year during 2026–2035, as small cafés order certified ranges online in smaller lots.
Food containers lead while cups and lids grow fastest
Why do food containers take the largest share?
Based on product type, the market is categorized into beverage serviceware, food containers, tableware and utensils, and bags and foodservice accessories. Food containers led with a 38.0% share of 2025 value, because molded clamshells, bowls and trays cost more per unit than cups or cutlery. Beverage serviceware grows fastest at 5.69% a year, as South Australia and Western Australia push plastic cups and lids out of cafés.
How does bagasse fibre gain on coated board?
Based on material type, the market is categorized into coated paper and card, bagasse fibre, polylactic acid materials and bamboo fibre and starch composites. Coated paper and card led with a 42.0% share of 2025 value, because lined paper cups and cartons dominate drink and fries service. Bagasse fibre grows fastest at 5.83% a year, as state bans that cover compostable plastics favor molded sugarcane pulp.
Why do quick-service chains buy the most volume?
Based on end user, the market is categorized into quick-service restaurants, cafés and coffee shops, restaurants and delivery kitchens, and contract catering and events. Quick-service restaurants led with a 34.0% share of 2025 value, because national chains buy cups, wraps and containers in large repeat contracts. Restaurants and delivery kitchens grow fastest at 5.76% a year, as delivery orders need sealed, leak-resistant fiber containers.
How do foodservice distributors reach small outlets?
Based on sales channel, the market is categorized into foodservice distributors, direct supplier contracts, supplier web stores and operator direct imports. Foodservice distributors led with a 52.0% share of 2025 value, because most independent cafés buy packaging with food and cleaning supplies on one weekly delivery. Supplier web stores grow fastest at 6.31% a year, as brand owners sell certified ranges online.
| Segment Group | Leading Sub-segment | Share, 2025 | Fastest-growing Sub-segment | CAGR, 2026–2035 |
|---|---|---|---|---|
| By Product Type | Food containers | 38.0% | Beverage serviceware | 5.69% |
| By Material Type | Coated paper and card | 42.0% | Bagasse fibre | 5.83% |
| By End User | Quick-service restaurants | 34.0% | Restaurants and delivery kitchens | 5.76% |
| By Sales Channel | Foodservice distributors | 52.0% | Supplier web stores | 6.31% |
Request a Free Sample
Fill in your details and we'll send you a free sample report.
- Sample data tables & charts
- Research methodology
Fiber swaps, repeat orders and food scrap bins lift demand
How do state bans push outlets toward certified fiber?
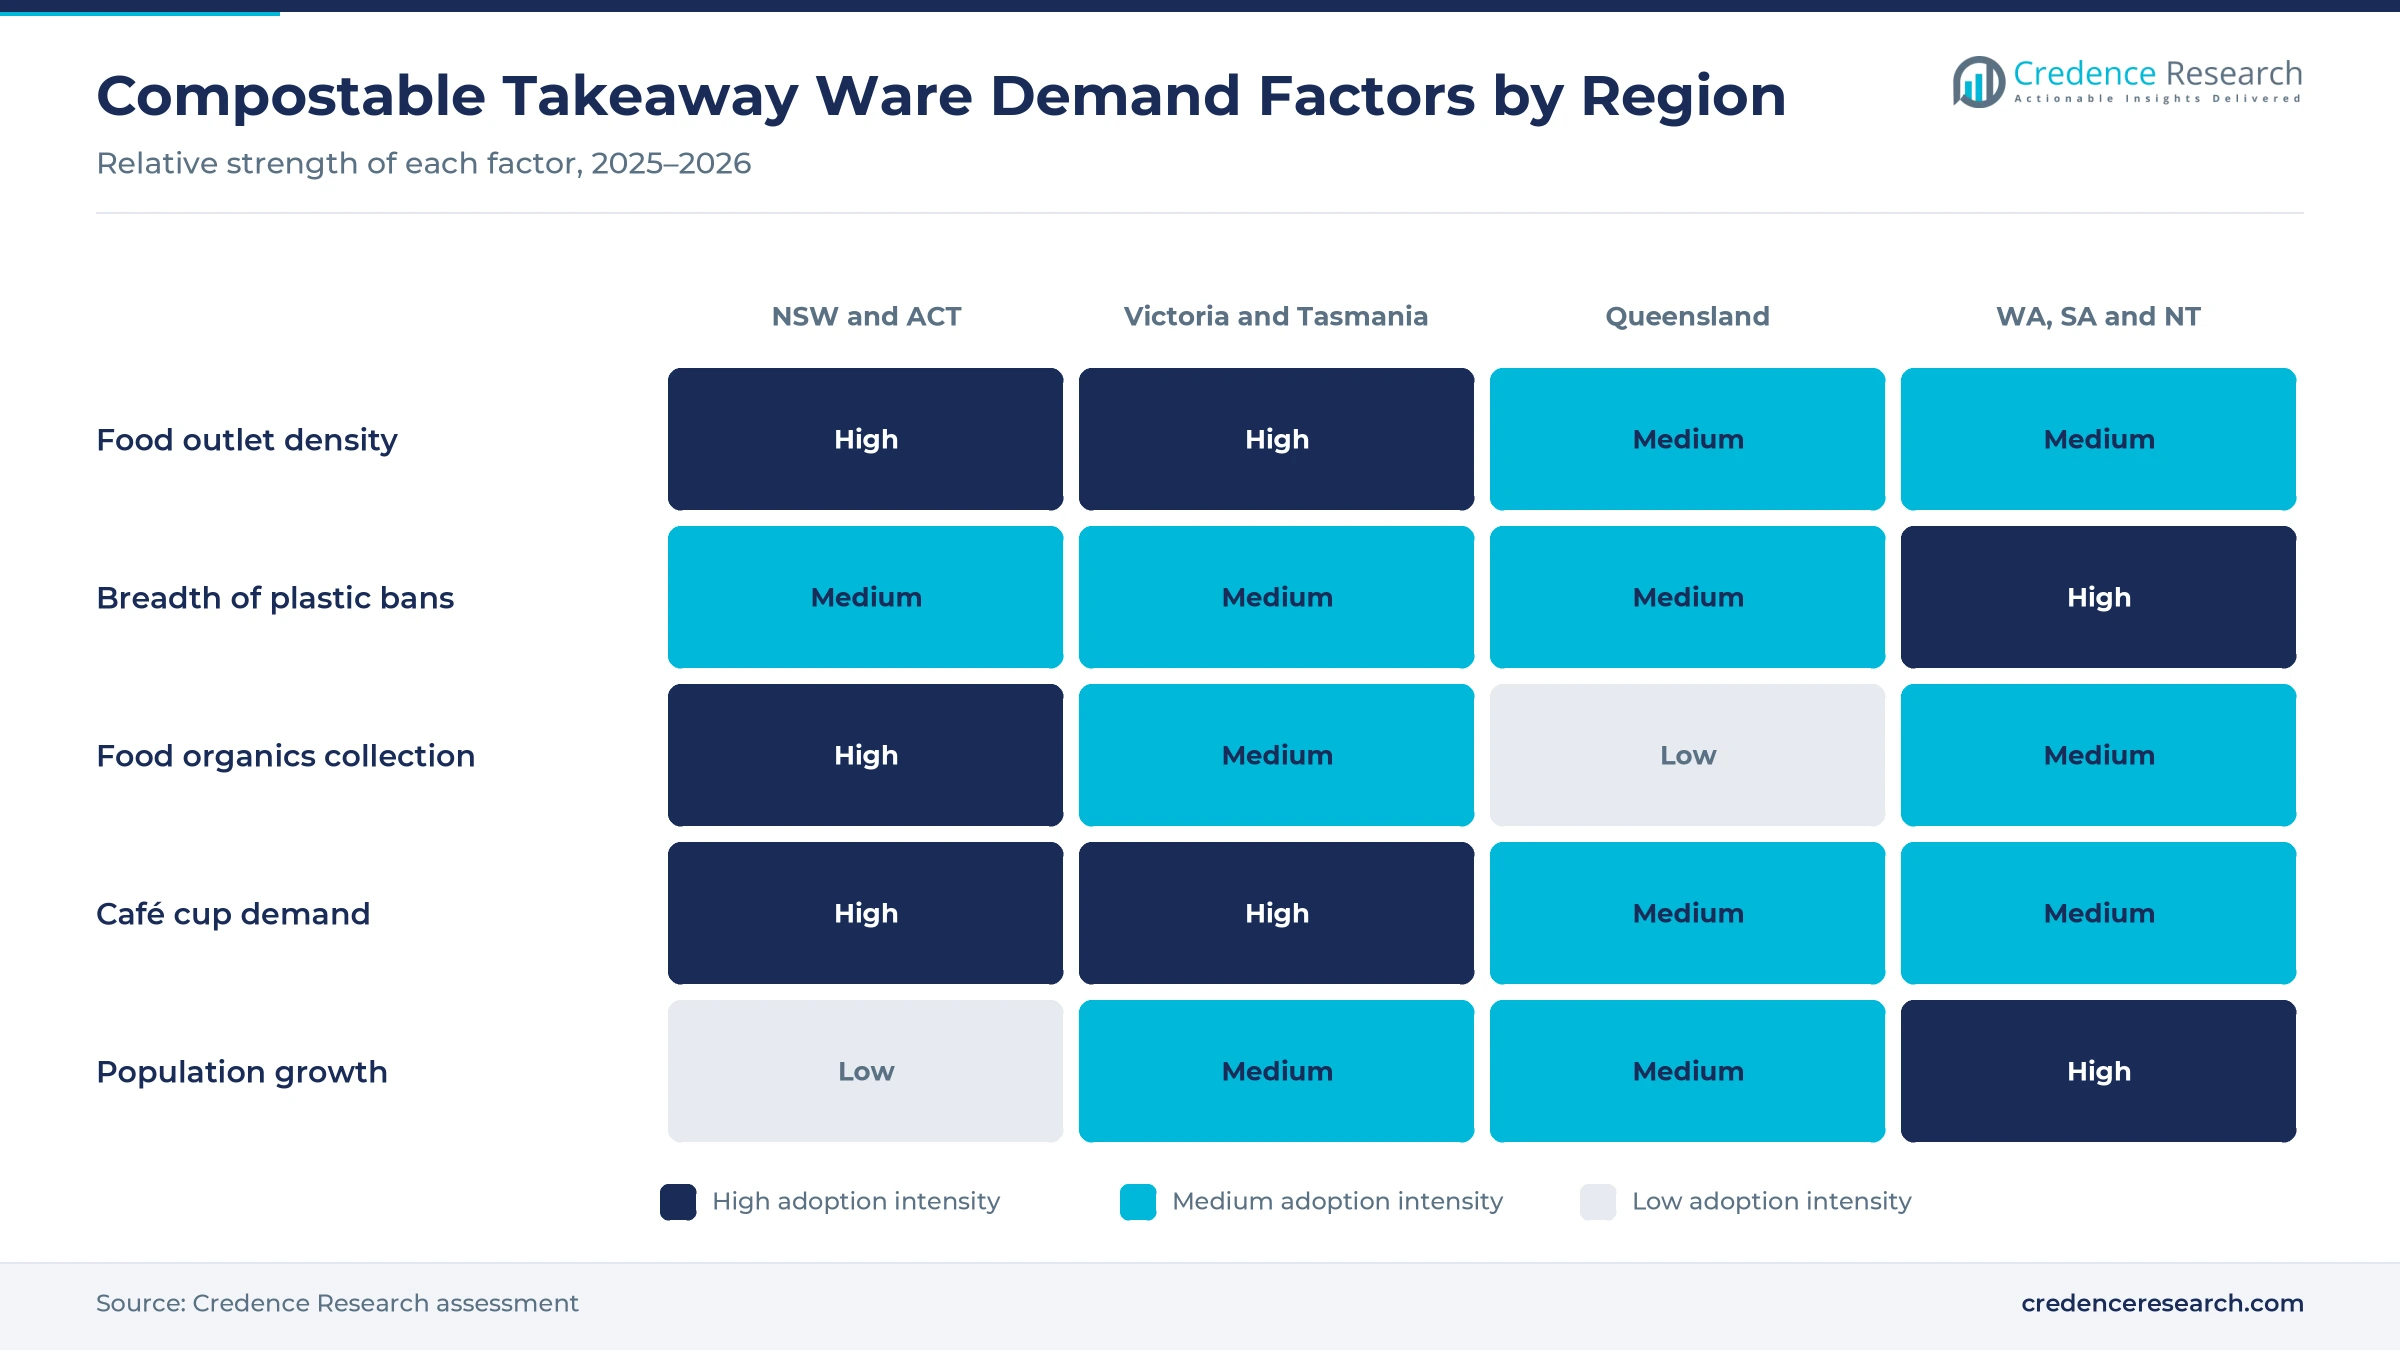
State bans on single-use plastics now cover most takeaway items, and several of them also catch compostable plastics, which moves buyers toward certified paper, bagasse and wood. The NSW Environment Protection Authority banned plastic cutlery, bowls, plates, straws and stirrers and all expanded polystyrene food service items from Nov. 1, 2022, and its guidance treats biodegradable and compostable plastics as plastic. Victoria's ban on cutlery, plates, stirrers and polystyrene food containers also applies to compostable plastics, the state government says. As a result, bagasse fibre grows fastest among materials at 5.83% a year, because molded pulp passes bans that PLA cutlery and plates cannot.
Why does recurring foodservice buying make demand steady?
Takeaway packaging is used once and reordered every week, so each outlet that switches to certified products creates a recurring stream of orders rather than a one-off sale. Australian environment groups estimated that more than 1.8 billion disposable cups are used every year, Packaging News reported in October 2022. The World Bank puts Australia's urban share at 87.7% of the population in 2025, which concentrates café and takeaway trade in a few large cities. Detpak said in December 2023 that its new fiber catering platter for Subway would remove 205 metric tons of plastic a year. In turn, quick-service restaurants hold 34.0% of 2025 value, because chains reorder every week.
Why does the NSW organics mandate matter for suppliers?
Food scrap collections give compostable packaging a working end-of-life route, because certified items can go into the same bin as leftover food. NSW law requires supermarkets, hospitality businesses and some institutions to have a separate food organics collection from July 1, 2026, starting with the largest generators, the NSW Environment Protection Authority says. Food businesses in the state send about 500,000 metric tons of organic waste to landfill each year, Planet Ark reported. Nationally, about 7.6 million metric tons of food is wasted across the supply chain each year, Green Industries SA says, against a goal of halving food waste by 2030. As a result, caterers and venues switch to items that can go into the same food organics bin as their leftovers.
How do 2025 packaging goals shape brand owner buying?
Compostable foodservice ware is one of the few ways brand owners can meet national goals for food-soiled items that cannot be recycled. The 2025 National Packaging Targets call for 100% of packaging to be reusable, recyclable or compostable and for 70% of plastic packaging to be recycled or composted, Food Processing reported. The same report said just over half of packaging placed on the market in 2021–22 was recovered. The federal environment department said in March 2026 that it was considering mandatory design requirements, recyclability labeling and bans on listed harmful chemicals, Packaging Insights reported. In turn, national chains sign direct supplier contracts that lock in compliant ranges before each new state ban starts.
Home-compostable cups, fiber lids and national design rules
How is the shift to home-compostable cups changing ranges?
Cup makers are shifting from PLA-lined cups toward linings that break down in home compost, because many households and offices still lack a commercial composting service. BioPak announced on June 7, 2024 that it had launched cups lined with polyhydroxyalkanoate, a biopolymer made by fermentation, Australian Manufacturing reported. The cups come in 8-ounce, 12-ounce and 16-ounce single-wall sizes and carry AS 5810 home compostable and French NF T51-800 certification, the report said. Vegware's Australian business lists products compliant with both AS 4736 and AS 5810 on its website. As a result, beverage serviceware grows fastest among product types at 5.69% a year.
Why is the rise of cup and container bans in the west notable?
Western and southern states have gone further than the eastern states, banning plastic cups, lids and containers that are still allowed elsewhere. Western Australia banned plastic coffee cups, cup lids and trays from March 1, 2024 and plastic lidded bowls, containers and lids from Sept. 1, 2024, and its rules cover plant-based plastics with limited exemptions. Its bans refer to AS 4736-2006 and AS 5810-2010 for lined paperboard. South Australia banned plastic beverage containers, including coffee cups and lids, from Sept. 1, 2024, and its business portal recommends certified compostable alternatives. In turn, cafés in Perth and Adelaide replace cups, lids and containers in one changeover rather than in stages.
Can fiber lids and molded trays open a new product niche?
Plastic lids and trays were the last parts of many takeaway orders to stay in plastic, which leaves room for paperboard and molded pulp replacements. Detpak designed its Subway catering platter at its LaunchPad laboratory in Adelaide and makes it in Australia and New Zealand, Packaging News reported. Confoil, a family-owned Australian food packaging maker since 1966, launched DualPakECO trays certified to AS 4736 with a BASF compostable coating, BASF said on June 29, 2022. Confoil's DualPakECO trays can go in ovens and microwaves and can be chilled or frozen. Detpak's fiber noodle cup for San Remo replaced polystyrene cups and keeps 35 million containers a year out of landfill, Packaging News reported. As a result, demand for molded fiber packaging rises as caterers replace PET meal trays.
Is there an opening in compostable liners and caddy bags?
Food scrap collections need certified liners and caddy bags, which gives bag makers a new outlet beside takeaway carry bags. BioBag World Australia makes most of its bags at a plant in Netley, South Australia and calls itself the only Australian compostable bag manufacturer. Its bags, used with a ventilated caddy, form a food waste sorting system used in more than 2 million households worldwide, the Australian Made Campaign listing says. NSW food organics mandates extend to an additional 58 councils by 2030 and could divert almost 950,000 metric tons of food and garden waste a year, the state regulator says. In turn, bags and foodservice accessories keep a steady place in kitchen and event orders.
Composting gaps, mixed bans and price premiums slow uptake
How do gaps in commercial composting limit claims?
Certified items only deliver their benefit when they reach a composting facility, yet many councils and businesses still send food waste to landfill. NSW households only need a food and garden organics service by July 1, 2030, so compostable cups often end up in red-lid bins. As a result, some buyers question whether paying more delivers a real outcome. Suppliers respond with take-back services and home-compostable linings, although collection coverage still varies widely between suburbs and regional towns.
Why do uneven state rules complicate national ranges?
Each state bans a different list of items on a different timetable, and the rules treat compostable plastics differently. Victoria and New South Wales ban compostable plastic cutlery and plates, while Western Australia's rules for plant-based plastics allow limited exemptions. In turn, national chains must hold several product versions and track each state's dates. Suppliers publish ban guides and stock state-specific ranges, but the cost of carrying more lines falls hardest on smaller converters and distributors.
How do price premiums weigh on small cafés?
Certified fiber and bioplastic items usually cost more per unit than the plastic and foam items they replace, and small cafés buy in small lots. As a result, owners facing high rents and wages often choose the cheapest compliant item rather than a certified compostable one. Recyclable paper items compete directly where bans do not require compostability. Suppliers respond with bulk cartons and private-label ranges, although margins stay thin on high-volume cups and napkins.
Why do chemical and performance checks slow approvals?
Fiber containers must resist grease and moisture, and some coatings used for that purpose face growing scrutiny over fluorinated chemicals. The Australasian Bioplastics Association says it checks certified products for non-intentionally added PFAS and may withhold renewals. In turn, converters must test new coatings for compost safety, worm toxicity and food contact before launch. These tests add months to product development, which delays the release of new lids and wet-food containers.
Eastern capitals lead takeaway ware spending
| Region | Value, 2025 (USD million) | Share, 2025 | CAGR, 2026–2035 |
|---|---|---|---|
| New South Wales and Australian Capital Territory | 62.5 | 33.7% | 5.27% |
| Victoria and Tasmania | 45.6 | 24.6% | 4.97% |
| Western Australia and South Australia and Northern Territory | 42.1 | 22.7% | 5.62% |
| Queensland | 35.2 | 19.0% | 5.37% |
Why does the NSW and ACT zone buy the most?
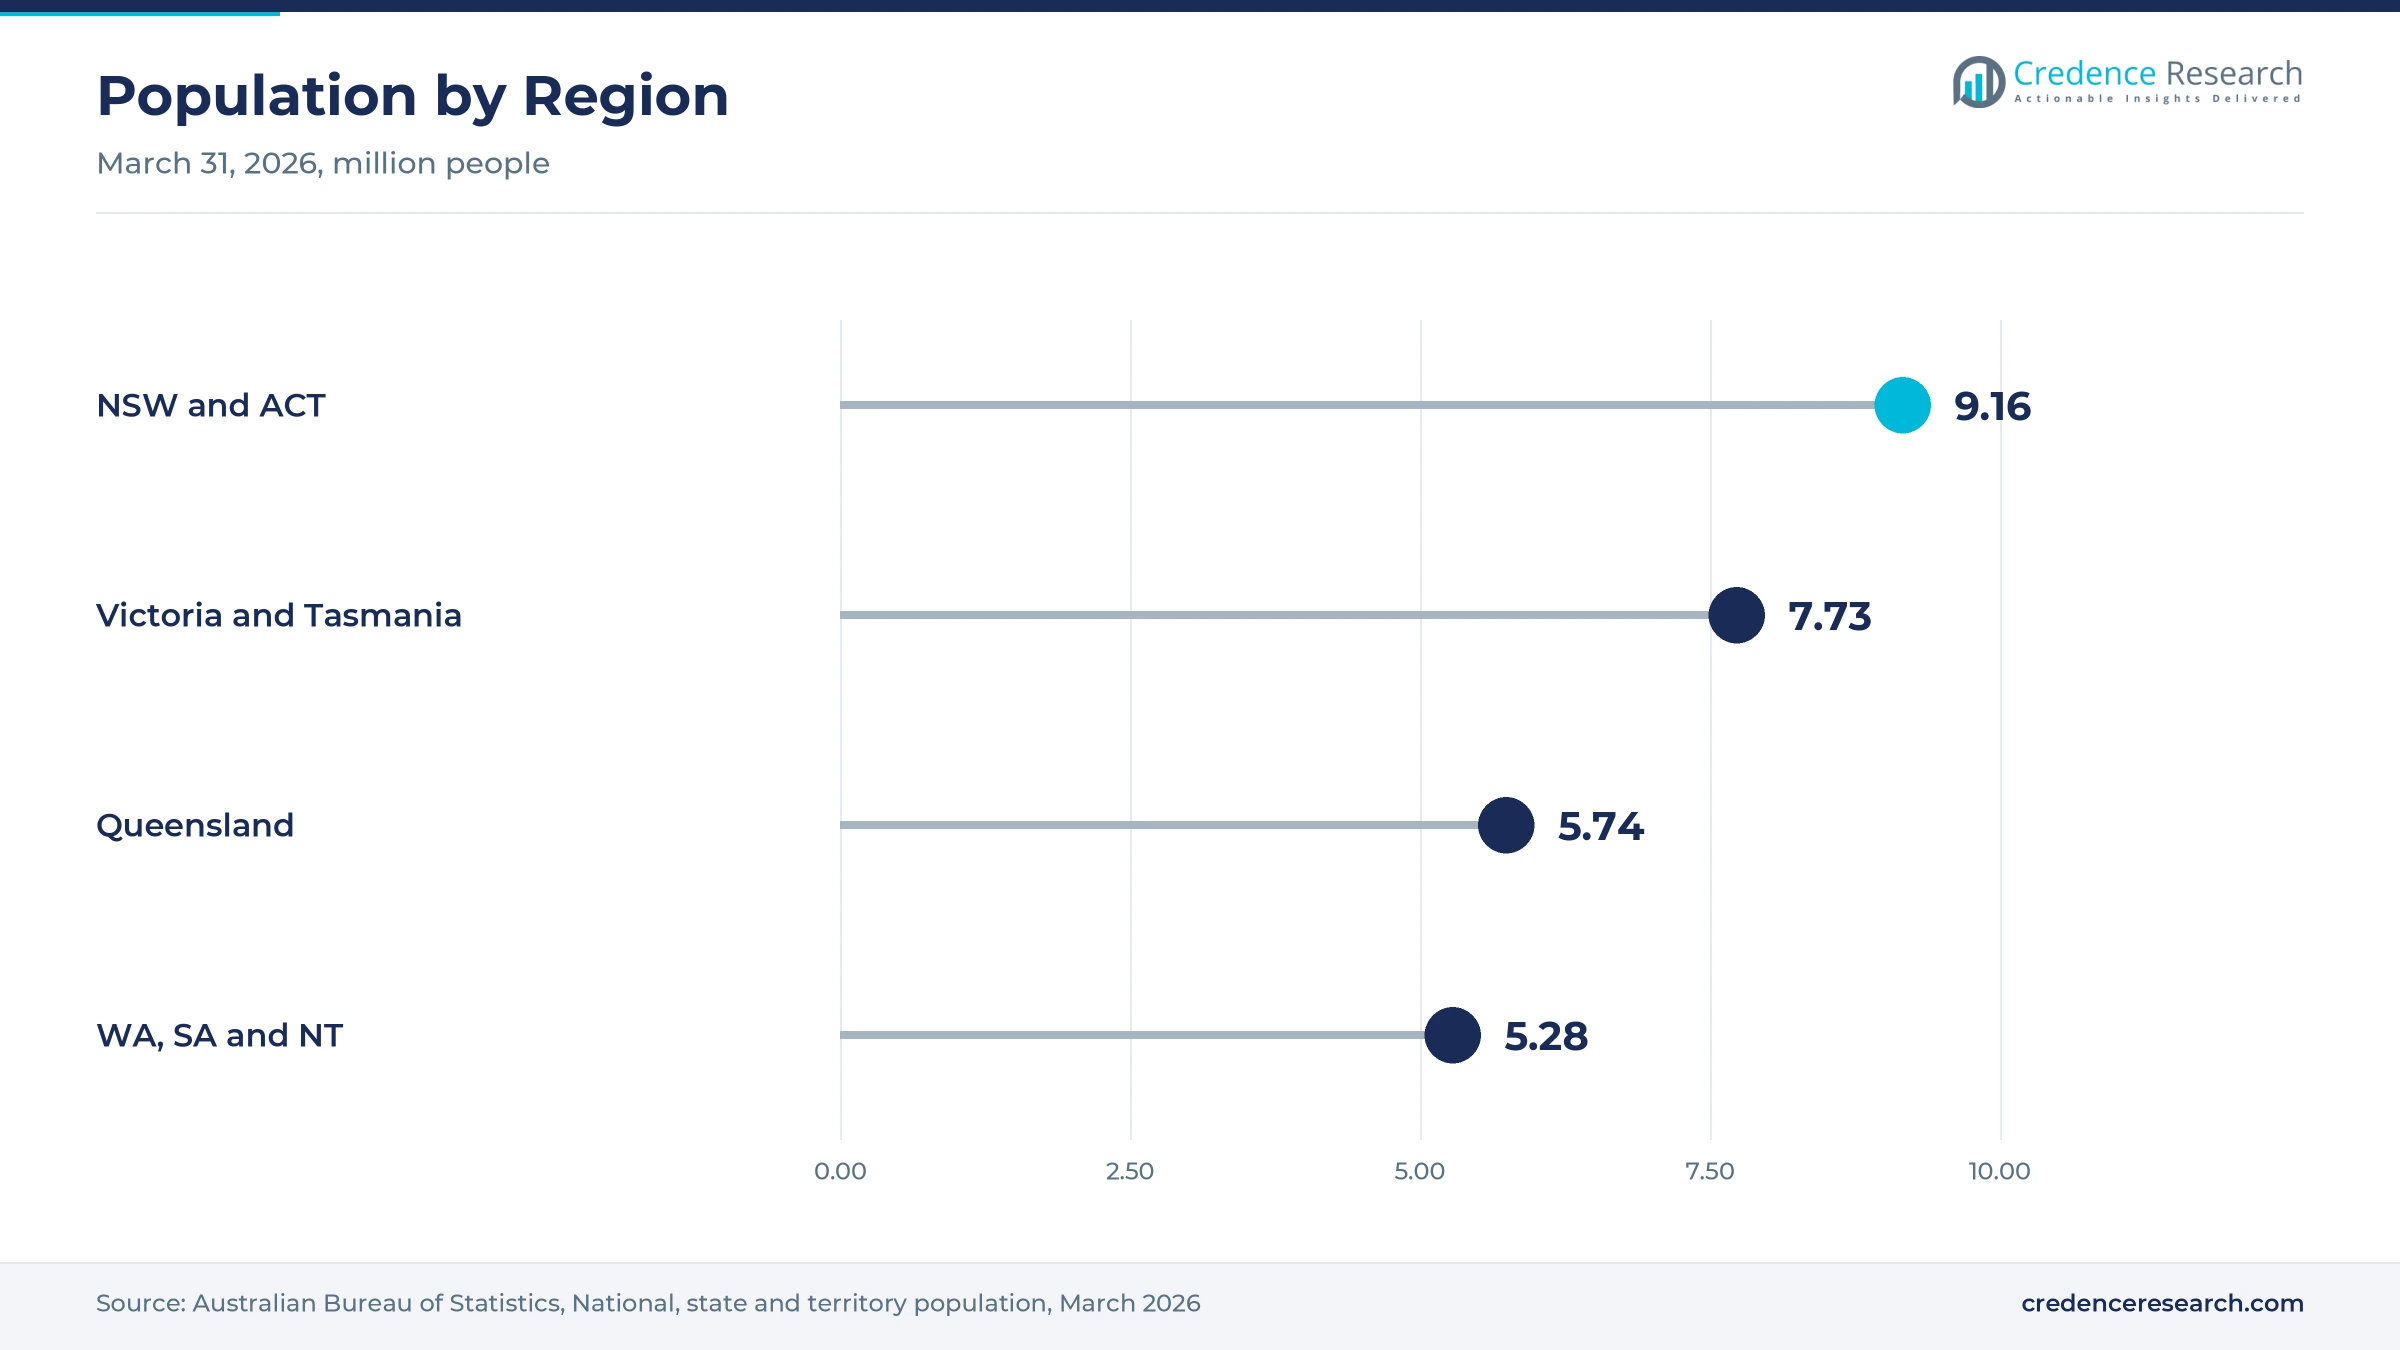
New South Wales and Australian Capital Territory held a 33.7% share of 2025 value and grows at 5.27% a year, because it is the most populous zone with about 9.16 million people in March 2026. The state banned plastic plates, bowls and cutlery in November 2022, and large food businesses must separate food scraps from July 2026. As a result, Sydney chains buy certified containers and cups in large contracts.
How do Victoria and Tasmania sustain café demand?
Victoria and Tasmania held a 24.6% share of 2025 value and grows at 4.97% a year, because Melbourne's café culture creates heavy demand for cups and lids. The zone held about 7.73 million people in March 2026, the Australian Bureau of Statistics reported. Victoria banned plastic cutlery, plates and polystyrene food containers in February 2023, including compostable plastics. In turn, coated board cups and bagasse plates take most of the zone's value.
Why are western and southern states the fastest zone?
Western Australia and South Australia and Northern Territory held a 22.7% share of 2025 value and grows fastest at 5.62% a year. Western Australia and South Australia banned plastic coffee cups and lids in 2024, before the eastern states. The zone held about 5.28 million people in March 2026, and Western Australia grew 2.1% over the year. As a result, cafés there replace cups, lids and containers at the same time.
How does Queensland balance tourism and takeaway demand?
Queensland held a 19.0% share of 2025 value and grows at 5.37% a year, because tourism, events and fast-growing suburbs add takeaway and catering demand. The state population reached about 5.74 million in March 2026, growing 1.6% over the year. Queensland banned plastic straws, plates and bowls in 2021, and it has spot-checked more than 2,600 retailers since then. In turn, outlets already buy fiber plates and bagasse tableware products in steady volumes.
Cup launches, ban stages and organics mandates since 2024
| Development | Status and market relevance |
|---|---|
| In June 2024, BioPak announced home-compostable cups lined with polyhydroxyalkanoate in three single-wall sizes. | Certified to AS 5810 and NF T51-800 for outlets without commercial composting |
| In September 2024, South Australia banned plastic beverage containers, including coffee cups and lids, from sale or supply. | Business guidance points outlets toward certified compostable cups and containers |
| In July 2025, Western Australia banned molded or cut expanded plastic packaging, the last Stage 2 item to take effect. | Completes a staged ban that began with cups, lids and containers in 2024 |
| In March 2026, the federal environment department said it was considering mandatory packaging design requirements. | Options include recycled content thresholds, recyclability labeling and bans on listed harmful chemicals |
| In July 2026, NSW began requiring the largest food waste generators to use a separate food organics collection. | Staged to smaller businesses through 2030, creating a route for certified packaging |
Coatings, pulp molding and certification tests set use
- Biopolymer coating replaces polyethylene linings in cups and trays with PLA, PBAT or PHA layers, which keeps liquids in while allowing composting.
- Pulp molding presses wet sugarcane or bamboo pulp into plates, bowls and clamshells, which yields rigid items without any plastic layer.
- Grease barrier treatment protects fiber containers from oil and sauce, which now needs coatings that pass compost and fluorinated chemical checks.
- Compostability testing measures at least 90% biodegradation and disintegration under AS 4736, which lets products carry the seedling logo.
Need a Custom Version of This Report?
Tailor the scope, geography, or segments to your exact requirements.
- Custom geography or segment scope
- Direct access to our analyst team
Local brand owners compete on certified ranges and service
Competition is led by Australian brand owners that design certified ranges and sell them through foodservice distributors and web stores. BioPak, majority owned by Duni Group, supplies cups, containers and cutlery and has run a compost collection service for cafés since 2018. Detpak, part of Adelaide's Detmold Group, designs fiber cups, lids and platters for national chains. Confoil makes certified compostable meal trays, while BioBag World Australia focuses on compostable bags and caddy liners made in South Australia. Vegware's Australian business and Pakchain sell certified ranges online to cafés and caterers. Rivals compete on certification, state ban compliance, custom printing and delivery reliability, and many also sell paper cups that are recyclable rather than compostable.
Which suppliers lead certified takeaway ware?
| Company | Type | Role in the market |
|---|---|---|
| BioPak | Foodservice packaging brand owner | Supplies certified cups, containers and cutlery and launched PHA-lined home-compostable cups in 2024 |
| Detpak | Paper and board packaging maker | Designs fiber cups, lids and catering platters at its LaunchPad laboratory in Adelaide |
| Confoil | Food tray manufacturer | Makes DualPakECO paper meal trays certified to AS 4736 |
| BioBag Australia | Compostable bag maker | Makes certified compostable bags and caddy liners in Netley, South Australia |
| Vegware | Compostable packaging supplier | Sells AS 4736 and AS 5810 compliant ranges nationwide to kitchens and events |
| Pakchain | Online packaging supplier | Sells molded fiber, paperboard and certified compostable items to cafés |
Credence Research view on compostable takeaway ware
Credence Research's view is that Australian demand for compostable takeaway ware will keep growing because state bans keep widening and food scrap collections give certified items a real disposal route. Food containers stay the largest product type, while cups and lids grow fastest as western and southern bans take hold. Bagasse and other molded fibers should gain share from PLA, because several states treat compostable plastics as plastic. Suppliers that pair certified ranges with collection services, state ban guidance and reliable delivery should win most chain and café contracts by 2035.
Ban rules, population data and supplier ranges in the model
The report uses 2025 as the base year on a calendar basis, and market values come from the Credence Research model. That model combines state plastic ban rules, food organics collection mandates, population statistics, national packaging targets, certification program rules and company product information. Segment splits, regional shares and regional growth rates are Credence Research estimates. Sources used are government and regulator pages, statistical releases, an industry association page, company websites and trade media, and no interviews or surveys were used.
Container bans and food scrap services carry demand to 2035
The Australia compostable food service disposables market is expected to reach USD 320.0 million by 2035, a 5.30% CAGR during 2026–2035, as outlets replace plastic cups, lids, containers and cutlery with certified items. Growth should be strongest in beverage serviceware, bagasse fibre and supplier web stores, because cafés need compliant cups and order them in small lots. Gaps in composting, uneven state rules and price premiums could slow some adoption. Food scrap mandates and national packaging reform should still support demand through the forecast period, alongside wider circular economy and recycling technology investment.
Frequently Asked Questions
How big is the Australia compostable food service disposables market?
Which product type leads spending?
Which region leads the market?
Do state bans cover compostable plastics?
What certification do compostable items need?
How do food scrap collections support demand?
Who are the leading companies in the market?
What are the main challenges for buyers?
Table of Content
Chapter 1 Market Segmentation
- 1.1 Segmentation Framework
- 1.1.1 Product and Service Classification
- 1.1.2 Application and End-Use Classification
- 1.1.3 Technology and Solution Classification
- 1.1.4 Customer and Distribution Channel Classification
- 1.1.5 Geographic Segmentation
- 1.1.6 Market Segment Definitions and Boundaries
- 1.2 By Product Type
- 1.2.1 Beverage serviceware
- 1.2.2 Food containers
- 1.2.3 Tableware and utensils
- 1.2.4 Bags and foodservice accessories
- 1.3 By Material Type
- 1.3.1 Coated paper and card
- 1.3.2 Bagasse fibre
- 1.3.3 Polylactic acid materials
- 1.3.4 Bamboo fibre and starch composites
- 1.4 By End User
- 1.4.1 Quick-service restaurants
- 1.4.2 Cafés and coffee shops
- 1.4.3 Restaurants and delivery kitchens
- 1.4.4 Contract catering and events
- 1.5 By Sales Channel
- 1.5.1 Foodservice distributors
- 1.5.2 Direct supplier contracts
- 1.5.3 Supplier web stores
- 1.5.4 Operator direct imports
Chapter 2 Introduction
- 2.1 Report Objectives and Scope
- 2.2 Product Definition and Industry Terminology
- 2.3 Market Inclusions and Exclusions
- 2.4 Research Process
- 2.4.1 Primary Research and Expert Interviews
- 2.4.2 Secondary Research and Source Review
- 2.4.3 Top-Down and Bottom-Up Estimation
- 2.4.4 Data Triangulation and Verification
- 2.5 Market Size Measurement Basis
- 2.5.1 2025: USD 185.5 million → 2035: USD 320.0 million
- 2.6 Historical and Forecast Reference Periods
- 2.6.1 Historical Period: 2018-2025
- 2.6.2 Base Year: 2025
- 2.6.3 Forecast Period: 2025-2035
- 2.7 Research Assumptions and Limitations
Chapter 3 Executive Summary
- 3.1 Market Snapshot and Key Findings
- 3.2 Base-Year Market Size, 2025
- 3.3 Forecast Market Size, 2035
- 3.4 Revenue and Volume Growth Outlook
- 3.5 Key Demand and Supply Indicators
- 3.6 Leading Market Segments
- 3.7 Fastest-Growing Market Opportunities
- 3.8 Regional Performance Highlights
- 3.9 Technology and Industry Transformation
- 3.10 Competitive Landscape Summary
- 3.11 Analyst View and Strategic Implications
Chapter 4 Australia Compostable Food Service Disposables Market Trends and Developments
- 4.1 Historical Industry Development, 2018-2025
- 4.2 Recent Market Trends and Developments
- 4.3 Demand and Customer Behavior Trends
- 4.4 Technology and Product Innovation
- 4.5 Artificial Intelligence, Automation and Digitalization
- 4.6 Local Manufacturing and Supply Chain Realignment
- 4.7 Industry Partnerships, Mergers and Acquisitions
- 4.8 Sustainability and Circular Economy Developments
- 4.9 Government and Private Sector Investment Trends
- 4.10 Emerging Business Models and Commercialization
- 4.11 Industry Developments and Announcements
Chapter 5 Australia Compostable Food Service Disposables Market Production, Supply and Demand Analysis
- 5.1 Demand Trend and Consumption Analysis, 2018-2025
- 5.2 Demand Forecast, 2025-2035
- 5.3 Production and Output Trend, 2018-2025
- 5.4 Production and Output Forecast, 2025-2035
- 5.5 Installed Capacity and Capacity Utilization
- 5.6 Company-Wise Production Plants and Statistics
- 5.6.1 Installed Production Capacity
- 5.6.2 Actual Production
- 5.6.3 Planned Capacity and Expansion Targets
- 5.7 Supply Chain Structure and Procurement Trends
- 5.8 Supply-Demand Gap and Bottlenecks
- 5.9 Import Dependence and Sourcing Structure
- 5.10 Contract Manufacturing and Outsourcing
- 5.11 Regional Supply and Demand Concentration
Chapter 6 Australia Compostable Food Service Disposables Market Pricing Analysis
- 6.1 Pricing Structure and Measurement
- 6.2 Historical Pricing Trends, 2018-2025
- 6.3 Pricing Outlook, 2025-2035
- 6.4 Average Selling Price and Unit Economics
- 6.5 Pricing by Product and Market Segment
- 6.6 Geographic Pricing Differences
- 6.7 Key Input, Energy, Labor and Logistics Costs
- 6.8 Contract Pricing and Purchasing Models
- 6.9 Pricing Sensitivity and Competitive Positioning
- 6.10 Price, Margin and Profitability Implications
Chapter 7 Australia Compostable Food Service Disposables Market Dynamics
- 7.1 Market Growth Drivers
- 7.1.1 Demand-Side Drivers
- 7.1.2 Technology and Innovation Drivers
- 7.1.3 Infrastructure and Investment Drivers
- 7.1.4 Regulatory and Policy Drivers
- 7.2 Market Restraints
- 7.2.1 Cost and Affordability Constraints
- 7.2.2 Technology and Adoption Barriers
- 7.2.3 Supply Chain and Operational Constraints
- 7.3 Market Challenges
- 7.3.1 Competitive Pressure and Margin Erosion
- 7.3.2 Skills, Infrastructure and Implementation Gaps
- 7.4 Emerging Market Opportunities
- 7.5 Market Dynamics Impact and Time-Horizon Assessment
Chapter 8 Australia Compostable Food Service Disposables Value Chain Analysis
- 8.1 Industry Value Chain Overview
- 8.2 Upstream Suppliers and Critical Inputs
- 8.3 Technology and Component Providers
- 8.4 Manufacturing or Service Delivery
- 8.5 Distribution, Channel Partners and Integrators
- 8.6 Downstream Applications and End Users
- 8.7 Value Addition and Profit Pools
- 8.8 Vertical Integration and Outsourcing
- 8.9 Supplier Concentration and Risk
- 8.10 Supply Chain Localization and Resilience
Chapter 9 Australia Compostable Food Service Disposables Market Regulations and Policies
- 9.1 Relevant Laws, Standards and Compliance Frameworks
- 9.2 Product, Service, Safety and Quality Requirements
- 9.3 Government Policies, Incentives and Subsidies
- 9.4 Imports, Exports and Trade Barriers
- 9.5 Public Procurement and Local Content Requirements
- 9.6 Environmental and Sustainability Compliance
- 9.7 Upcoming Policy Changes and Market Implications
Chapter 10 Australia Compostable Food Service Disposables Market Hotspots and Opportunities
- 10.1 Market Opportunity Mapping and Growth Hotspots
- 10.2 High-Growth Applications and Customer Groups
- 10.3 Underserved Markets and White-Space Opportunities
- 10.4 Emerging Technology and Product Opportunities
- 10.5 New Capacity and Investment Hotspots
- 10.6 Market Entry and Expansion Opportunities
- 10.7 Distribution and Partnership Opportunities
- 10.8 Near-Term and Long-Term Commercial Potential
- 10.9 Opportunity Attractiveness and Execution Risks
Chapter 11 Australia Compostable Food Service Disposables Market Outlook, 2025-2035
- 11.1 Market Size and Analysis
- 11.1.1 Revenue (Market Measurement: 2025: USD 185.5 million → 2035: USD 320.0 million)
- 11.1.2 Market Volume and Quantity Sold
- 11.1.3 Historical Market Size, 2018-2025
- 11.1.4 Base-Year Market Size, 2025
- 11.2 Market Forecast, 2025-2035
- 11.2.1 Revenue Forecast to 2035
- 11.2.2 Volume Forecast to 2035
- 11.2.3 CAGR and Year-on-Year Growth
- 11.2.4 Incremental Revenue Opportunity
- 11.3 Forecast Assumptions and Scenario Analysis
- 11.3.1 Base-Case Forecast
- 11.3.2 Optimistic and Conservative Scenarios
- 11.3.3 Technology, Pricing and Policy Sensitivities
- 11.4 Market Attractiveness and Growth Outlook
Chapter 12 Australia Compostable Food Service Disposables Market Segmentation and Outlook
- 12.1 Segmentation Summary and Market Shares, 2025
- 12.2 Largest and Fastest-Growing Segments
- 12.3 By Product Type - Market Size and Forecast, 2025-2035
- 12.3.1 Segment Definition and Scope
- 12.3.2 Historical Market Size, 2018-2025
- 12.3.3 Revenue Forecast, 2025-2035
- 12.3.4 Volume Forecast, 2025-2035
- 12.3.5 Base-Year Market Share, 2025
- 12.3.6 Segment CAGR and Growth Drivers
- 12.3.7 Subsegment Market Size and Forecast
- 12.3.7.1 Beverage serviceware
- 12.3.7.2 Food containers
- 12.3.7.3 Tableware and utensils
- 12.3.7.4 Bags and foodservice accessories
- 12.3.8 Subsegment Pricing and Adoption Trends
- 12.3.9 Leading Suppliers and Competition
- 12.3.10 Regional Demand and Opportunities
- 12.4 By Material Type - Market Size and Forecast, 2025-2035
- 12.4.1 Segment Definition and Scope
- 12.4.2 Historical Market Size, 2018-2025
- 12.4.3 Revenue Forecast, 2025-2035
- 12.4.4 Volume Forecast, 2025-2035
- 12.4.5 Base-Year Market Share, 2025
- 12.4.6 Segment CAGR and Growth Drivers
- 12.4.7 Subsegment Market Size and Forecast
- 12.4.7.1 Coated paper and card
- 12.4.7.2 Bagasse fibre
- 12.4.7.3 Polylactic acid materials
- 12.4.7.4 Bamboo fibre and starch composites
- 12.4.8 Subsegment Pricing and Adoption Trends
- 12.4.9 Leading Suppliers and Competition
- 12.4.10 Regional Demand and Opportunities
- 12.5 By End User - Market Size and Forecast, 2025-2035
- 12.5.1 Segment Definition and Scope
- 12.5.2 Historical Market Size, 2018-2025
- 12.5.3 Revenue Forecast, 2025-2035
- 12.5.4 Volume Forecast, 2025-2035
- 12.5.5 Base-Year Market Share, 2025
- 12.5.6 Segment CAGR and Growth Drivers
- 12.5.7 Subsegment Market Size and Forecast
- 12.5.7.1 Quick-service restaurants
- 12.5.7.2 Cafés and coffee shops
- 12.5.7.3 Restaurants and delivery kitchens
- 12.5.7.4 Contract catering and events
- 12.5.8 Subsegment Pricing and Adoption Trends
- 12.5.9 Leading Suppliers and Competition
- 12.5.10 Regional Demand and Opportunities
- 12.6 By Sales Channel - Market Size and Forecast, 2025-2035
- 12.6.1 Segment Definition and Scope
- 12.6.2 Historical Market Size, 2018-2025
- 12.6.3 Revenue Forecast, 2025-2035
- 12.6.4 Volume Forecast, 2025-2035
- 12.6.5 Base-Year Market Share, 2025
- 12.6.6 Segment CAGR and Growth Drivers
- 12.6.7 Subsegment Market Size and Forecast
- 12.6.7.1 Foodservice distributors
- 12.6.7.2 Direct supplier contracts
- 12.6.7.3 Supplier web stores
- 12.6.7.4 Operator direct imports
- 12.6.8 Subsegment Pricing and Adoption Trends
- 12.6.9 Leading Suppliers and Competition
- 12.6.10 Regional Demand and Opportunities
- 12.7 Segment Growth Comparison
- 12.8 Segment Attractiveness and Priority Matrix
Chapter 13 Australia Compostable Food Service Disposables End-Use and Application Market Outlook
- 13.1 End-Use Industry and Customer Demand Structure
- 13.2 Leading Applications and Customer Groups
- 13.3 End-Use Market Size, Share and Forecast
- 13.4 Major End-Use Industry Deep Dives
- 13.4.1 Customer Requirements and Use Cases
- 13.4.2 Demand and Replacement Cycles
- 13.4.3 Technical and Regulatory Considerations
- 13.4.4 Purchasing and Procurement Models
- 13.4.5 Leading Vendors and Distribution Channels
- 13.4.6 Forecast and Commercial Opportunities
- 13.5 Emerging Applications and Cross-Segment Demand
- 13.6 End-Use Industry Investment Priorities
Chapter 14 Australia Compostable Food Service Disposables Geographic Market Outlook, 2025-2035
- 14.1 Domestic Market Distribution and Demand Clusters
- 14.2 State- or Province-Wise Market Size and Forecast, 2025-2035
- 14.3 City and Metropolitan Market Outlook
- 14.4 Industrial, Manufacturing and Commercial Clusters
- 14.5 Geographic Concentration of Key End Users
- 14.6 Local Pricing and Purchasing Differences
- 14.7 Domestic Production Facilities and Capacity Map
- 14.8 Local Infrastructure and Project Pipeline
- 14.9 State-Level Policy and Incentive Differences
- 14.10 Subnational Investment Hotspots and Opportunities
- 14.11 Distribution and Logistics Networks
- 14.12 Domestic Competitive Footprint
Chapter 15 Australia Compostable Food Service Disposables Technology, Innovation and Sustainability Outlook
- 15.1 Technology Landscape and Maturity
- 15.2 Product, Process and Service Innovation
- 15.3 AI, Automation and Digital Tools in the Industry
- 15.4 Technology Adoption and Performance Benchmarking
- 15.5 Innovation Pipeline and R&D Investment
- 15.6 Patent and Intellectual Property Trends
- 15.7 Energy Efficiency and Resource Management
- 15.8 Sustainability, Recycling and Circularity
- 15.9 Technology Roadmap, 2025-2035
- 15.10 Risks of Obsolescence and Technology Substitution
Chapter 16 Australia Compostable Food Service Disposables Market Key Strategic Imperatives
- 16.1 Growth and Market Entry Priorities
- 16.2 High-Return Products and Segments
- 16.3 Pricing, Profitability and Cost Optimization
- 16.4 Technology Investment and Product Differentiation
- 16.5 Supply Chain Localization and Resilience
- 16.6 Distribution and Customer Acquisition
- 16.7 Partnership, Acquisition and Capacity Strategy
- 16.8 Regional Expansion Priorities
- 16.9 Short-, Medium- and Long-Term Actions
Chapter 17 Competition Outlook
- 17.1 Industry Competition Characteristics
- 17.2 Market Structure and Concentration
- 17.3 Market Share and Competitive Positioning, 2025
- 17.4 Company-Wise Revenue and Product Benchmarking
- 17.5 Production and Service Capacity Benchmarking
- 17.6 Technology, Pricing and Differentiation
- 17.7 Regional Footprint and Distribution Strength
- 17.8 Mergers, Acquisitions and Strategic Alliances
- 17.9 New Entrants and Competitive Threats
- 17.10 Porter's Five Forces and Industry Attractiveness
- 17.11 Competitive Outlook, 2025-2035
Chapter 18 Company Profiles
- 18.1 Company Coverage and Selection Criteria
- 18.2 BioPak
- 18.2.1 Business Description
- 18.2.2 Company Ownership and Geographic Presence
- 18.2.3 Product and Service Portfolio
- 18.2.4 Manufacturing and Operating Footprint
- 18.2.5 Production Capacity and Expansion Plans
- 18.2.6 Financial Performance and Investment
- 18.2.7 Market Share and Competitive Position
- 18.2.8 Technology and Innovation Capabilities
- 18.2.9 Strategic Alliances or Partnerships
- 18.2.10 Recent Developments
- 18.2.11 Growth Strategy and Outlook
- 18.3 Detpak
- 18.4 Vegware
- 18.5 PAC Trading
- 18.6 Castaway
- 18.7 Confoil
- 18.8 Bonson-Savpac
- 18.9 BioBag Australia
- 18.10 Because We Care
- 18.11 Pakchain
- 18.12 Other Relevant Market Participants
Note: Every listed company is profiled on the structure shown under the first company. The company list is preliminary and may change based on research findings, market developments, data availability and client requirements.
Chapter 19 Disclaimer
- 19.1 Research and Forecast Disclaimer
- 19.2 Data Source and Estimation Limitations
Note: The depth of individual sections depends on data availability for this market. Volume, capacity, trade and other unit-based metrics are included where applicable.

