
Refurbishment of existing space now drives most fit-out work
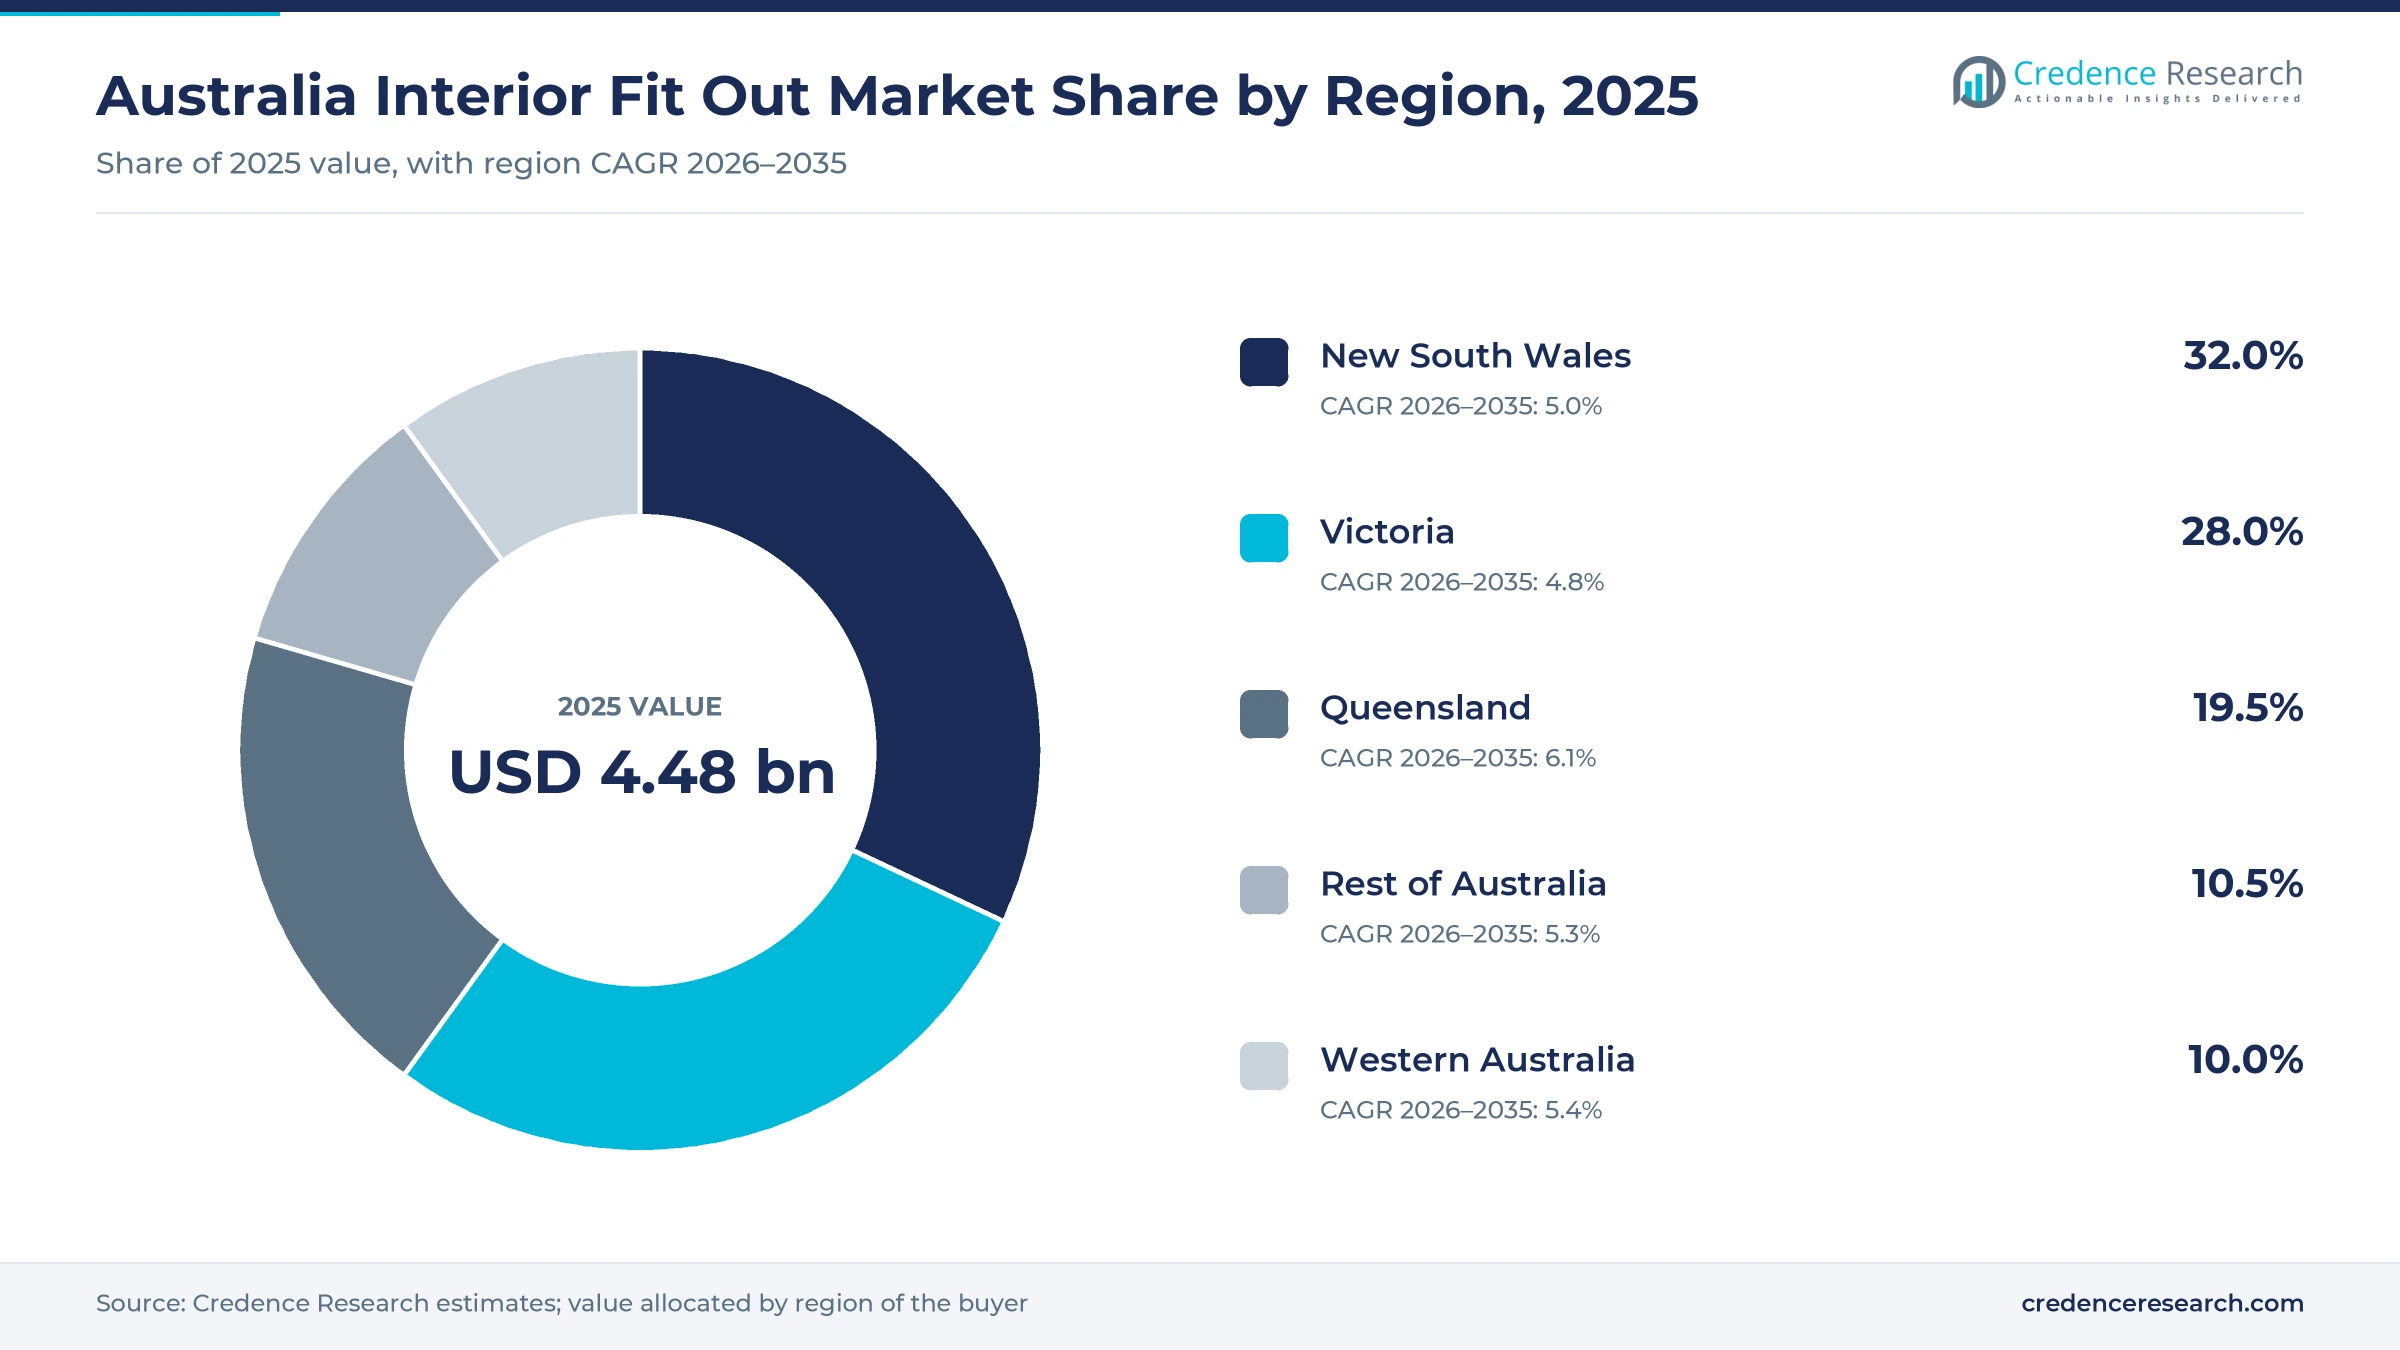
The Australia interior fit out market was valued at USD 4.48 billion in 2025 and is projected to increase from USD 4.71 billion in 2026 to USD 7.44 billion by 2035, registering a CAGR of 5.20% during 2026–2035. Demand comes from office occupiers upgrading or relocating within CBD towers, hotel owners refurbishing rather than building, health operators opening clinics and retailers rolling out store formats across many sites. New South Wales held the largest share, 32.0% in 2025, because Sydney holds the largest office stock and the state records the most non-residential building work. Queensland is the fastest-growing zone at 6.1% a year, as Brisbane office absorption and pre-2032 hotel openings lift demand. The most important commercial change is the shift toward reusable, landlord-led fit-outs that cut strip-out waste, which the national green rating body began certifying in 2026. Zone shares are Credence Research estimates derived from state building activity data of the Australian Bureau of Statistics.
Which interior works does the estimate count in Australia?
The estimate counts the value of interior construction, installation, joinery, finishes and services work inside existing or new tenancies, together with the design, project management and consulting fees tied to that work. Buyers are office occupiers, landlords preparing speculative suites, hotel owners, health and education operators, retailers and owners renovating homes, and they usually buy through design and construct contracts or a design-led tender.
Base-building construction, facade work, loose furniture bought separately and data center fit-outs are excluded, although some contractors bundle them into wider contracts. The value chain runs from designers and quantity surveyors through specialist fit-out builders and joinery workshops to subcontract trades. One evidence gap remains, because no public body reports fit-out spending separately from total building and alterations work.

Australia Interior Fit Out Market Insights
- The market grows from USD 4.48 billion in 2025 to USD 7.44 billion by 2035, a 5.20% CAGR, as refurbishment of existing offices, hotels and clinics replaces new-build activity.
- New South Wales led with 32.0% of 2025 value because Sydney office towers and corporate headquarters generate the most refits in the country.
- Construction and installation held 72.0% in 2025, since trade labor, joinery and services work make up most of the cost of every project.
- The Green Building Council of Australia certified the first project under its Green Star Fitouts tool in March 2026, adding circularity as a core rating requirement.
- SHAPE Australia completed purchases of Arden Group in December 2025 and Australian Professional Shopfitters in July 2026, consolidating national retail rollout capacity.
Builders take most value as premium and clinic work grow
Why does construction work absorb most fit-out budgets?
Based on type, the market is categorized into construction and installation, design and consulting, and others. Construction & Installation led with 72.0% of 2025 value because trade labor, joinery, ceilings, services and finishes dominate every contract, and Dexus says traditional fit-outs take three to six months from lease execution to occupancy, most of it on site. Design & Consulting grows fastest at 5.9% a year as the Green Star Fitouts circularity category rewards reuse and design for disassembly, decisions that must be settled during design, and the Green Building Council of Australia certified the first project under that tool on March 18, 2026.
How do budget tiers split across Australian projects?
Based on budget, the market is categorized into mid-range, low budget and high-end luxury. Mid-Range led with 46.0% of 2025 value because most work refreshes existing floors, and the JLL survey found that 63% of Australian employers plan to raise investment in refurbishing existing buildings over the next five years, against 54% across Asia Pacific. High-End Luxury grows fastest at 6.0% a year as occupied premium office stock rose 7% over the year to mid-2025, according to the Property Council, and premium tenancies carry higher specifications.
Which end users commission the most fit-out work?
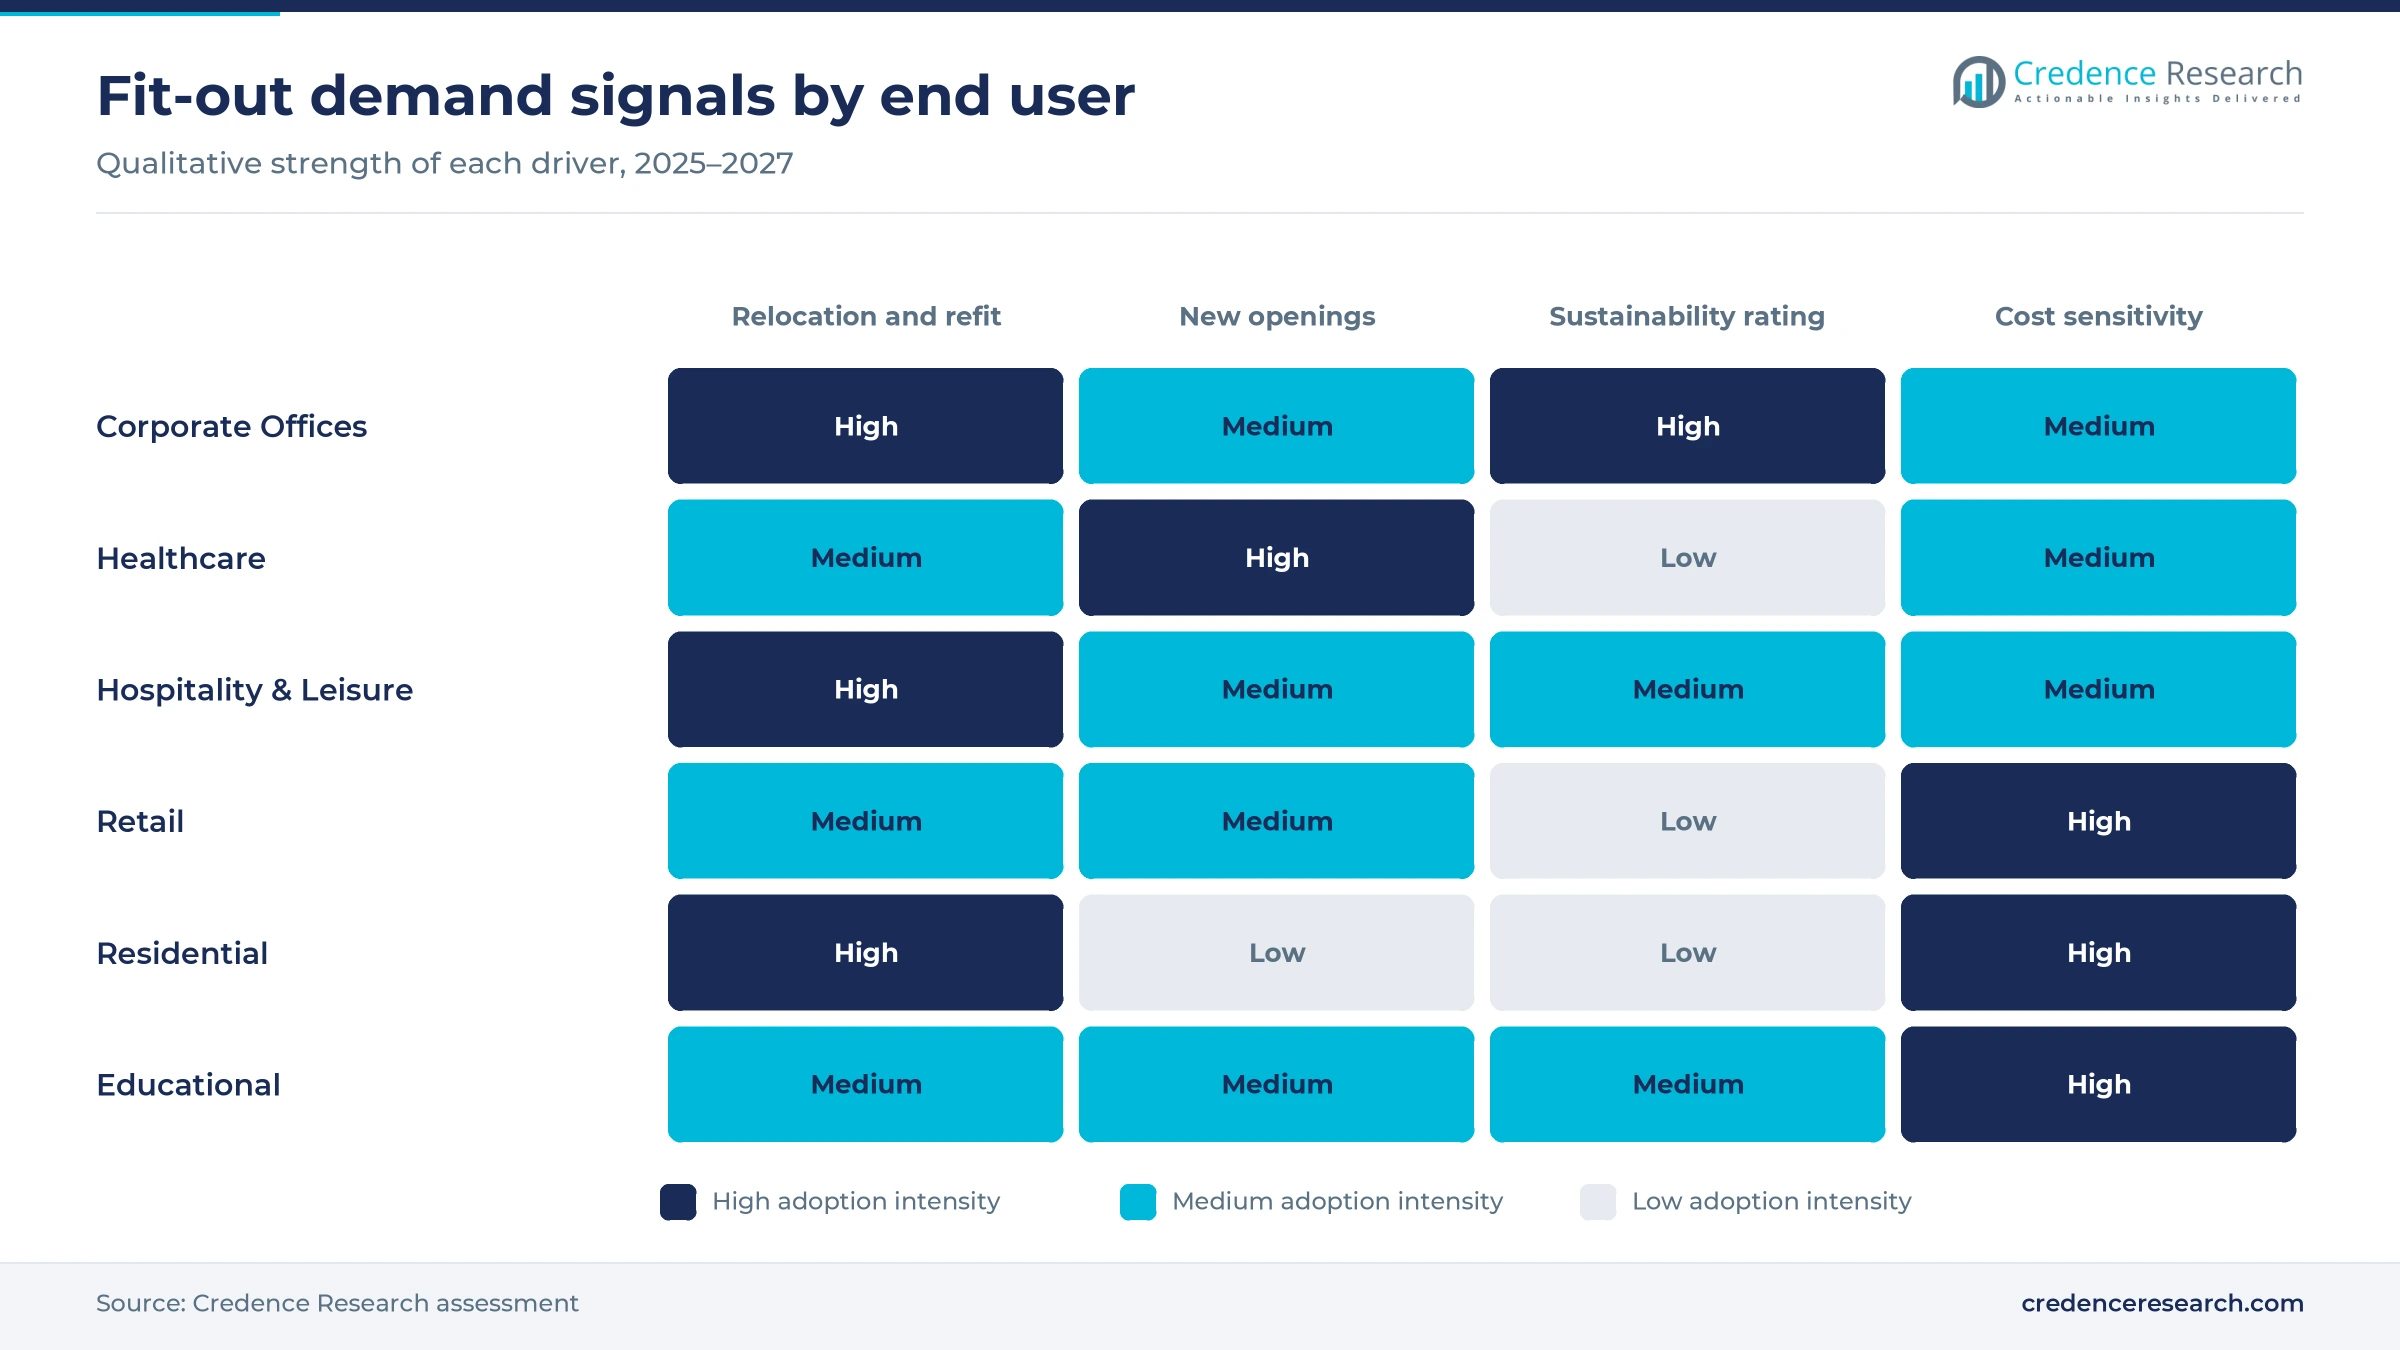
Based on end user, the market is categorized into corporate offices, residential, retail, hospitality and leisure, healthcare and educational. Corporate Offices led with 38.0% of 2025 value because more than 200,000 sqm of new CBD office supply arrived in the first half of 2025 alone, according to the Property Council, and each tenancy needs a fit-out. Healthcare grows fastest at 6.5% a year as clinic networks expand, shown when SHAPE fitted out the GenesisCare Playford Health Hub oncology clinic in Adelaide.
| Segment Group | Leading Sub-segment | Share, 2025 | Fastest-growing Sub-segment | CAGR, 2026–2035 |
|---|---|---|---|---|
| By Type | Construction & Installation | 72.0% | Design & Consulting | 5.9% |
| By Budget | Mid-Range | 46.0% | High-End Luxury | 6.0% |
| By End User | Corporate Offices | 38.0% | Healthcare | 6.5% |
Per-square-meter rates set the price of every project
Fit-out pricing is quoted per square meter of net lettable area and varies with specification, city and building condition. Published guides diverge widely, because each assumes a different scope of services, finishes and furniture, so the rows below should be read as ranges rather than tariffs. Labor and subcontract trades drive most of the movement in price, which is why Sydney and Melbourne rates sit above Brisbane and Perth in the Knight Frank guide. Clinic and retail rollout rates are Credence Research estimates, an evidence gap, since no public body publishes them.
| Project type | Typical price or fee | Basis |
|---|---|---|
| Office fit-out, Sydney average | AUD 1,334 per sqm | Knight Frank Fit-Out Cost Guide 2026, as reported by Real Estate Business, March 2026 |
| Office fit-out, Brisbane and Perth average | AUD 934 per sqm | Knight Frank Fit-Out Cost Guide 2026, as reported by Real Estate Business, March 2026 |
| Medical or urgent care clinic fit-out | AUD 2,500–4,500 per sqm | Credence Research estimate from clinical services and finish requirements |
| Retail store fit-out in a national rollout | AUD 1,200–2,800 per sqm | Credence Research estimate from joinery, lighting and signage scope |
Request a Free Sample
Fill in your details and we'll send you a free sample report.
- Sample data tables & charts
- Research methodology
Premium leasing, clinics and hotel upgrades widen demand
Flight to premium space forces older buildings to upgrade
The gap between premium and older offices is the strongest demand mechanism, because tenants relocate into better space and landlords of older stock must refurbish to compete. National office vacancy reached 14.9% in July 2026, according to Property Council data reported by AAP and the CommBank newsroom, while premium buildings recorded far lower vacancy than lower-grade stock. Canberra vacancy jumped to 14.7% from 10.4% in January as federal agencies moved into premium and A-grade buildings after a 2025 mandate to lease energy-efficient offices. Each relocation creates two projects, a new fit-out for the incoming tenant and a refurbishment of the vacated floor, which favors contractors that can price both sides of the move.
Occupiers plan to keep spending on workplace design
Occupier intentions support a steady refit cycle even with high vacancy, because firms use better workplaces to draw staff back to the office. According to the JLL survey of office occupiers published in May 2025, 72% of Australian organizations plan to increase investment in office design and fit-outs over the next five years, against a global average of 59%. The same release put the average Australian fit-out at AUD 3,220 per sqm, a cost level that has not reduced the spending plans of occupiers. Strong intent at these prices supports a mid-range refurbishment cycle that keeps national specialists and design studios busy even when few new towers complete.
A national clinic network adds health tenancies
Health care is adding new tenancies faster than any other end user, because federal funding turns general practice space into urgent care clinics that need clinical fit-outs. The government added 50 Medicare Urgent Care Clinics promised at the last federal election, lifting the network to 137 clinics, according to the Prime Minister. The final clinic opened at Caloundra in Queensland on June 17, 2026, and the government committed an additional AUD 1.8 billion over five years from 2025–26 to run the network. Clinic operators need treatment rooms, imaging space and infection-control finishes, which suit contractors with health experience. Ongoing operating funding also supports later refits, so health work should outlast the initial opening wave and help Healthcare grow at 6.5% a year.
Hotel owners refurbish as new room supply slows
Hotel owners are refurbishing existing assets rather than building new ones, because replacement costs make new hotels hard to finance. Colliers counted 2,339 new rooms in 2025, lifting national supply only 1.3% to 135,579 rooms, and said high replacement costs encourage refurbishment, according to eGlobal Travel Media in 2026. The same report put the cost of building an upscale multi-storey Sydney hotel above AUD 830,000 per room. SHAPE refurbished 528 guest rooms across 24 floors of the Hilton Sydney in 24 weeks while the hotel kept trading. Contractors able to work floor by floor in occupied buildings capture this demand, and hospitality and leisure grows faster than the market overall.
Reusable fit-outs and shopfitting roll-ups reshape delivery
Shift toward reusable, landlord-led fit-outs
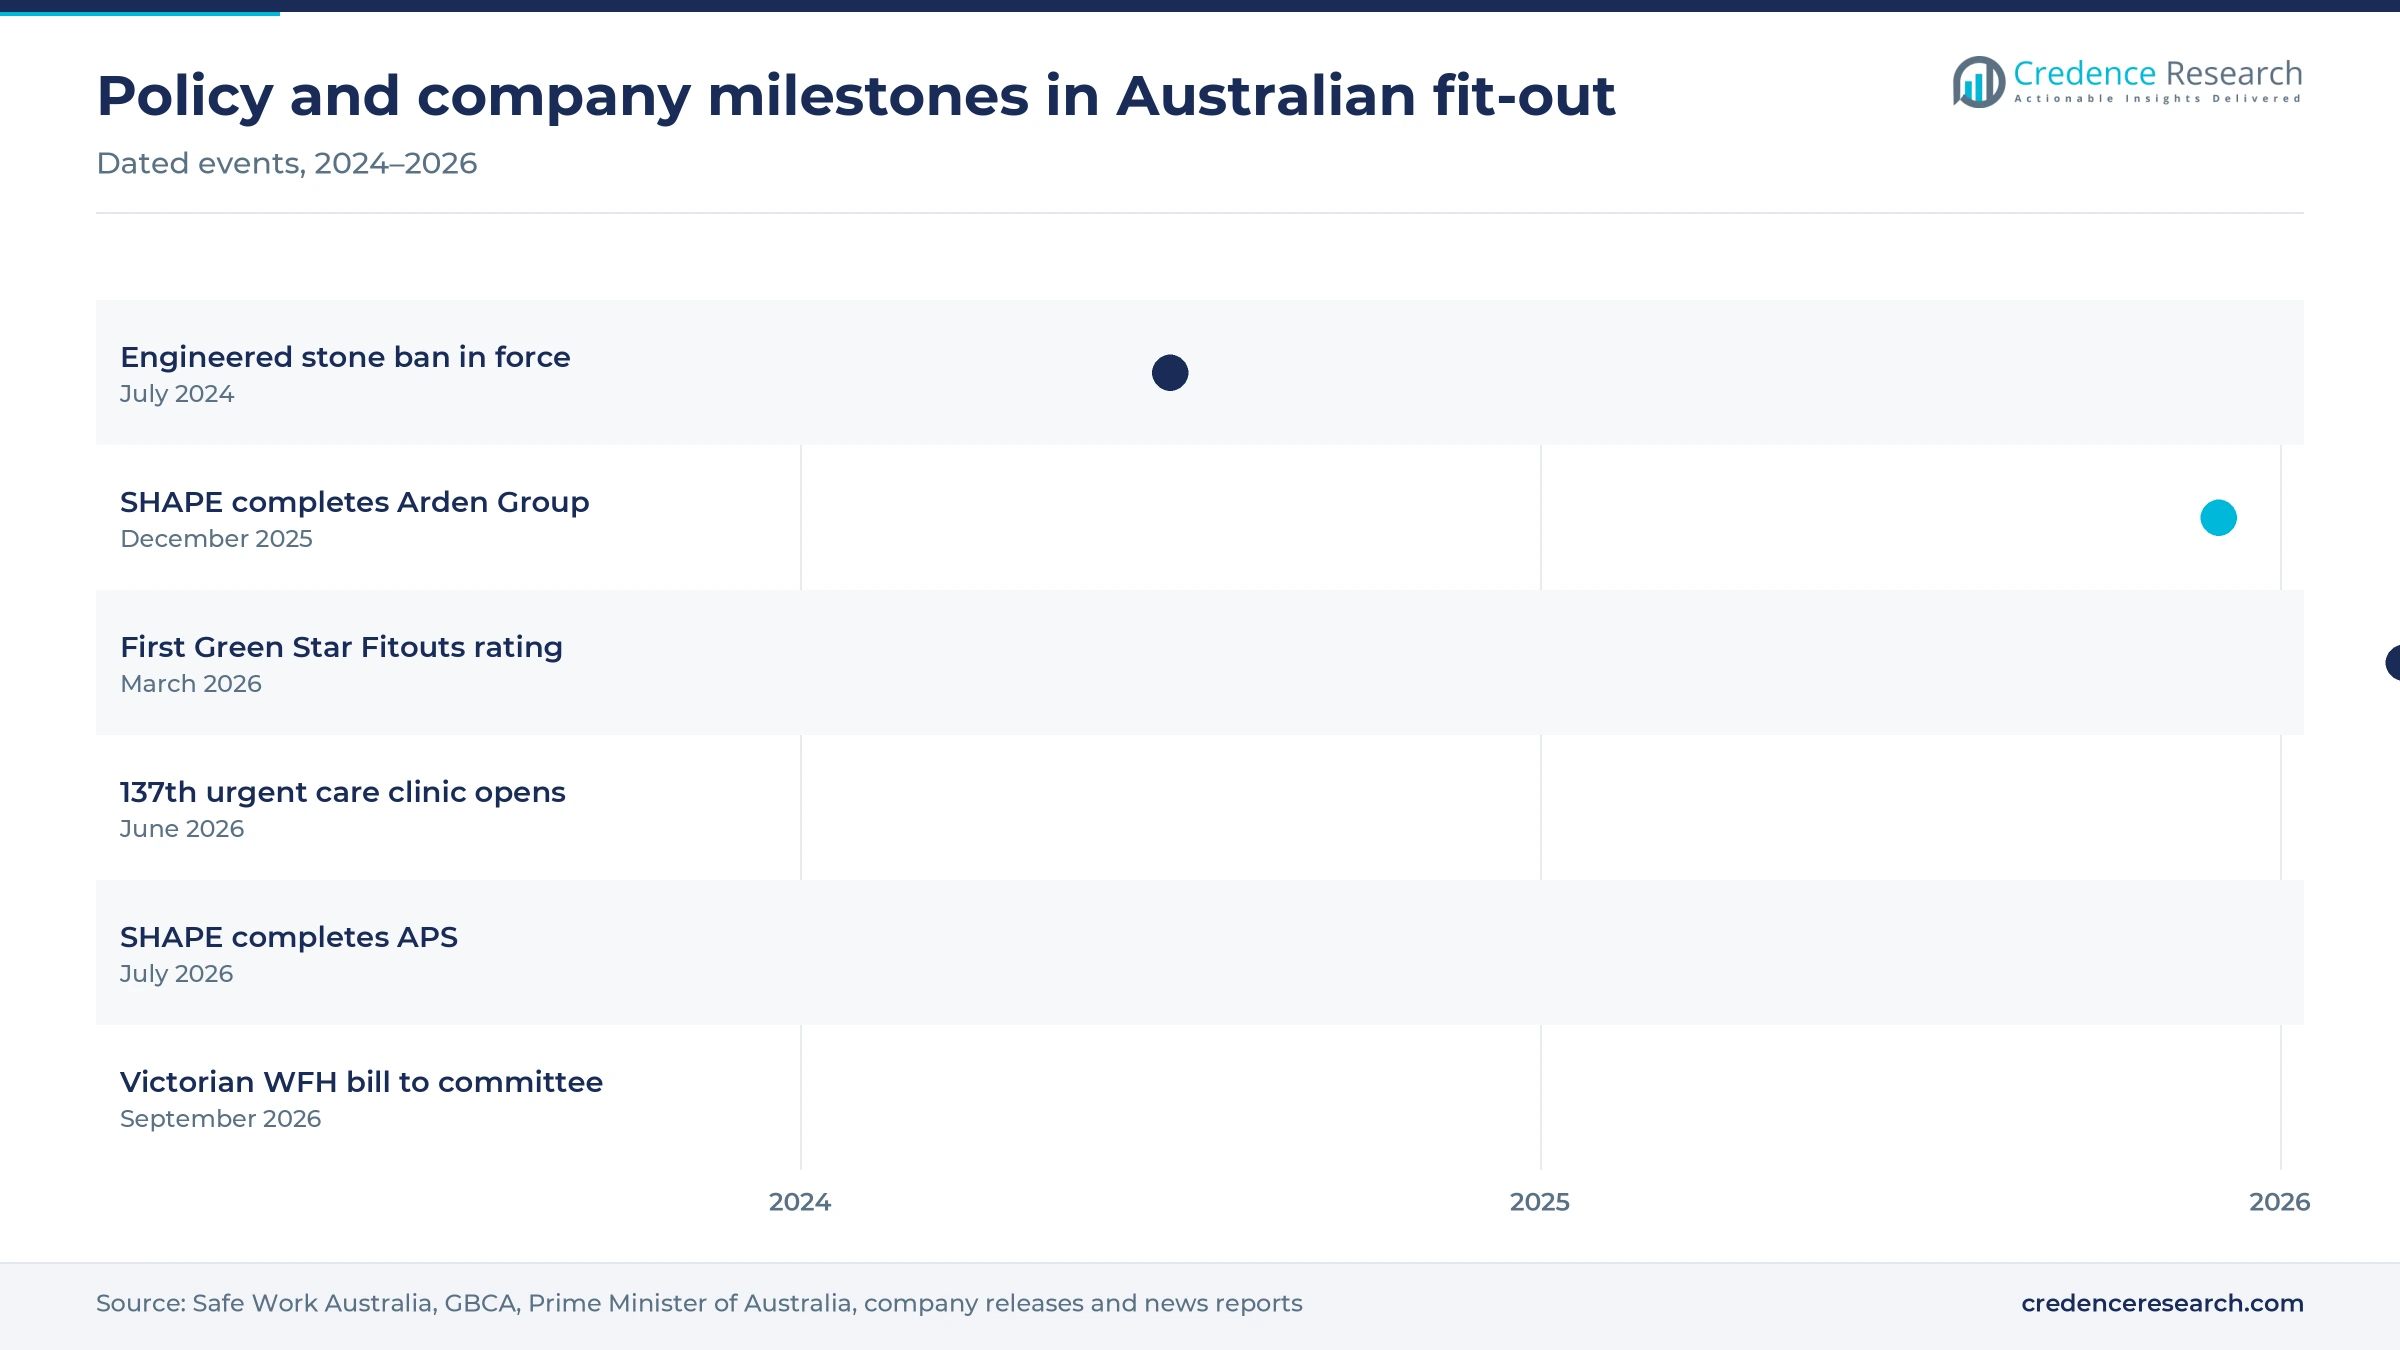
Landlords are shifting toward reusable, landlord-owned fit-outs to cut strip-out waste and shorten leasing times, which changes who buys the work. A Dexus fit-out at 1 Bligh Street in Sydney, designed with Woods Bagot, became the first project rated 5 Star under the Green Star Fitouts tool, according to a Green Building Council of Australia case study. The council announced that certification on March 18, 2026, and noted that traditional fit-outs can embed about 200 kg of carbon per sqm, largely from demolition and replacement. Dexus says its forever fitout model lets tenants move in within days rather than months and removes make-good works, and The Urban Developer reported in March 2026 that it is trialling a modular fitout model across several of its main office buildings. Suppliers of demountable partitions and modular construction systems stand to gain.
Rise of national contractors in retail shopfitting
Retail shopfitting is consolidating as national contractors buy specialist workshops to serve multi-site retailers. SHAPE Australia completed its purchase of Arden Group, a national retail multi-site fitout and facilities maintenance specialist, on Dec. 19, 2025, after announcing it on Nov. 12, 2025. It then completed the purchase of Australian Professional Shopfitters on July 1, 2026, a vertically integrated business that designs, manufactures and delivers store fitouts and has operated for more than 28 years. Owning manufacturing lets a contractor promise consistent rollouts across many stores at a fixed program, which smaller shopfitting contractors struggle to match. Retailers gain one national counterparty, while independent joinery shops face fewer direct contracts.
Opening in Queensland hotels and offices before 2032
Queensland offers the clearest geographic opening because hotel openings and office absorption are rising together ahead of the 2032 Games. Time Out counted 30 new hotels with 3,838 rooms open or under construction in the state in March 2025, including 11 hotels with 1,815 rooms still to open. Brisbane also absorbed about 39,000 sqm of office space in the first seven months of 2026, according to Property Council data reported by AAP. Hotel interiors for brands such as Kimpton and The Calile, alongside demand from luxury hotels and resorts, suit fit-out builders with hospitality teams. These openings help Queensland outgrow every other zone in fit-out demand through the forecast period.
Opening in design-led residential renovation
Home renovation is a sizable opening for design and joinery firms, because owners are upgrading kitchens, bathrooms and living spaces instead of moving. The Building Activity release of the Australian Bureau of Statistics put residential alterations and additions at AUD 3,728.2 million in the December quarter of 2025, up 4.9% on a year earlier. The national ban on engineered stone benchtops, panels and slabs, which took effect on July 1, 2024, according to Safe Work Australia, also forces designers to specify alternative surfaces for new kitchens and bathrooms. That rule shifts kitchen and bathroom specifications toward alternatives such as porcelain, natural stone and timber surfaces. Residential work held a share second only to offices in 2025, and designers who manage surface substitution can price at a premium.
Cost, insolvency, labor and hybrid-work rules test margins
Fit-out costs keep rising faster than budgets
Rising costs squeeze occupiers that signed leases before quotes were final. The JLL survey recorded a 14.59% rise in average Australian fit-out costs in 2025, and Knight Frank expects a further 2% to 5% increase over the 12 months from March 2026. Small and mid-sized tenants are most exposed, since they lack the volume to negotiate rates. Many respond by reusing existing ceilings, kitchens and meeting rooms, which shrinks contract value per square meter.
Contractor insolvencies raise delivery risk for clients
Insolvency risk remains high across building trades and the fit-out subcontractors that serve them. ASIC data reported by Accountants Daily on July 22, 2026, showed 3,472 construction companies entered external administration in 2025–26, the highest of any industry among 14,152 failures. Clients with deposits and subcontractors awaiting payment are most exposed when a fit-out builder fails mid-project. Larger clients now ask for bank guarantees and financial checks, which favors well-capitalized national contractors over small builders.
Skilled trade shortages stretch programs
Labor shortages lengthen fit-out programs and raise subcontract rates across most capital cities. The IMF staff concluding statement of November 2025 named skilled labor shortages and low construction productivity among the reasons the Australian housing imbalance persists, and the same trades serve interior work. Knight Frank expects the Queensland construction workforce shortfall to peak near 50,000 workers in 2026–27, just as Games projects compete for trades. Fit-out builders in Brisbane and on the Gold Coast face the tightest market, and clients may see later handovers.
Hybrid-work laws cloud office space planning
Uncertain hybrid-work rules make office occupiers hesitant about how much floor area to fit out. A Victorian bill to give eligible employees a legal right to work from home two days a week was referred to a select committee on Sept. 10, 2026, according to HCAMag, delaying its second reading. Melbourne occupiers and fit-out contractors are most exposed, since tenants may sign smaller leases or postpone refits until the rules are settled. Contractors offering staged or reconfigurable layouts reduce that risk for buyers.
Sydney leads as Queensland adds pre-Games fit-out demand
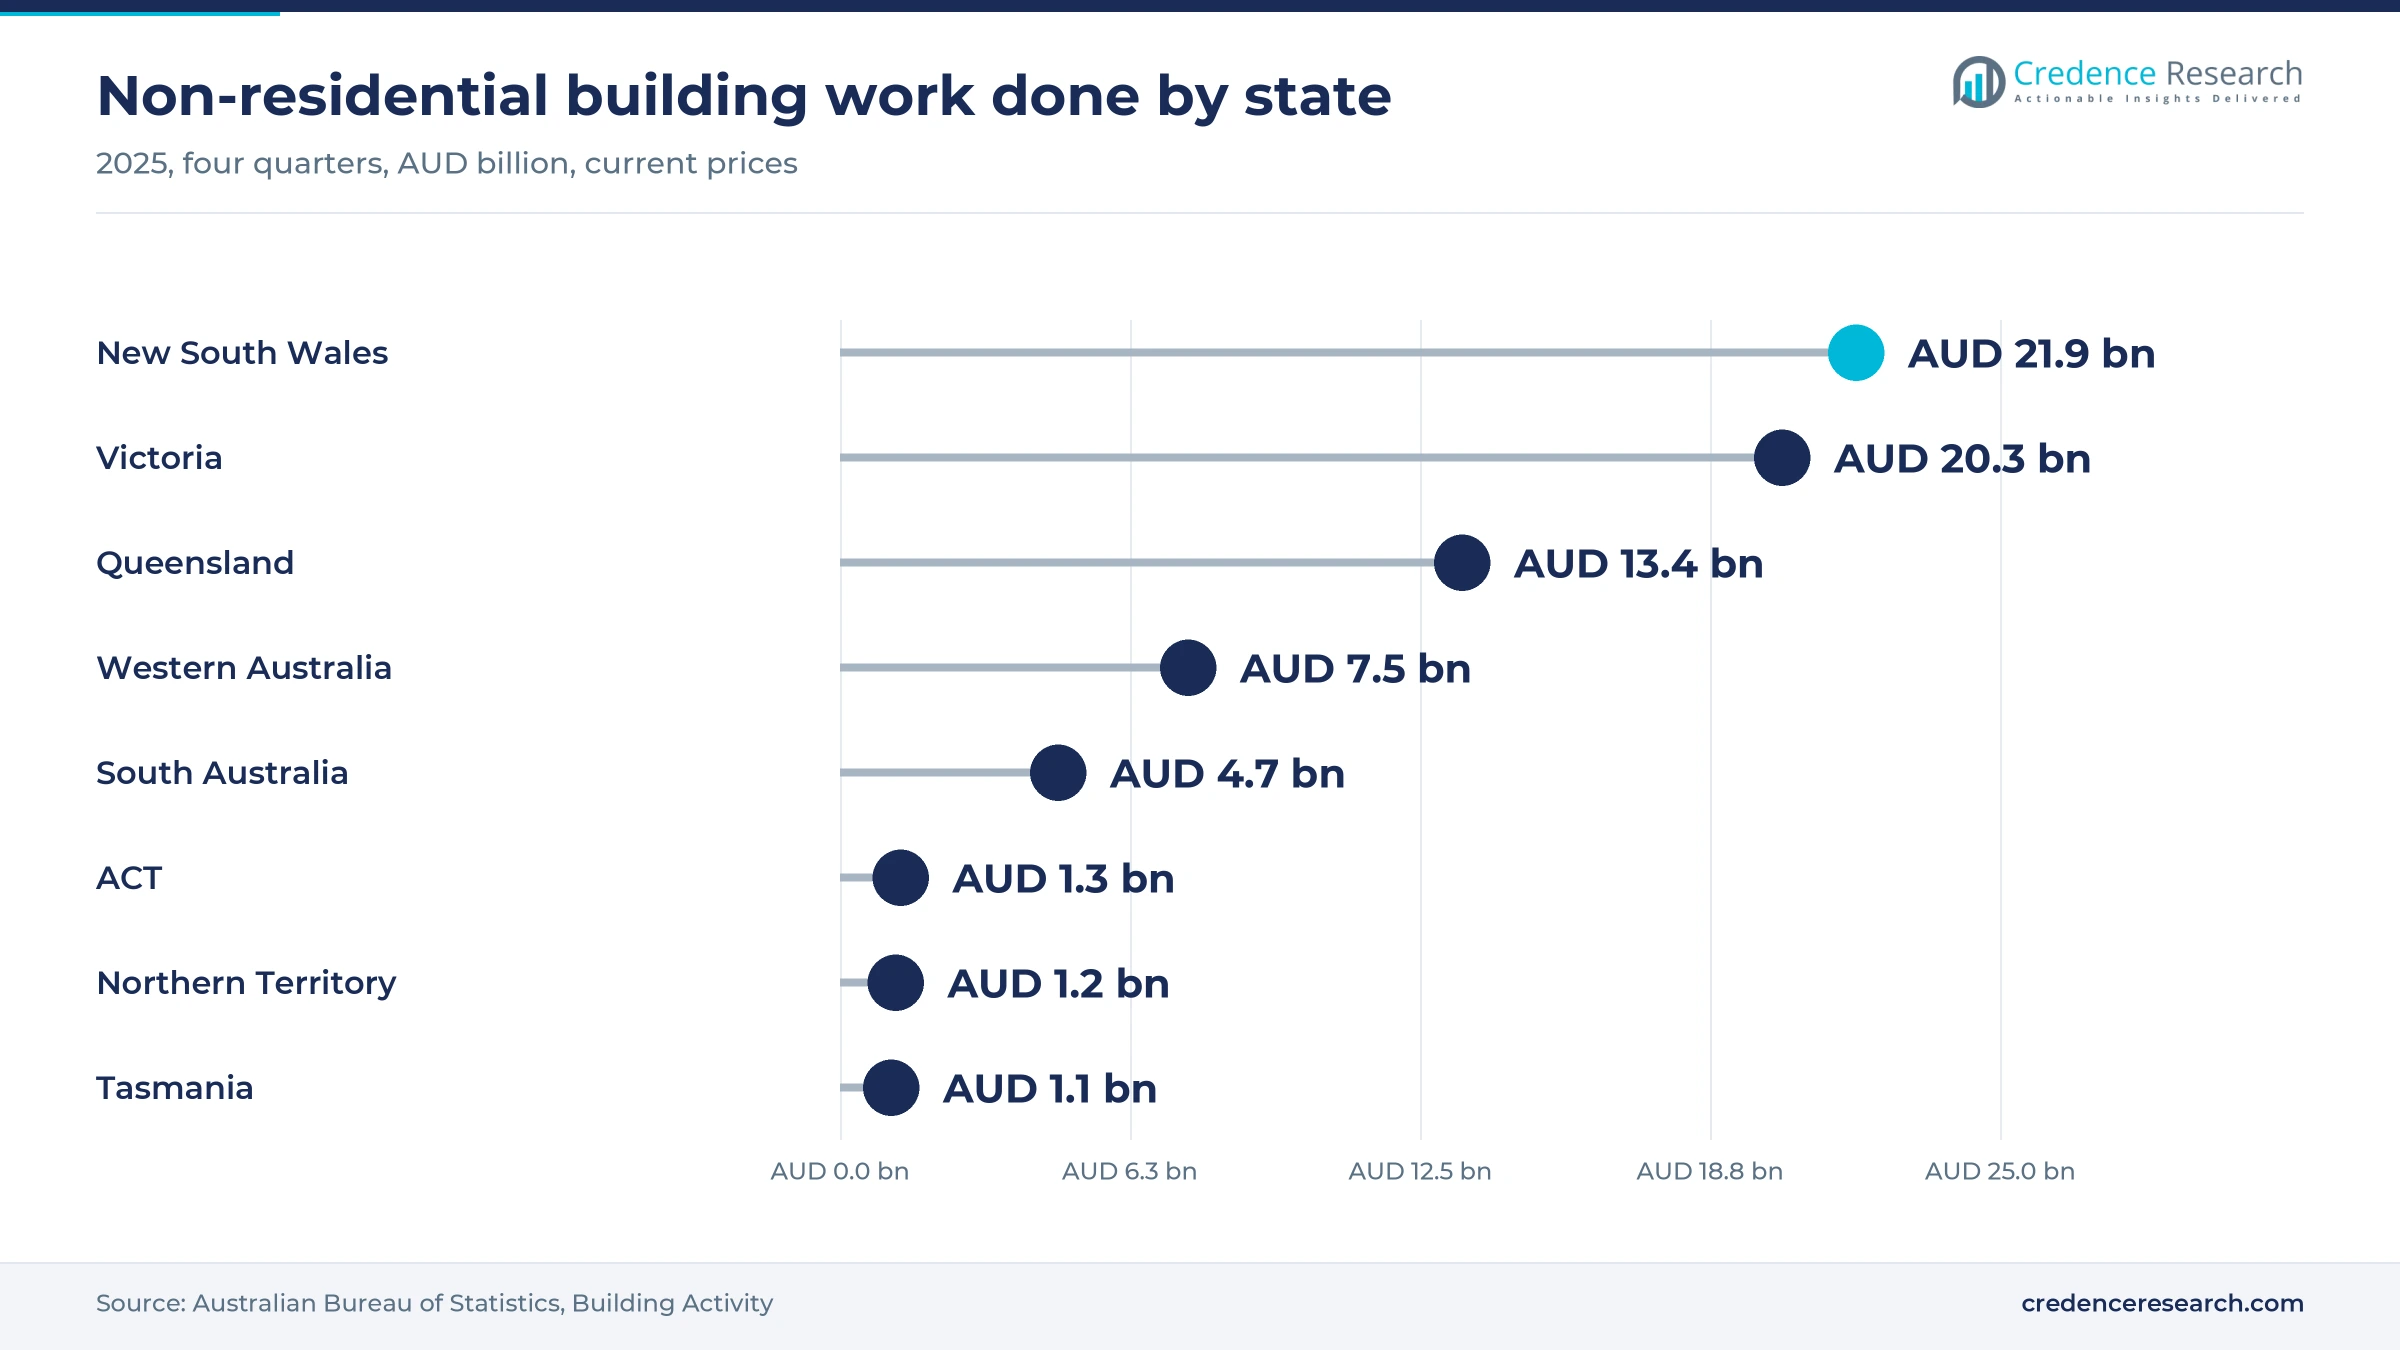
Zone shares are Credence Research estimates derived from the value of building work done by state in 2025, as reported by the Australian Bureau of Statistics, with an adjustment for Sydney office stock. New South Wales, Victoria and Queensland together account for most fit-out spending in the country.
| Region | Value, 2025 (USD billion) | Share, 2025 | CAGR, 2026–2035 |
|---|---|---|---|
| New South Wales | 1.43 | 32.0% | 5.0% |
| Victoria | 1.25 | 28.0% | 4.8% |
| Queensland | 0.87 | 19.5% | 6.1% |
| Rest of Australia | 0.47 | 10.5% | 5.3% |
| Western Australia | 0.45 | 10.0% | 5.4% |
New South Wales holds the largest office base
New South Wales held 32.0% of 2025 value and grows at 5.0% a year, because Sydney has the largest CBD office market and the most corporate headquarters in the country. The Australian Bureau of Statistics recorded about AUD 21.9 billion of non-residential building work in the state in 2025, the highest of any state. Sydney also expects 277,048 sqm of new office supply by 2027, about half pre-committed, according to Property Council figures reported by The Urban Developer in February 2025.
Victoria faces high vacancy but steady upgrades
Victoria held 28.0% of 2025 value and grows at 4.8% a year, the slowest zone, as Melbourne CBD vacancy stood at 18.9% in July 2026, according to the Property Council. Melbourne still absorbed more than 76,000 sqm of office space in that period, a sign of steady tenant demand. Over 29,000 sqm will return to the market through major refurbishments in 2027, adding further fit-out demand. Melbourne also added more than 1,014 hotel rooms in 2025, the largest net increase nationally, which supports hospitality fit-out demand.
Queensland is the fastest-growing zone before 2032
Queensland held 19.5% of 2025 value and is the fastest zone at 6.1% a year, supported by the hotel openings and office absorption described in the trends. Brisbane expects 162,630 sqm of new office supply by 2027, with 67.9% pre-committed, according to Property Council figures reported by The Urban Developer. That pre-commitment locks in fit-out demand for 2026 and 2027. A high pre-commitment rate means fit-outs are already contracted or in design, which gives Brisbane builders better visibility than contractors in southern capitals.
Western Australia shows firm absorption and lower costs
Western Australia held 10.0% of 2025 value and grows at 5.4% a year, from a smaller office base than the east coast capitals. Perth absorbed about 27,500 sqm of office space in the first seven months of 2026, a sign of firm demand, according to Property Council data reported by AAP. Knight Frank placed Perth with Brisbane among the most affordable Australian capitals for office fit-outs, which lets occupiers specify more for the same budget than in Sydney or Melbourne.
Rest of Australia combines Canberra moves and Adelaide upgrades
Rest of Australia, which covers South Australia, Tasmania, the ACT and the Northern Territory, held 10.5% of 2025 value and grows at 5.3% a year. Canberra demand comes from federal agencies moving into premium buildings under the energy-efficiency leasing mandate noted above. Adelaide CBD vacancy rose to 16.3% in July 2026, according to the Property Council. C-grade vacancy jumped to 19.1% from 12.1%, the clearest sign of weak demand for older space, so Adelaide owners must refurbish to win tenants back.
Acquisitions, ratings and clinic openings mark 2025–2026
| Development | Status and market relevance |
|---|---|
| In July 2026, SHAPE Australia completed its acquisition of Australian Professional Shopfitters, adding in-house design, manufacturing and delivery for multi-site retailers. | Completed; deal announced in May 2026 |
| In June 2026, the final Medicare Urgent Care Clinic opened in Queensland, bringing the national network to 137 clinics. | Completed; network now in operation |
| In March 2026, the Green Building Council of Australia certified the first project under its Green Star Fitouts tool, a Dexus fit-out at 1 Bligh Street in Sydney. | Certified; tool open for registrations nationwide |
| In December 2025, SHAPE Australia completed its acquisition of Arden Group, a national retail multi-site fitout and facilities maintenance specialist. | Completed; deal announced in November 2025 |
| In September 2026, the Victorian Parliament referred the work from home bill to a select committee, deferring its second reading. | Bill under committee review; not yet law |
Modular systems, digital estimating and low-carbon specs
- Demountable and modular systems let landlords reuse partitions, ceilings and joinery across successive tenancies, which the Green Star Fitouts circularity category rewards and which shortens the time between lease signing and occupation.
- Digital estimating and 3D coordination help contractors price live-environment projects floor by floor, test services routes before work starts and reduce costly clashes between ductwork, ceilings and joinery.
- Low-carbon material specifications cut the embodied carbon of finishes, flooring and furniture, a growing tender criterion for government agencies and institutional landlords that report emissions.
- Off-site joinery manufacturing gives rollout contractors control over quality, cost and program for store and clinic formats, which explains the recent purchases of vertically integrated shopfitters.
Need a Custom Version of This Report?
Tailor the scope, geography, or segments to your exact requirements.
- Custom geography or segment scope
- Direct access to our analyst team
National specialists face hundreds of regional builders
Competition in interior fit out work splits between national fit-out specialists, regional builders, design studios and specialist shopfitters. SHAPE Australia operates in every capital city and in regional centers, and its retail acquisitions add owned manufacturing for store rollouts. Built, Schiavello, FDC Construction & Fitout and Buildcorp compete for corporate workplaces, government tenancies and refurbishments, often in live buildings. Hutchinson Builders brings Queensland depth across office, hospitality and health projects. Unispace combines design and construction for corporate occupiers from its Sydney headquarters. Woods Bagot, Hassell and Gensler lead design for large workplaces and influence which builders are shortlisted. Buyers weigh delivery record in occupied buildings, financial strength, repeat-client references and cost certainty more heavily than headline price, especially after recent builder insolvencies.
How is the fit-out supply side organized?
The supply side is fragmented, with a handful of national specialists above hundreds of regional builders, joinery shops and trade subcontractors. National firms such as SHAPE Australia, Built and Schiavello win the largest corporate and government projects, while design studios such as Woods Bagot, Hassell and Gensler shape specifications before tender. Entry barriers are low for small refits but high for large live-environment projects, which need balance sheet strength, safety systems and bank guarantees. Margins sit with firms that own joinery manufacturing or win repeat clients, since tender pricing on one-off jobs is thin.
Companies profiled and their roles in this market
| Company | Type | Role in the market |
|---|---|---|
| SHAPE Australia | National fit-out specialist | Office, health, hotel and retail fit-outs and refurbishments in every capital city |
| Built | National builder | Commercial, retail and hospitality fit-outs and high-end refurbishments |
| Schiavello | Fit-out builder and furniture maker | Workplace fit-outs and refurbishments, mainly in Melbourne and Sydney |
| FDC Construction & Fitout | Construction and fit-out contractor | Fit-out, refurbishment and building services for corporate and government clients |
| Buildcorp | Fit-out and construction contractor | Workplace, speculative suite and lobby fit-outs for landlords and tenants |
| Hutchinson Builders | Builder with interiors work | Office, hospitality and health fit-outs with strong Queensland presence |
| Unispace | Design and construct specialist | Workplace strategy, design and delivery for corporate occupiers |
| Woods Bagot | Design studio | Workplace interior design, including the first Green Star Fitouts certified project |
| Hassell | Design studio | Workplace, hospitality and education interior design for large projects |
| Gensler | Design studio | Workplace, hospitality and residential interior design from its Sydney studio |
Refurbishment skill and cost certainty will decide winners
Credence Research's view is that the Australia interior fit out market has turned into a refurbishment business, and contractors that win in occupied buildings will take most of the growth. Premium relocations, clinic openings and hotel upgrades give steady volume, but cost inflation and builder failures make buyers favor balance sheet strength over price. The main assumption behind the forecast is that office floor area holds broadly steady despite hybrid work, and the largest evidence gap is the absence of an official fit-out spending series.
ABS building data and occupier surveys anchor this estimate
The report uses 2025 as the base year and 2035 as the final forecast year, with market values from the Credence Research model. The 2025 interior fit out value was rebuilt top-down from Australian Bureau of Statistics building activity data and cross-checked against office stock and published cost rates. The Australian Bureau of Statistics recorded about AUD 17.0 billion of non-residential building work in the December quarter of 2025 alone, and applying estimated fit-out shares to that work and to residential alterations gives a range of about USD 4.4 billion to USD 6.1 billion, with the estimate set at the lower end because no official series isolates fit-out spending. This replaces the much smaller earlier estimate on this page, which could not be reconciled with ABS alterations data. Segment and zone splits are Credence Research estimates informed by Property Council data, occupier surveys, cost guides, government programs and company releases. No interviews or surveys were conducted, and the splits should be read as analytical estimates.
Refits, clinics and Queensland projects carry growth to 2035
The Australia interior fit out market is forecast to reach USD 7.44 billion by 2035 from USD 4.71 billion in 2026, a 5.20% CAGR over 2026–2035. Early years should bring office relocations into premium towers, refurbishment of vacated older floors and the completion of clinic and hotel projects already under way. Later in the period, growth should shift toward reusable landlord-led fit-outs, Queensland hospitality work before 2032 and design-led home renovation. New South Wales should remain the largest zone, although Queensland gains share. Contractors with live-building expertise, owned manufacturing and strong balance sheets should capture most of this growth.
What decides the range of 2035 outcomes?
The range of outcomes depends on how quickly older offices are refurbished, whether hybrid-work rules shrink floor plates and how many hotel projects reach construction before 2032. A downside case assumes cost inflation and contractor failures delay refits. The upside case assumes reusable fit-outs and clinic refits lift repeat work while Queensland projects stay on program.
| Scenario | CAGR, 2026–2035 | Value, 2035 | What has to hold |
|---|---|---|---|
| Downside | 3.6% | USD 6.48 billion | Cost inflation, insolvencies and smaller leases delay office and hotel refits |
| Base | 5.20% | USD 7.44 billion | Flight to premium space and clinic openings sustain a steady refit cycle |
| Upside | 6.6% | USD 8.38 billion | Queensland hotels stay on program and landlords adopt reusable fit-outs widely |
Frequently Asked Questions
How big is the Australia interior fit out market?
Which end user commissions the most fit-out work?
What does an office fit-out cost per square meter in Sydney?
Who are the leading interior fit-out contractors in Australia?
How is the shopfitting industry changing in Australia?
What are the latest trends in medical center fit-outs?
Which region holds the largest share?
What is the main risk for fit-out buyers?
Table of Content
Chapter 1 Market Segmentation
- 1.1 Segmentation Framework
- 1.1.1 Product and Service Classification
- 1.1.2 Application and End-Use Classification
- 1.1.3 Technology and Solution Classification
- 1.1.4 Customer and Distribution Channel Classification
- 1.1.5 Geographic Segmentation
- 1.1.6 Market Segment Definitions and Boundaries
- 1.2 By Type
- 1.2.1 Construction & Installation
- 1.2.2 Design & Consulting
- 1.2.3 Others
- 1.3 By Budget
- 1.3.1 Mid-Range
- 1.3.2 Low Budget
- 1.3.3 High-End Luxury
- 1.4 By End User
- 1.4.1 Corporate Offices
- 1.4.2 Residential
- 1.4.3 Retail
- 1.4.4 Hospitality & Leisure
- 1.4.5 Healthcare
- 1.4.6 Educational
Chapter 2 Introduction
- 2.1 Report Objectives and Scope
- 2.2 Product Definition and Industry Terminology
- 2.3 Market Inclusions and Exclusions
- 2.4 Research Process
- 2.4.1 Primary Research and Expert Interviews
- 2.4.2 Secondary Research and Source Review
- 2.4.3 Top-Down and Bottom-Up Estimation
- 2.4.4 Data Triangulation and Verification
- 2.5 Market Size Measurement Basis
- 2.5.1 2025: USD 4.48 billion → 2035: USD 7.44 billion
- 2.6 Historical and Forecast Reference Periods
- 2.6.1 Historical Period: 2018-2025
- 2.6.2 Base Year: 2025
- 2.6.3 Forecast Period: 2025-2035
- 2.7 Research Assumptions and Limitations
Chapter 3 Executive Summary
- 3.1 Market Snapshot and Key Findings
- 3.2 Base-Year Market Size, 2025
- 3.3 Forecast Market Size, 2035
- 3.4 Revenue and Volume Growth Outlook
- 3.5 Key Demand and Supply Indicators
- 3.6 Leading Market Segments
- 3.7 Fastest-Growing Market Opportunities
- 3.8 Regional Performance Highlights
- 3.9 Technology and Industry Transformation
- 3.10 Competitive Landscape Summary
- 3.11 Analyst View and Strategic Implications
Chapter 4 Australia Interior Fit Out Market Trends and Developments
- 4.1 Historical Industry Development, 2018-2025
- 4.2 Recent Market Trends and Developments
- 4.3 Demand and Customer Behavior Trends
- 4.4 Technology and Product Innovation
- 4.5 Artificial Intelligence, Automation and Digitalization
- 4.6 Local Manufacturing and Supply Chain Realignment
- 4.7 Industry Partnerships, Mergers and Acquisitions
- 4.8 Sustainability and Circular Economy Developments
- 4.9 Government and Private Sector Investment Trends
- 4.10 Emerging Business Models and Commercialization
- 4.11 Industry Developments and Announcements
Chapter 5 Australia Interior Fit Out Market Production, Supply and Demand Analysis
- 5.1 Demand Trend and Consumption Analysis, 2018-2025
- 5.2 Demand Forecast, 2025-2035
- 5.3 Production and Output Trend, 2018-2025
- 5.4 Production and Output Forecast, 2025-2035
- 5.5 Installed Capacity and Capacity Utilization
- 5.6 Company-Wise Production Plants and Statistics
- 5.6.1 Installed Production Capacity
- 5.6.2 Actual Production
- 5.6.3 Planned Capacity and Expansion Targets
- 5.7 Supply Chain Structure and Procurement Trends
- 5.8 Supply-Demand Gap and Bottlenecks
- 5.9 Import Dependence and Sourcing Structure
- 5.10 Contract Manufacturing and Outsourcing
- 5.11 Regional Supply and Demand Concentration
Chapter 6 Australia Interior Fit Out Market Pricing Analysis
- 6.1 Pricing Structure and Measurement
- 6.2 Historical Pricing Trends, 2018-2025
- 6.3 Pricing Outlook, 2025-2035
- 6.4 Average Selling Price and Unit Economics
- 6.5 Pricing by Product and Market Segment
- 6.6 Geographic Pricing Differences
- 6.7 Key Input, Energy, Labor and Logistics Costs
- 6.8 Contract Pricing and Purchasing Models
- 6.9 Pricing Sensitivity and Competitive Positioning
- 6.10 Price, Margin and Profitability Implications
Chapter 7 Australia Interior Fit Out Market Dynamics
- 7.1 Market Growth Drivers
- 7.1.1 Demand-Side Drivers
- 7.1.2 Technology and Innovation Drivers
- 7.1.3 Infrastructure and Investment Drivers
- 7.1.4 Regulatory and Policy Drivers
- 7.2 Market Restraints
- 7.2.1 Cost and Affordability Constraints
- 7.2.2 Technology and Adoption Barriers
- 7.2.3 Supply Chain and Operational Constraints
- 7.3 Market Challenges
- 7.3.1 Competitive Pressure and Margin Erosion
- 7.3.2 Skills, Infrastructure and Implementation Gaps
- 7.4 Emerging Market Opportunities
- 7.5 Market Dynamics Impact and Time-Horizon Assessment
Chapter 8 Australia Interior Fit Out Value Chain Analysis
- 8.1 Industry Value Chain Overview
- 8.2 Upstream Suppliers and Critical Inputs
- 8.3 Technology and Component Providers
- 8.4 Manufacturing or Service Delivery
- 8.5 Distribution, Channel Partners and Integrators
- 8.6 Downstream Applications and End Users
- 8.7 Value Addition and Profit Pools
- 8.8 Vertical Integration and Outsourcing
- 8.9 Supplier Concentration and Risk
- 8.10 Supply Chain Localization and Resilience
Chapter 9 Australia Interior Fit Out Market Regulations and Policies
- 9.1 Relevant Laws, Standards and Compliance Frameworks
- 9.2 Product, Service, Safety and Quality Requirements
- 9.3 Government Policies, Incentives and Subsidies
- 9.4 Imports, Exports and Trade Barriers
- 9.5 Public Procurement and Local Content Requirements
- 9.6 Environmental and Sustainability Compliance
- 9.7 Upcoming Policy Changes and Market Implications
Chapter 10 Australia Interior Fit Out Market Hotspots and Opportunities
- 10.1 Market Opportunity Mapping and Growth Hotspots
- 10.2 High-Growth Applications and Customer Groups
- 10.3 Underserved Markets and White-Space Opportunities
- 10.4 Emerging Technology and Product Opportunities
- 10.5 New Capacity and Investment Hotspots
- 10.6 Market Entry and Expansion Opportunities
- 10.7 Distribution and Partnership Opportunities
- 10.8 Near-Term and Long-Term Commercial Potential
- 10.9 Opportunity Attractiveness and Execution Risks
Chapter 11 Australia Interior Fit Out Market Outlook, 2025-2035
- 11.1 Market Size and Analysis
- 11.1.1 Revenue (Market Measurement: 2025: USD 4.48 billion → 2035: USD 7.44 billion)
- 11.1.2 Market Volume and Quantity Sold
- 11.1.3 Historical Market Size, 2018-2025
- 11.1.4 Base-Year Market Size, 2025
- 11.2 Market Forecast, 2025-2035
- 11.2.1 Revenue Forecast to 2035
- 11.2.2 Volume Forecast to 2035
- 11.2.3 CAGR and Year-on-Year Growth
- 11.2.4 Incremental Revenue Opportunity
- 11.3 Forecast Assumptions and Scenario Analysis
- 11.3.1 Base-Case Forecast
- 11.3.2 Optimistic and Conservative Scenarios
- 11.3.3 Technology, Pricing and Policy Sensitivities
- 11.4 Market Attractiveness and Growth Outlook
Chapter 12 Australia Interior Fit Out Market Segmentation and Outlook
- 12.1 Segmentation Summary and Market Shares, 2025
- 12.2 Largest and Fastest-Growing Segments
- 12.3 By Type - Market Size and Forecast, 2025-2035
- 12.3.1 Segment Definition and Scope
- 12.3.2 Historical Market Size, 2018-2025
- 12.3.3 Revenue Forecast, 2025-2035
- 12.3.4 Volume Forecast, 2025-2035
- 12.3.5 Base-Year Market Share, 2025
- 12.3.6 Segment CAGR and Growth Drivers
- 12.3.7 Subsegment Market Size and Forecast
- 12.3.7.1 Construction & Installation
- 12.3.7.2 Design & Consulting
- 12.3.7.3 Others
- 12.3.8 Subsegment Pricing and Adoption Trends
- 12.3.9 Leading Suppliers and Competition
- 12.3.10 Regional Demand and Opportunities
- 12.4 By Budget - Market Size and Forecast, 2025-2035
- 12.4.1 Segment Definition and Scope
- 12.4.2 Historical Market Size, 2018-2025
- 12.4.3 Revenue Forecast, 2025-2035
- 12.4.4 Volume Forecast, 2025-2035
- 12.4.5 Base-Year Market Share, 2025
- 12.4.6 Segment CAGR and Growth Drivers
- 12.4.7 Subsegment Market Size and Forecast
- 12.4.7.1 Mid-Range
- 12.4.7.2 Low Budget
- 12.4.7.3 High-End Luxury
- 12.4.8 Subsegment Pricing and Adoption Trends
- 12.4.9 Leading Suppliers and Competition
- 12.4.10 Regional Demand and Opportunities
- 12.5 By End User - Market Size and Forecast, 2025-2035
- 12.5.1 Segment Definition and Scope
- 12.5.2 Historical Market Size, 2018-2025
- 12.5.3 Revenue Forecast, 2025-2035
- 12.5.4 Volume Forecast, 2025-2035
- 12.5.5 Base-Year Market Share, 2025
- 12.5.6 Segment CAGR and Growth Drivers
- 12.5.7 Subsegment Market Size and Forecast
- 12.5.7.1 Corporate Offices
- 12.5.7.2 Residential
- 12.5.7.3 Retail
- 12.5.7.4 Hospitality & Leisure
- 12.5.7.5 Healthcare
- 12.5.7.6 Educational
- 12.5.8 Subsegment Pricing and Adoption Trends
- 12.5.9 Leading Suppliers and Competition
- 12.5.10 Regional Demand and Opportunities
- 12.6 Segment Growth Comparison
- 12.7 Segment Attractiveness and Priority Matrix
Chapter 13 Australia Interior Fit Out End-Use and Application Market Outlook
- 13.1 End-Use Industry and Customer Demand Structure
- 13.2 Leading Applications and Customer Groups
- 13.3 End-Use Market Size, Share and Forecast
- 13.4 Major End-Use Industry Deep Dives
- 13.4.1 Customer Requirements and Use Cases
- 13.4.2 Demand and Replacement Cycles
- 13.4.3 Technical and Regulatory Considerations
- 13.4.4 Purchasing and Procurement Models
- 13.4.5 Leading Vendors and Distribution Channels
- 13.4.6 Forecast and Commercial Opportunities
- 13.5 Emerging Applications and Cross-Segment Demand
- 13.6 End-Use Industry Investment Priorities
Chapter 14 Australia Interior Fit Out Geographic Market Outlook, 2025-2035
- 14.1 Domestic Market Distribution and Demand Clusters
- 14.2 State- or Province-Wise Market Size and Forecast, 2025-2035
- 14.3 City and Metropolitan Market Outlook
- 14.4 Industrial, Manufacturing and Commercial Clusters
- 14.5 Geographic Concentration of Key End Users
- 14.6 Local Pricing and Purchasing Differences
- 14.7 Domestic Production Facilities and Capacity Map
- 14.8 Local Infrastructure and Project Pipeline
- 14.9 State-Level Policy and Incentive Differences
- 14.10 Subnational Investment Hotspots and Opportunities
- 14.11 Distribution and Logistics Networks
- 14.12 Domestic Competitive Footprint
Chapter 15 Australia Interior Fit Out Technology, Innovation and Sustainability Outlook
- 15.1 Technology Landscape and Maturity
- 15.2 Product, Process and Service Innovation
- 15.3 AI, Automation and Digital Tools in the Industry
- 15.4 Technology Adoption and Performance Benchmarking
- 15.5 Innovation Pipeline and R&D Investment
- 15.6 Patent and Intellectual Property Trends
- 15.7 Energy Efficiency and Resource Management
- 15.8 Sustainability, Recycling and Circularity
- 15.9 Technology Roadmap, 2025-2035
- 15.10 Risks of Obsolescence and Technology Substitution
Chapter 16 Australia Interior Fit Out Market Key Strategic Imperatives
- 16.1 Growth and Market Entry Priorities
- 16.2 High-Return Products and Segments
- 16.3 Pricing, Profitability and Cost Optimization
- 16.4 Technology Investment and Product Differentiation
- 16.5 Supply Chain Localization and Resilience
- 16.6 Distribution and Customer Acquisition
- 16.7 Partnership, Acquisition and Capacity Strategy
- 16.8 Regional Expansion Priorities
- 16.9 Short-, Medium- and Long-Term Actions
Chapter 17 Competition Outlook
- 17.1 Industry Competition Characteristics
- 17.2 Market Structure and Concentration
- 17.3 Market Share and Competitive Positioning, 2025
- 17.4 Company-Wise Revenue and Product Benchmarking
- 17.5 Production and Service Capacity Benchmarking
- 17.6 Technology, Pricing and Differentiation
- 17.7 Regional Footprint and Distribution Strength
- 17.8 Mergers, Acquisitions and Strategic Alliances
- 17.9 New Entrants and Competitive Threats
- 17.10 Porter's Five Forces and Industry Attractiveness
- 17.11 Competitive Outlook, 2025-2035
Chapter 18 Company Profiles
- 18.1 Company Coverage and Selection Criteria
- 18.2 SHAPE Australia
- 18.2.1 Business Description
- 18.2.2 Company Ownership and Geographic Presence
- 18.2.3 Product and Service Portfolio
- 18.2.4 Manufacturing and Operating Footprint
- 18.2.5 Production Capacity and Expansion Plans
- 18.2.6 Financial Performance and Investment
- 18.2.7 Market Share and Competitive Position
- 18.2.8 Technology and Innovation Capabilities
- 18.2.9 Strategic Alliances or Partnerships
- 18.2.10 Recent Developments
- 18.2.11 Growth Strategy and Outlook
- 18.3 Built
- 18.4 Schiavello
- 18.5 FDC Construction & Fitout
- 18.6 Buildcorp
- 18.7 Hutchinson Builders
- 18.8 Unispace
- 18.9 Woods Bagot
- 18.10 Hassell
- 18.11 Gensler
- 18.12 Other Relevant Market Participants
Note: Every listed company is profiled on the structure shown under the first company. The company list is preliminary and may change based on research findings, market developments, data availability and client requirements.
Chapter 19 Disclaimer
- 19.1 Research and Forecast Disclaimer
- 19.2 Data Source and Estimation Limitations
Note: The depth of individual sections depends on data availability for this market. Volume, capacity, trade and other unit-based metrics are included where applicable.

