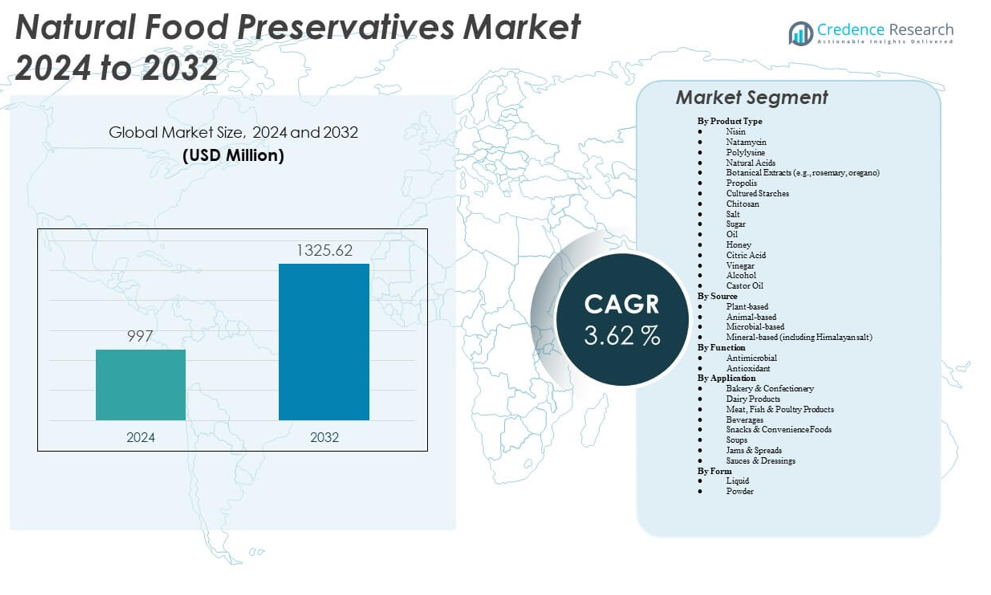
Home » Food & Beverage » Natural Food Preservatives Market

Natural Food Preservatives Market By Type (Salt, Sugar, Oil, Honey, Citric Acid, Vinegar, Others) By Function (Antimicrobial, Antioxidants, Others) -Growth, Future Prospects & Competitive Analysis, 2016 – 2030

Price: $4999

Published: | Report ID: 20254 | Report Format : PDF

Actionable Insights Delivered – Natural Food Preservatives Market Size

Positioned with a USD 0.4 Billion valuation in 2022, the Natural Food Preservatives Market asserted its global eminence. Set to scale to USD 0.6 Billion by 2030, the market’s remarkable Compound Annual Growth Rate (CAGR) of 7.2% (2022-2030) underscores its strategic growth trajectory.

Key Highlights of the Report

The global natural food preservatives market is segmented by type, function, application, and region. Salt AND Seafood, meat & poultry are widely used. In contrast, antimicrobial is a widely utilized segment. Europe is leading the market growth.

Growing consumer desire for products with clean labels and natural ingredients and rising public awareness of the potential health hazards connected with synthetic preservatives are two factors driving the market for natural food preservatives. Natural preservatives are more expensive and less widely available than synthetic counterparts, which is a market limitation.

Nonetheless, the global natural food preservatives market is the growing popularity of organic and natural food products, which expands the market for natural preservatives, and the growing emphasis on sustainability and environmentally friendly practices, which is consistent with the use of natural preservatives derived from renewable sources, present two opportunities for the market for natural food preservatives. Additionally, there is a chance for natural food preservatives to replace synthetic additives in various food Functions due to the rising desire for products with clean labels.

What Are The Main Drivers Of The Global Natural Food Preservatives Market?

Due to worries about chemical ingredients and preservatives, consumers are increasingly interested in natural and clean-label products. Consumers are looking for natural alternatives, including natural food preservatives, to ensure healthier and more reputable food options.

What Are The Major Challenges Faced By The Global Natural Food Preservatives Market?

Compared to synthetic counterparts, natural preservatives frequently have a lower shelf life. Manufacturers may face difficulties maintaining the appropriate shelf life of food goods and preserving the stability of their products as a result.

What Are The Growth Opportunities In The Global Natural Food Preservatives Market?

Clean-label products are in greater demand because customers believe they are healthier and more honest. Natural food preservatives now have a chance to replace synthetic chemicals and satisfy the growing demand for pure, natural ingredients from consumers.

Design Element 2

Access crucial information at unmatched prices!

Request your free sample report today & start making informed decisions powered by Credence Research!

Download Free Sample
CTA Design Element 3

Executive Summary

Overview of the Global Natural Food Preservatives Market

Growing consumer desire for natural and clean-label products is fueling the steady rise of the global market for natural food preservatives. Consumers are looking for safer and more natural options as they become more aware of the potential health problems linked to synthetic preservatives. The market is also gaining from the growing organic and natural food industry and from the focus on environmental responsibility and sustainability. However, obstacles include short shelf life, greater price, complicated regulations, and technical constraints. Overall, the market has many opportunities for innovation, research, and development to satisfy consumer wants and profit from the shift in consumer preferences toward natural food preservatives.

Market Definition

Natural food preservatives are compounds used to maintain food products’ quality and shelf life. They are sourced from natural sources such as plants, animals, minerals, or microbes. These preservatives aid in preventing oxidation, delaying the deterioration of food, and inhibiting or slowing the growth of bacteria that cause spoiling. Consumers that prefer clearer, more transparent labeling on their products choose natural food preservatives because they believe they are safer and more environmentally friendly than synthetic preservatives. Salt, sugar, vinegar, honey, citric acid, rosemary extract, and certain essential oils are a few examples of natural food preservatives. These natural preservatives can be added to various foods to extend their shelf life and keep them fresh without artificial additives, such as baked goods, drinks, dairy products, meat, and processed meals.

Market Insights

  • The global demand for natural food preservatives was valued at USD 0.4 Billion in 2022 and is expected to reach USD 0.6 Billion in 2030, growing at a CAGR of 7.2% between 2023 and 2030.
  • Salt is the market leader in material and will hold over 20% of the market’s value in 2022. Meanwhile, honey is anticipated to show the quickest CAGR over the forecast period.
  • The antimicrobial segment governs the global demand for natural food preservatives, holding a massive share of over 30% in 2022, and is expected to grow at a rapid CAGR.
  • Seafood, meat & poultry is the most widely used material market leader, holding over 35% of the market’s value in 2022, while beverages are anticipated to show the quickest CAGR over the forecast period.
  • Europe fueled the growth of the natural food preservatives industry with over one-third share in 2022. Asia Pacific and Europe collectively account for just under 40% share in 2022, with Asia Pacific holding over 22% share in the same year.
  • Europe is dominating the natural food preservatives market due to rising consumer demand for products with clean labels and natural ingredients, a sizable presence of large food producers, and an increased focus on health and wellbeing.
  • The rising consumer preference for products with clean labels and natural ingredients, fueled by worries over synthetic additives and increased awareness of one’s health, is one factor driving the market for natural food preservatives. Natural preservatives’ shorter shelf lives than their synthetic counterparts are one barrier that might make it difficult to maintain product stability and adhere to specified shelf life standards.

Segmentation by Type

  • Salt is the leading segment by material and held over 20% share in value in 2022.
  • The honey segment will likely exhibit the fastest CAGR during the forecast period.

Segmentation by Function

  • The antimicrobial segment governs the demand for natural food preservatives globally, holding a massive share of over 30% in 2022, and is also expected to grow at a rapid CAGR.
  • The antioxidants segment contributes to the rest of the demand for natural food preservatives.

Segmentation by Application

  • Seafood, meat & poultry govern the demand for natural food preservatives globally, holding a massive share of over 30% in 2022, and are also expected to grow at a rapid CAGR.
  • The beverages function segment contributes to the rest of the demand for natural food preservatives.

Segmentation by Region

  • Europe fueled the growth of the natural food preservatives industry with over one-third share in 2022.
  • North America and Asia Pacific collectively account for just under 40% share in 2022, with Asia Pacific holding over 22% share in the same year.
  • The rest of the World, including Latin America, The Middle East, and Africa, contributes the remainder to the demand for natural food preservatives.

The growing desire for clean labels and natural products, driven by rising consumer awareness of health and well-being, drives the market for natural food preservatives. Market demand for natural substitutes is driven by consumers’ desire for food without artificial additives and preservatives.

The market for natural food preservatives in the US is widely used to meet the rising demand for products with clean labels and natural ingredients. Various natural preservatives are available from major food producers and retailers in several food categories, including baked products, drinks, and snacks. Customers can choose healthier options since they have access to a wide range of options, such as natural antimicrobials like rosemary extract or natural antioxidants like vitamin E. Consumer demand for natural ingredients, strict regulatory requirements, and a thriving food industry that fosters product innovation and growth are the market’s main drivers.

The market for natural food preservatives is used in Germany to supply a substantial market for organic and natural food items. The market for organic foods is robust nationwide, and customers actively seek out goods with few artificial ingredients. Natural preservatives, including salt, sugar, vinegar, and citric acid are frequently employed to increase the shelf life of organic food products. German customers place a high emphasis on sustainability and transparency, and the market offers a variety of natural preservatives that share these ideals. Additionally, the tight certifications and laws governing food guarantee the market availability of natural food preservatives.

Natural Food Preservatives Market

Increasing Consumer Demand for Clean Label Products

The rising consumer desire for products with clean labels is one of the key factors driving the market for natural food preservatives. Food goods with transparent ingredient lists free of artificial additives and preservatives are increasingly in demand among consumers.

They are increasingly concerned about their health and the potential dangers of artificial preservatives. Natural food preservatives from plant extracts, essential oils, or other all-natural sources are becoming more popular. Producers are forced to reformulate their products and include natural preservatives to meet consumer demand. This driver is propelled by a desire for safer and more natural options in the food supply.

Rising Awareness of Health and Wellness

The growing consumer awareness of health and well-being is a key factor driving the market for natural food preservatives. The potential health concerns of ingesting food products with artificial chemicals and preservatives are becoming well understood.

Consumers are looking for healthier substitutes that complement their lifestyle preferences and well-being. Natural food preservatives are considered safer and healthier since they have fewer negative health impacts.

They are sourced from natural sources. Additional elements that support this driver include media attention, health-related education programs, and the influence of social media platforms, which communicate knowledge about the possible dangers of synthetic chemicals. Natural food preservatives are in greater demand due to consumers’ active search for goods that advance their general health and well-being.

Limited Shelf Life

The short shelf life of natural preservatives compared to their synthetic equivalents is one barrier to the market for natural food preservatives. Because they are made from organic materials, natural preservatives frequently have a shorter shelf life, which can be problematic for producers and merchants. Due to this restriction, food goods may become less stable and of worse quality over time, possibly spoiling or losing some freshness.

To achieve proper preservation without sacrificing the sensory qualities or safety of the product, manufacturers must carefully examine the optimal usage levels and formulation methods. Natural preservatives’ shorter shelf lives may also necessitate more frequent product turnover and possibly greater production costs, affecting profitability and market competitiveness.

Expansion of Organic and Natural Food Sector

The growth of the organic and natural food industries is a huge opportunity for the market for natural food preservatives. There has been an increase in demand for organic and natural food items as consumers place a higher priority on health and wellness.

Natural food preservatives now have a chance to replace synthetic additives and satisfy consumers’ growing need for ingredients with clear labels. Manufacturers can profit from this trend by providing natural preservatives compatible with the organic and natural food industry. This will enable them to reach a rising market segment and meet the changing needs of consumers.

Increasing Focus on Sustainability and Environmental Friendliness

The growing emphasis on sustainability and ecologically friendly activities presents a significant opportunity in the market for natural food preservatives. There is a demand for eco-friendly and sustainable solutions as customers become more aware of how their food choices affect the environment.

Synthetic food preservatives are not as environmentally friendly as natural food preservatives made from renewable resources like plant extracts or microorganisms. By promoting natural preservatives as part of their sustainable product lineup, manufacturers may satisfy consumer demand for ecologically friendly solutions.

Companies may improve their brand reputation, draw in eco-aware customers, and support a more sustainable food business by associating with sustainability programs. Additionally, this opportunity promotes research and development activities to fuel market expansion further to identify novel and long-lasting natural preservative solutions.

Competitive Landscape

Key Players

The global natural food preservatives market is highly competitive, with several key players. Some of the major players in the market and their market share are as follows:

There is fierce rivalry for natural food preservatives, as many manufacturers are doing business there. Newcomers and established firms strive to offer cutting-edge technology, value-added services, and affordable prices. Important market players work hard to differentiate themselves through product innovation, customized options, and effective after-sales service.

The first fully integrated factory for vanillin production was recently put into operation by Camlin Fine Sciences Ltd. (CFS), a major global producer of diphenols. The brand-new facility, known as “adorr,” is housed in the premier CFS building in Dahej, India. The introduction of “adorr” is a critical turning point for CFS, solidifying its position as a top supplier of premium diphenols and related goods. The new facility is anticipated to strengthen CFS’s dedication to sustainability and ethical production procedures while assisting it in meeting the rising demand for vanillin and other related products on the international market.

Summary of Key Findings

  • Salt is the market leader in terms of material and will account for more than 20% of market revenue in 2022. The CAGR for honey is predicted to be the fastest during the projection period.
  • The antimicrobial segment, predicted to develop at a high CAGR, will dominate the global market for natural food preservatives in 2022, accounting for a significant share of over 30%.
  • Seafood, meat, and poultry are the most popular material in the market, accounting for over 35% of its value in 2022. Beverages are predicted to grow at the fastest rate during the projected period.
  • The industry for natural food preservatives grew at a rate of over one-third in Europe in 2022. In 2022, Asia Pacific and Europe will account for slightly less than 40% of the market, with Asia Pacific controlling more than 22%.

Shape Your Report to Specific Countries or Regions & Enjoy 30% Off!

Future Outlook

  • The industry for natural food preservatives has bright prospects.
  • The market is anticipated to expand steadily as consumer awareness of health and wellness rises and the desire for natural and clean-label products.
  • Natural food preservatives have a chance to replace synthetic chemicals thanks to the growing organic and natural food industries and the focus on sustainability.
  • Research and development developments will spur the creation of more reliable natural preservatives, increasing the market’s potential for future growth.

Segmentation

  • By Type
    • Salt
    • Sugar
    • Oil
    • Honey
    • Citric Acid
    • Vinegar
    • Others
  • By Function
    • Antimicrobial
    • Antioxidants
    • Others
  • By Application
    • Sea Food, Meat & Poultry
    • Bakery
    • Dairy
    • Snacks
    • Beverages
    • Fruits and Vegetables
    • Others
  • By Region
  • North America
    • US
    • Canada
    • Mexico
  • Europe
    • Germany
    • France
    • UK.
    • Italy
    • Spain
    • Rest of Europe
  • Asia Pacific
    • China
    • Japan
    • India
    • South Korea
    • South-east Asia
    • Rest of Asia Pacific
  • Latin America
    • Brazil
    • Argentina
    • Rest of Latin America
  • Middle East & Africa
    • GCC Countries
    • South Africa
    • Rest of Middle East and Africa

1. Preface
1.1. Report Description
1.1.1. Purpose of the Report
1.1.2. Target Audience
1.1.3. USP and Key Offerings
1.2. Research Scope
1.3. Research Methodology
1.3.1. Phase I – Secondary Research
1.3.2. Phase II – Data Modelling
1.3.2.1. Company Share Analysis Model
1.3.2.2. Revenue Based Modelling
1.3.3. Phase III – Primary Research
1.3.4. Research Limitations
1.3.5. Assumptions
1.4. Market Introduction
1.5. Market Research Scope

2. Executive Summary
2.1. Market Snapshot: Global Natural Food Preservatives Market
2.2. Global Natural Food Preservatives Market, By Type
2.3. Global Natural Food Preservatives Market, By Function
2.4. Global Natural Food Preservatives Market, By Application
2.5. Global Natural Food Preservatives Market, By Region

3. Market Dynamics & Factors Analysis
3.1. Introduction
3.1.1. Global Natural Food Preservatives Market Value, 2017-2030, (US$ Bn)
3.1.2. Y-o-Y Growth Trend Analysis
3.2. Market Dynamics
3.2.1. Market Drivers
3.2.1.1. Driver 1
3.2.1.2. Driver 2
3.2.1.3. Driver 3
3.2.2. Market Restraints
3.2.2.1. Restraint 1
3.2.2.2. Restraint 2
3.2.3. Market Opportunities
3.2.3.1. Opportunity 1
3.2.3.2. Opportunity 2
3.2.4. Major Industry Challenges
3.2.4.1. Challenge 1
3.2.4.2. Challenge 2
3.3. Growth and Development Patterns
3.4. Investment Feasibility Analysis
3.5. Market Opportunity Analysis
3.5.1. Type
3.5.2. Function
3.5.3. Application
3.5.4. Geography

4. Premium Insights
4.1. STAR (Situation, Task, Action, Results) Analysis
4.2. Porter’s Five Forces Analysis
4.2.1. Threat of New Entrants
4.2.2. Bargaining Power of Buyers/Consumers
4.2.3. Bargaining Power of Suppliers
4.2.4. Threat of Substitute
4.2.5. Intensity of Competitive Rivalry
4.3. Key Market Trends
4.3.1. Demand Side Trends
4.3.2. Supply Side Trends
4.4. Value Chain Analysis
4.5. Type Analysis
4.6. Analysis and Recommendations
4.7. Marketing Strategy Analysis
4.7.1. Direct Marketing
4.7.2. Indirect Marketing
4.7.3. Marketing Channel Development Trend

5. Market Positioning of Key Players, 2022
5.1. Company market share of key players, 2022
5.2. Competitive Benchmarking
5.3. Market Positioning of Key Vendors
5.4. Geographical Presence Analysis
5.5. Major Strategies Adopted by Key Players
5.5.1. Key Strategies Analysis
5.5.2. Mergers and Acquisitions
5.5.3. Partnerships
5.5.4. Product Launch
5.5.5. Geographical Expansion
5.5.6. Others

6. Economic Impact Analysis
6.1. Recession Impact
6.1.1. North America
6.1.2. Europe
6.1.3. Asia Pacific
6.1.4. Latin America
6.1.5. Middle East and Africa
6.2. Ukraine-Russia War Impact
6.2.1. North America
6.2.2. Europe
6.2.3. Asia Pacific
6.2.4. Latin America
6.2.5. Middle East and Africa
6.3. COVID-19 Impact Analysis
6.3.1. North America
6.3.2. Europe
6.3.3. Asia Pacific
6.3.4. Latin America
6.3.5. Middle East and Africa

7. Global Natural Food Preservatives Market, By Type
7.1. Global Natural Food Preservatives Market Overview, by Type
7.1.1. Global Natural Food Preservatives Market Revenue Share, By Type, 2022 Vs 2030 (in %)
7.2. Salt
7.2.1. Global Natural Food Preservatives Market, By Region, 2017-2030 (US$ Bn)
7.3. Oil
7.3.1. Global Natural Food Preservatives Market, By Region, 2017-2030 (US$ Bn)
7.4. Honey
7.4.1. Global Natural Food Preservatives Market, By Region, 2017-2030 (US$ Bn)
7.5. Citric Acid
7.5.1. Global Natural Food Preservatives Market, By Region, 2017-2030 (US$ Bn)
7.6. Vinegar
7.6.1. Global Natural Food Preservatives Market, By Region, 2017-2030 (US$ Bn)
7.7. Others
7.7.1. Global Natural Food Preservatives Market, By Region, 2017-2030 (US$ Bn)

8. Global Natural Food Preservatives Market, By Function
8.1. Global Natural Food Preservatives Market Overview, by Function
8.1.1. Global Natural Food Preservatives Market, By Function, 2022 vs 2030 (in %)
8.2. Antimicrobial
8.2.1. Global Natural Food Preservatives Market, By Region, 2017-2030 (US$ Bn)
8.3. Antioxidants
8.3.1. Global Natural Food Preservatives Market, By Region, 2017-2030 (US$ Bn)
8.4. Others
8.4.1. Global Natural Food Preservatives Market, By Region, 2017-2030 (US$ Bn)

9. Global Natural Food Preservatives Market, by Application, 2017-2030 (US$ Bn)
9.1. Global Natural Food Preservatives Market Overview, by Application
9.1.1. Global Natural Food Preservatives Market, By Application, 2022 vs 2030 (in%)
9.2. Sea Food, Meat & Poultry
9.2.1. Global Natural Food Preservatives Market, By Region, 2017-2030 (US$ Bn)
9.3. Bakery
9.3.1. Global Natural Food Preservatives Market, By Region, 2017-2030 (US$ Bn)
9.4. Dairy
9.4.1. Global Natural Food Preservatives Market, By Region, 2017-2030 (US$ Bn)
9.5. Snacks
9.5.1. Global Natural Food Preservatives Market, By Region, 2017-2030 (US$ Bn)
9.6. Beverages
9.6.1. Global Natural Food Preservatives Market, By Region, 2017-2030 (US$ Bn)
9.7. Fruits and Vegetables
9.7.1. Global Natural Food Preservatives Market, By Region, 2017-2030 (US$ Bn)
9.8. Others
9.8.1. Global Natural Food Preservatives Market, By Region, 2017-2030 (US$ Bn)

10. Global Natural Food Preservatives Market, By Region
10.1. Global Natural Food Preservatives Market Overview, by Region
10.1.1. Global Natural Food Preservatives Market, By Region, 2022 vs 2030 (in%)
10.2. Type
10.2.1. Global Natural Food Preservatives Market, By Type, 2017-2030 (US$ Bn)
10.3. Function
10.3.1. Global Natural Food Preservatives Market, By Function, 2017-2030 (US$ Bn)
10.4. Application
10.4.1. Global Natural Food Preservatives Market, By Application, 2017-2030 (US$ Bn)

11. North America Natural Food Preservatives Market Analysis
11.1. North America Natural Food Preservatives Market, by Type, 2017-2030(US$ Bn)
11.1.1. Overview
11.1.2. SRC Analysis
11.2. North America Natural Food Preservatives Market, by Function, 2017-2030(US$ Bn)
11.2.1. Overview
11.2.2. SRC Analysis
11.3. North America Natural Food Preservatives Market, by Application, 2017-2030(US$ Bn)
11.3.1. Overview
11.3.2. SRC Analysis
11.4. North America Natural Food Preservatives Market, by Country, 2017-2030 (US$ Bn)
11.4.1. North America Natural Food Preservatives Market, by Country, 2022 Vs 2030 (in%)
11.4.2. U.S.
11.4.2.1. U.S. Natural Food Preservatives Market Estimates and Forecast, 2017-2030 (US$ Bn)
11.4.2.2. U.S. Natural Food Preservatives, By Type, 2017-2030 (US$ Bn)
11.4.2.3. U.S. Natural Food Preservatives, By Function, 2017-2030 (US$ Bn)
11.4.2.4. U.S. Natural Food Preservatives, By Application, 2017-2030 (US$ Bn)
11.4.3. Canada
11.4.3.1. Canada Natural Food Preservatives Market Estimates and Forecast, 2017-2030 (US$ Bn)
11.4.3.2. Canada Natural Food Preservatives, By Type, 2017-2030 (US$ Bn)
11.4.3.3. Canada Natural Food Preservatives, By Function, 2017-2030 (US$ Bn)
11.4.3.4. Canada Natural Food Preservatives, By Application, 2017-2030 (US$ Bn)
11.4.4. Mexico
11.4.4.1. Mexico Natural Food Preservatives Market Estimates and Forecast, 2017-2030 (US$ Bn)
11.4.4.2. Mexico Natural Food Preservatives, By Type, 2017-2030 (US$ Bn)
11.4.4.3. Mexico Natural Food Preservatives, By Function, 2017-2030 (US$ Bn)
11.4.4.4. Mexico Natural Food Preservatives, By Application, 2017-2030 (US$ Bn)

12. Europe Natural Food Preservatives Market Analysis
12.1. Europe Natural Food Preservatives Market, by Type, 2017-2030(US$ Bn)
12.1.1. Overview
12.1.2. SRC Analysis
12.2. Europe Natural Food Preservatives Market, by Function, 2017-2030(US$ Bn)
12.2.1. Overview
12.2.2. SRC Analysis
12.3. Europe Natural Food Preservatives Market, by Application, 2017-2030(US$ Bn)
12.3.1. Overview
12.3.2. SRC Analysis
12.4. Europe Natural Food Preservatives Market, by Country, 2017-2030 (US$ Bn)
12.4.1. Europe Natural Food Preservatives Market, by Country, 2022 Vs 2030 (in%)
12.4.2. Germany
12.4.2.1. Germany Natural Food Preservatives Market Estimates and Forecast, 2017-2030 (US$ Bn)
12.4.2.2. Germany Natural Food Preservatives, By Type, 2017-2030 (US$ Bn)
12.4.2.3. Germany Natural Food Preservatives, By Function, 2017-2030 (US$ Bn)
12.4.2.4. Germany Natural Food Preservatives, By Application, 2017-2030 (US$ Bn)
12.4.3. France
12.4.3.1. France Natural Food Preservatives Market Estimates and Forecast, 2017-2030 (US$ Bn)
12.4.3.2. France Natural Food Preservatives, By Type, 2017-2030 (US$ Bn)
12.4.3.3. France Natural Food Preservatives, By Function, 2017-2030 (US$ Bn)
12.4.3.4. France Natural Food Preservatives, By Application, 2017-2030 (US$ Bn)
12.4.4. UK
12.4.4.1. UK Natural Food Preservatives Market Estimates and Forecast, 2017-2030 (US$ Bn)
12.4.4.2. UK Natural Food Preservatives, By Type, 2017-2030 (US$ Bn)
12.4.4.3. UK Natural Food Preservatives, By Function, 2017-2030 (US$ Bn)
12.4.4.4. UK Natural Food Preservatives, By Application, 2017-2030 (US$ Bn)
12.4.5. Italy
12.4.5.1. Italy Natural Food Preservatives Market Estimates and Forecast, 2017-2030 (US$ Bn)
12.4.5.2. Italy Natural Food Preservatives, By Type, 2017-2030 (US$ Bn)
12.4.5.3. Italy Natural Food Preservatives, By Function, 2017-2030 (US$ Bn)
12.4.5.4. Italy Natural Food Preservatives, By Application, 2017-2030 (US$ Bn)
12.4.6. Spain
12.4.6.1. Spain Natural Food Preservatives Market Estimates and Forecast, 2017-2030 (US$ Bn)
12.4.6.2. Spain Natural Food Preservatives, By Type, 2017-2030 (US$ Bn)
12.4.6.3. Spain Natural Food Preservatives, By Function, 2017-2030 (US$ Bn)
12.4.6.4. Spain Natural Food Preservatives, By Application, 2017-2030 (US$ Bn)
12.4.7. Rest of Europe
12.4.7.1. Rest of Europe Natural Food Preservatives Market Estimates and Forecast, 2017-2030 (US$ Bn)
12.4.7.2. Rest of Europe Natural Food Preservatives, By Type, 2017-2030 (US$ Bn)
12.4.7.3. Rest of Europe Natural Food Preservatives, By Function, 2017-2030 (US$ Bn)
12.4.7.4. Rest of Europe Natural Food Preservatives, By Application, 2017-2030 (US$ Bn)

13. Asia Pacific Natural Food Preservatives Market Analysis
13.1. Asia Pacific Natural Food Preservatives Market, by Type, 2017-2030(US$ Bn)
13.1.1. Overview
13.1.2. SRC Analysis
13.2. Asia Pacific Natural Food Preservatives Market, by Function, 2017-2030(US$ Bn)
13.2.1. Overview
13.2.2. SRC Analysis
13.3. Asia Pacific Natural Food Preservatives Market, by Application, 2017-2030(US$ Bn)
13.3.1. Overview
13.3.2. SRC Analysis
13.4. Asia Pacific Natural Food Preservatives Market, by Country, 2017-2030 (US$ Bn)
13.4.1. Asia Pacific Natural Food Preservatives Market, by Country, 2022 Vs 2030 (in%)
13.4.2. China
13.4.2.1. China Natural Food Preservatives Market Estimates and Forecast, 2017-2030 (US$ Bn)
13.4.2.2. China Natural Food Preservatives, By Type, 2017-2030 (US$ Bn)
13.4.2.3. China Natural Food Preservatives, By Function, 2017-2030 (US$ Bn)
13.4.2.4. China Natural Food Preservatives, By Application, 2017-2030 (US$ Bn)
13.4.3. Japan
13.4.3.1. Japan Natural Food Preservatives Market Estimates and Forecast, 2017-2030 (US$ Bn)
13.4.3.2. Japan Natural Food Preservatives, By Type, 2017-2030 (US$ Bn)
13.4.3.3. Japan Natural Food Preservatives, By Function, 2017-2030 (US$ Bn)
13.4.3.4. Japan Natural Food Preservatives, By Application, 2017-2030 (US$ Bn)
13.4.4. India
13.4.4.1. India Natural Food Preservatives Market Estimates and Forecast, 2017-2030 (US$ Bn)
13.4.4.2. India Natural Food Preservatives, By Type, 2017-2030 (US$ Bn)
13.4.4.3. India Natural Food Preservatives, By Function, 2017-2030 (US$ Bn)
13.4.4.4. India Natural Food Preservatives, By Application, 2017-2030 (US$ Bn)
13.4.5. South Korea
13.4.5.1. South Korea Natural Food Preservatives Market Estimates and Forecast, 2017-2030 (US$ Bn)
13.4.5.2. South Korea Natural Food Preservatives, By Type, 2017-2030 (US$ Bn)
13.4.5.3. South Korea Natural Food Preservatives, By Function, 2017-2030 (US$ Bn)
13.4.5.4. South Korea Natural Food Preservatives, By Application, 2017-2030 (US$ Bn)
13.4.6. South-East Asia
13.4.6.1. South-East Asia Natural Food Preservatives Market Estimates and Forecast, 2017-2030 (US$ Bn)
13.4.6.2. South-East Asia Natural Food Preservatives, By Type, 2017-2030 (US$ Bn)
13.4.6.3. South-East Asia Natural Food Preservatives, By Function, 2017-2030 (US$ Bn)
13.4.6.4. South-East Asia Natural Food Preservatives, By Application, 2017-2030 (US$ Bn)
13.4.7. Rest of Asia Pacific
13.4.7.1. Rest of Asia Pacific Natural Food Preservatives Market Estimates and Forecast, 2017-2030 (US$ Bn)
13.4.7.2. Rest of Asia Pacific Natural Food Preservatives, By Type, 2017-2030 (US$ Bn)
13.4.7.3. Rest of Asia Pacific Natural Food Preservatives, By Function, 2017-2030 (US$ Bn)
13.4.7.4. Rest of Asia Pacific Natural Food Preservatives, By Application, 2017-2030 (US$ Bn)

14. Latin America Natural Food Preservatives Market Analysis
14.1. Latin America Natural Food Preservatives Market, by Type, 2017-2030(US$ Bn)
14.1.1. Overview
14.1.2. SRC Analysis
14.2. Latin America Natural Food Preservatives Market, by Function, 2017-2030(US$ Bn)
14.2.1. Overview
14.2.2. SRC Analysis
14.3. Latin America Natural Food Preservatives Market, by Application, 2017-2030(US$ Bn)
14.3.1. Overview
14.3.2. SRC Analysis
14.4. Latin America Natural Food Preservatives Market, by Country, 2017-2030 (US$ Bn)
14.4.1. Latin America Natural Food Preservatives Market, by Country, 2022 Vs 2030 (in%)
14.4.2. Brazil
14.4.2.1. Brazil Natural Food Preservatives Market Estimates and Forecast, 2017-2030 (US$ Bn)
14.4.2.2. Brazil Natural Food Preservatives, By Type, 2017-2030 (US$ Bn)
14.4.2.3. Brazil Natural Food Preservatives, By Function, 2017-2030 (US$ Bn)
14.4.2.4. Brazil Natural Food Preservatives, By Application, 2017-2030 (US$ Bn)
14.4.3. Argentina
14.4.3.1. Argentina Natural Food Preservatives Market Estimates and Forecast, 2017-2030 (US$ Bn)
14.4.3.2. Argentina Natural Food Preservatives, By Type, 2017-2030 (US$ Bn)
14.4.3.3. Argentina Natural Food Preservatives, By Function, 2017-2030 (US$ Bn)
14.4.3.4. Argentina Natural Food Preservatives, By Application, 2017-2030 (US$ Bn)
14.4.4. Rest of Latin America
14.4.4.1. Rest of Latin America Natural Food Preservatives Market Estimates and Forecast, 2017-2030 (US$ Bn)
14.4.4.2. Rest of Latin America Natural Food Preservatives, By Type, 2017-2030 (US$ Bn)
14.4.4.3. Rest of Latin America Natural Food Preservatives, By Function, 2017-2030 (US$ Bn)
14.4.4.4. Rest of Latin America Natural Food Preservatives, By Application, 2017-2030 (US$ Bn)

15. Middle East and Africa Natural Food Preservatives Market Analysis
15.1. Middle East and Africa Natural Food Preservatives Market, by Type, 2017-2030(US$ Bn)
15.1.1. Overview
15.1.2. SRC Analysis
15.2. Middle East and Africa Natural Food Preservatives Market, by Function, 2017-2030(US$ Bn)
15.2.1. Overview
15.2.2. SRC Analysis
15.3. Middle East and Africa Natural Food Preservatives Market, by Application, 2017-2030(US$ Bn)
15.3.1. Overview
15.3.2. SRC Analysis
15.4. Middle East and Africa Natural Food Preservatives Market, by Country, 2017-2030 (US$ Bn)
15.4.1. Middle East and Africa Natural Food Preservatives Market, by Country, 2022 Vs 2030 (in%)
15.4.2. GCC Countries
15.4.2.1. GCC Countries Natural Food Preservatives Market Estimates and Forecast, 2017-2030 (US$ Bn)
15.4.2.2. GCC Countries Natural Food Preservatives, By Type, 2017-2030 (US$ Bn)
15.4.2.3. GCC Countries Natural Food Preservatives, By Function, 2017-2030 (US$ Bn)
15.4.2.4. GCC Countries Natural Food Preservatives, By Application, 2017-2030 (US$ Bn)
15.4.3. South Africa
15.4.3.1. South Africa Natural Food Preservatives Market Estimates and Forecast, 2017-2030 (US$ Bn)
15.4.3.2. South Africa Natural Food Preservatives, By Type, 2017-2030 (US$ Bn)
15.4.3.3. South Africa Natural Food Preservatives, By Function, 2017-2030 (US$ Bn)
15.4.3.4. South Africa Natural Food Preservatives, By Application, 2017-2030 (US$ Bn)
15.4.4. Rest of Middle East and Africa
15.4.4.1. Rest of Middle East and Africa Natural Food Preservatives Market Estimates and Forecast, 2017-2030 (US$ Bn)
15.4.4.2. Rest of Middle East and Africa Natural Food Preservatives, By Type, 2017-2030 (US$ Bn)
15.4.4.3. Rest of Middle East and Africa Natural Food Preservatives, By Function, 2017-2030 (US$ Bn)
15.4.4.4. Rest of Middle East and Africa Natural Food Preservatives, By Application, 2017-2030 (US$ Bn)

16. Company Profiles
16.1. BASF SE (BASF)
16.1.1. Company Overview
16.1.2. Products/Services Portfolio
16.1.3. Geographical Presence
16.1.4. Financial Summary
16.1.4.1. Market Revenue and Net Profit (2019-2022)
16.1.4.2. Business Segment Revenue Analysis
16.1.4.3. Geographical Revenue Analysis
16.2. Koninklijke DSM N.V.
16.3. Cargill, Inc
16.4. BIOSECUR LAB (Foodguard)
16.5. Kemin Industries, Inc.
16.6. Corbion NV
16.7. GALACTIC SA
16.8. Archer Daniels Midland Company
16.9. Tate & Lyle PLC. (Tate & Lyle)


List of Figures
FIG. 1 Global Natural Food Preservatives Market: Research Methodology
FIG. 2 Market Size Estimation – Top Down & Bottom up Approach
FIG. 3 Global Natural Food Preservatives Market Segmentation
FIG. 4 Global Natural Food Preservatives Market, by Type, 2022 (US$ Bn)
FIG. 5 Global Natural Food Preservatives Market, by Function, 2022 (US$ Bn)
FIG. 6 Global Natural Food Preservatives Market, by Application, 2022 (US$ Bn)
FIG. 7 Global Natural Food Preservatives Market, by Geography, 2022 (US$ Bn)
FIG. 8 Attractive Investment Proposition, by Type, 2022
FIG. 9 Attractive Investment Proposition, by Function, 2022
FIG. 10 Attractive Investment Proposition, by Application, 2022
FIG. 11 Attractive Investment Proposition, by Geography, 2022
FIG. 12 Global Market Share Analysis of Key Natural Food Preservatives Market Manufacturers, 2022
FIG. 13 Global Market Positioning of Key Natural Food Preservatives Market Manufacturers, 2022
FIG. 14 Global Natural Food Preservatives Market Value Contribution, By Type, 2022 & 2030 (Value %)
FIG. 15 Global Natural Food Preservatives Market, by Salt, Value, 2017-2030 (US$ Bn)
FIG. 16 Global Natural Food Preservatives Market, by Sugar, Value, 2017-2030 (US$ Bn)
FIG. 17 Global Natural Food Preservatives Market, by Oil, Value, 2017-2030 (US$ Bn)
FIG. 18 Global Natural Food Preservatives Market, by Honey, Value, 2017-2030 (US$ Bn)
FIG. 19 Global Natural Food Preservatives Market, by Citric Acid, Value, 2017-2030 (US$ Bn)
FIG. 20 Global Natural Food Preservatives Market, by Vinegar, Value, 2017-2030 (US$ Bn)
FIG. 21 Global Natural Food Preservatives Market, by Others, Value, 2017-2030 (US$ Bn)
FIG. 22 Global Natural Food Preservatives Market Value Contribution, By Function, 2022 & 2030 (Value %)
FIG. 23 Global Natural Food Preservatives Market, by Antimicrobial, Value, 2017-2030 (US$ Bn)
FIG. 24 Global Natural Food Preservatives Market, by Antioxidants, 2017-2030 (US$ Bn)
FIG. 25 Global Natural Food Preservatives Market, by Others, 2017-2030 (US$ Bn)
FIG. 26 Global Natural Food Preservatives Market Value Contribution, By Application, 2022 & 2030 (Value %)
FIG. 27 Global Natural Food Preservatives Market, by Sea Food, Meat & Poultry, Value, 2017-2030 (US$ Bn)
FIG. 28 Global Natural Food Preservatives Market, by Bakery, 2017-2030 (US$ Bn)
FIG. 29 Global Natural Food Preservatives Market, by Dairy, 2017-2030 (US$ Bn)
FIG. 30 Global Natural Food Preservatives Market, by Snacks, 2017-2030 (US$ Bn)
FIG. 31 Global Natural Food Preservatives Market, by Beverages, 2017-2030 (US$ Bn)
FIG. 32 Global Natural Food Preservatives Market, by Fruits and Vegetables, 2017-2030 (US$ Bn)
FIG. 33 Global Natural Food Preservatives Market, by Others, 2017-2030 (US$ Bn)
FIG. 34 North America Natural Food Preservatives Market, 2017-2030 (US$ Bn)
FIG. 35 U.S. Natural Food Preservatives Market, 2017-2030 (US$ Bn)
FIG. 36 Canada Natural Food Preservatives Market, 2017-2030 (US$ Bn)
FIG. 37 Europe Natural Food Preservatives Market, 2017-2030 (US$ Bn)
FIG. 38 Germany Natural Food Preservatives Market, 2017-2030 (US$ Bn)
FIG. 39 France Natural Food Preservatives Market, 2017-2030 (US$ Bn)
FIG. 40 U.K. Natural Food Preservatives Market, 2017-2030 (US$ Bn)
FIG. 41 Italy Natural Food Preservatives Market, 2017-2030 (US$ Bn)
FIG. 42 Spain Natural Food Preservatives Market, 2017-2030 (US$ Bn)
FIG. 43 Rest of Europe Natural Food Preservatives Market, 2017-2030 (US$ Bn)
FIG. 44 Asia Pacific Natural Food Preservatives Market, 2017-2030 (US$ Bn)
FIG. 45 China Natural Food Preservatives Market, 2017-2030 (US$ Bn)
FIG. 46 Japan Natural Food Preservatives Market, 2017-2030 (US$ Bn)
FIG. 47 India Natural Food Preservatives Market, 2017-2030 (US$ Bn)
FIG. 48 South Korea Natural Food Preservatives Market, 2017-2030 (US$ Bn)
FIG. 49 South-East Asia Natural Food Preservatives Market, 2017-2030 (US$ Bn)
FIG. 50 Rest of Asia Pacific Natural Food Preservatives Market, 2017-2030 (US$ Bn)
FIG. 51 Latin America Natural Food Preservatives Market, 2017-2030 (US$ Bn)
FIG. 52 Brazil Natural Food Preservatives Market, 2017-2030 (US$ Bn)
FIG. 53 Mexico Natural Food Preservatives Market, 2017-2030 (US$ Bn)
FIG. 54 Rest of Latin America Natural Food Preservatives Market, 2017-2030 (US$ Bn)
FIG. 55 Middle East & Africa Natural Food Preservatives Market, 2017-2030 (US$ Bn)
FIG. 56 GCC Countries Natural Food Preservatives Market, 2017-2030 (US$ Bn)
FIG. 57 South Africa Natural Food Preservatives Market, 2017-2030 (US$ Bn)
FIG. 58 Rest of Middle East and Africa Natural Food Preservatives Market, 2017-2030 (US$ Bn)

List of Tables
TABLE 1 Market Snapshot: Global Natural Food Preservatives Market
TABLE 2 Global Natural Food Preservatives Market: Market Drivers Impact Analysis
TABLE 3 Global Natural Food Preservatives Market: Market Restraints Impact Analysis
TABLE 4 Global Natural Food Preservatives Market, by Competitive Benchmarking, 2022
TABLE 5 Global Natural Food Preservatives Market, by Geographical Presence Analysis, 2022
TABLE 6 Global Natural Food Preservatives Market, by Key Strategies Analysis, 2022
TABLE 7 Global Natural Food Preservatives Market, by Type, By Region, 2017-2022 (US$ Bn)
TABLE 8 Global Natural Food Preservatives Market, by Type, By Region, 2023-2030 (US$ Bn)
TABLE 9 Global Natural Food Preservatives Market, by Salt, By Region, 2017-2022 (US$ Bn)
TABLE 10 Global Natural Food Preservatives Market, by Salt, By Region, 2023-2030 (US$ Bn)
TABLE 11 Global Natural Food Preservatives Market, by Sugar, By Region, 2017-2022 (US$ Bn)
TABLE 12 Global Natural Food Preservatives Market, by Sugar, By Region, 2023-2030 (US$ Bn)
TABLE 13 Global Natural Food Preservatives Market, by Oil, By Region, 2017-2022 (US$ Bn)
TABLE 14 Global Natural Food Preservatives Market, by Oil, By Region, 2023-2030 (US$ Bn)
TABLE 15 Global Natural Food Preservatives Market, by Honey, By Region, 2017-2022 (US$ Bn)
TABLE 16 Global Natural Food Preservatives Market, by Honey, By Region, 2023-2030 (US$ Bn)
TABLE 17 Global Natural Food Preservatives Market, by Citric Acid, By Region, 2017-2022 (US$ Bn)
TABLE 18 Global Natural Food Preservatives Market, by Citric Acid, By Region, 2023-2030 (US$ Bn)
TABLE 19 Global Natural Food Preservatives Market, by Vinegar, By Region, 2017-2022 (US$ Bn)
TABLE 20 Global Natural Food Preservatives Market, by Vinegar, By Region, 2023-2030 (US$ Bn)
TABLE 21 Global Natural Food Preservatives Market, by Others, By Region, 2017-2022 (US$ Bn)
TABLE 22 Global Natural Food Preservatives Market, by Others, By Region, 2023-2030 (US$ Bn)
TABLE 23 Global Natural Food Preservatives Market, by Function, By Region, 2017-2022 (US$ Bn)
TABLE 24 Global Natural Food Preservatives Market, by Function, By Region, 2017-2022 (US$ Bn)
TABLE 25 Global Natural Food Preservatives Market, by Antimicrobial, By Region, 2017-2022 (US$ Bn)
TABLE 26 Global Natural Food Preservatives Market, by Antimicrobial, By Region, 2023-2030 (US$ Bn)
TABLE 27 Global Natural Food Preservatives Market, by Antioxidants, By Region, 2017-2022 (US$ Bn)
TABLE 28 Global Natural Food Preservatives Market, by Antioxidants, By Region, 2023-2030 (US$ Bn)
TABLE 29 Global Natural Food Preservatives Market, by Others, By Region, 2017-2022 (US$ Bn)
TABLE 30 Global Natural Food Preservatives Market, by Others, By Region, 2023-2030 (US$ Bn)
TABLE 31 Global Natural Food Preservatives Market, by Others, By Region, 2017-2022 (US$ Bn)
TABLE 32 Global Natural Food Preservatives Market, by Application, By Region, 2017-2022 (US$ Bn)
TABLE 33 Global Natural Food Preservatives Market, by Application, By Region, 2023-2030 (US$ Bn)
TABLE 34 Global Natural Food Preservatives Market, by Sea Food, Meat & Poultry, By Region, 2017-2022 (US$ Bn)
TABLE 35 Global Natural Food Preservatives Market, by Sea Food, Meat & Poultry, By Region, 2023-2030 (US$ Bn)
TABLE 36 Global Natural Food Preservatives Market, by Bakery, By Region, 2017-2022 (US$ Bn)
TABLE 37 Global Natural Food Preservatives Market, by Bakery, By Region, 2023-2030 (US$ Bn)
TABLE 38 Global Natural Food Preservatives Market, by Dairy, By Region, 2017-2022 (US$ Bn)
TABLE 39 Global Natural Food Preservatives Market, by Dairy, By Region, 2023-2030 (US$ Bn)
TABLE 40 Global Natural Food Preservatives Market, by Snacks, By Region, 2017-2022 (US$ Bn)
TABLE 41 Global Natural Food Preservatives Market, by Snacks, By Region, 2023-2030 (US$ Bn)
TABLE 42 Global Natural Food Preservatives Market, by Beverages, By Region, 2017-2022 (US$ Bn)
TABLE 43 Global Natural Food Preservatives Market, by Beverages, By Region, 2023-2030 (US$ Bn)
TABLE 44 Global Natural Food Preservatives Market, by Fruits and Vegetables, By Region, 2017-2022 (US$ Bn)
TABLE 45 Global Natural Food Preservatives Market, by Fruits and Vegetables, By Region, 2023-2030 (US$ Bn)
TABLE 46 Global Natural Food Preservatives Market, by Others, By Region, 2017-2022 (US$ Bn)
TABLE 47 Global Natural Food Preservatives Market, by Others, By Region, 2023-2030 (US$ Bn)
TABLE 48 Global Natural Food Preservatives Market, by Region, 2017-2022 (US$ Bn)
TABLE 49 Global Natural Food Preservatives Market, by Region, 2023-2030 (US$ Bn)
TABLE 50 North America Natural Food Preservatives Market, by Type, 2017-2022 (US$ Bn)
TABLE 51 North America Natural Food Preservatives Market, by Type, 2023-2030 (US$ Bn)
TABLE 52 North America Natural Food Preservatives Market, by Function, 2017-2022 (US$ Bn)
TABLE 53 North America Natural Food Preservatives Market, by Function, 2023-2030 (US$ Bn)
TABLE 54 North America Natural Food Preservatives Market, by Application, 2017-2022 (US$ Bn)
TABLE 55 North America Natural Food Preservatives Market, by Application, 2023-2030 (US$ Bn)
TABLE 56 North America Natural Food Preservatives Market, by Country, 2017-2022 (US$ Bn)
TABLE 57 North America Natural Food Preservatives Market, by Country, 2023-2030 (US$ Bn)
TABLE 58 United States Natural Food Preservatives Market, by Type, 2017-2022 (US$ Bn)
TABLE 59 United States Natural Food Preservatives Market, by Type, 2023-2030 (US$ Bn)
TABLE 60 United States Natural Food Preservatives Market, by Function, 2017-2022 (US$ Bn)
TABLE 61 United States Natural Food Preservatives Market, by Function, 2023-2030 (US$ Bn)
TABLE 62 United States Natural Food Preservatives Market, by Application, 2017-2022 (US$ Bn)
TABLE 63 United States Natural Food Preservatives Market, by Application, 2023-2030 (US$ Bn)
TABLE 64 Canada Natural Food Preservatives Market, by Type, 2017-2022 (US$ Bn)
TABLE 65 Canada Natural Food Preservatives Market, by Type, 2023-2030 (US$ Bn)
TABLE 66 Canada Natural Food Preservatives Market, by Function, 2017-2022 (US$ Bn)
TABLE 67 Canada Natural Food Preservatives Market, by Function, 2023-2030 (US$ Bn)
TABLE 68 Canada Natural Food Preservatives Market, by Application, 2017-2022 (US$ Bn)
TABLE 69 Canada Natural Food Preservatives Market, by Application, 2023-2030 (US$ Bn)
TABLE 70 Mexico Natural Food Preservatives Market, by Type, 2017-2022 (US$ Bn)
TABLE 71 Mexico Natural Food Preservatives Market, by Type, 2023-2030 (US$ Bn)
TABLE 72 Mexico Natural Food Preservatives Market, by Function, 2017-2022 (US$ Bn)
TABLE 73 Mexico Natural Food Preservatives Market, by Function, 2023-2030 (US$ Bn)
TABLE 74 Mexico Natural Food Preservatives Market, by Application, 2017-2022 (US$ Bn)
TABLE 75 Mexico Natural Food Preservatives Market, by Application, 2023-2030 (US$ Bn)
TABLE 76 Europe Natural Food Preservatives Market, by Type, 2017-2022 (US$ Bn)
TABLE 77 Europe Natural Food Preservatives Market, by Type, 2023-2030 (US$ Bn)
TABLE 78 Europe Natural Food Preservatives Market, by Function, 2017-2022 (US$ Bn)
TABLE 79 Europe Natural Food Preservatives Market, by Function, 2023-2030 (US$ Bn)
TABLE 80 Europe Natural Food Preservatives Market, by Application, 2017-2022 (US$ Bn)
TABLE 81 Europe Natural Food Preservatives Market, by Application, 2023-2030 (US$ Bn)
TABLE 82 Europe Natural Food Preservatives Market, by Country, 2017-2022 (US$ Bn)
TABLE 83 Europe Natural Food Preservatives Market, by Country, 2023-2030 (US$ Bn)
TABLE 84 Germany Natural Food Preservatives Market, by Type, 2017-2022 (US$ Bn)
TABLE 85 Germany Natural Food Preservatives Market, by Type, 2023-2030 (US$ Bn)
TABLE 86 Germany Natural Food Preservatives Market, by Function, 2017-2022 (US$ Bn)
TABLE 87 Germany Natural Food Preservatives Market, by Function, 2023-2030 (US$ Bn)
TABLE 88 Germany Natural Food Preservatives Market, by Application, 2017-2022 (US$ Bn)
TABLE 89 Germany Natural Food Preservatives Market, by Application, 2023-2030 (US$ Bn)
TABLE 90 France Natural Food Preservatives Market, by Type, 2017-2022 (US$ Bn)
TABLE 91 France Natural Food Preservatives Market, by Type, 2023-2030 (US$ Bn)
TABLE 92 France Natural Food Preservatives Market, by Function, 2017-2022 (US$ Bn)
TABLE 93 France Natural Food Preservatives Market, by Function, 2023-2030 (US$ Bn)
TABLE 94 France Natural Food Preservatives Market, by Application, 2017-2022 (US$ Bn)
TABLE 95 France Natural Food Preservatives Market, by Application, 2023-2030 (US$ Bn)
TABLE 96 United Kingdom Natural Food Preservatives Market, by Type, 2017-2022 (US$ Bn)
TABLE 97 United Kingdom Natural Food Preservatives Market, by Type, 2023-2030 (US$ Bn)
TABLE 98 United Kingdom Natural Food Preservatives Market, by Function, 2017-2022 (US$ Bn)
TABLE 99 United Kingdom Natural Food Preservatives Market, by Function, 2023-2030 (US$ Bn)
TABLE 100 United Kingdom Natural Food Preservatives Market, by Application, 2017-2022 (US$ Bn)
TABLE 101 United Kingdom Natural Food Preservatives Market, by Application, 2023-2030 (US$ Bn)
TABLE 102 Italy Natural Food Preservatives Market, by Type, 2017-2022 (US$ Bn)
TABLE 103 Italy Natural Food Preservatives Market, by Type, 2023-2030 (US$ Bn)
TABLE 104 Italy Natural Food Preservatives Market, by Function, 2017-2022 (US$ Bn)
TABLE 105 Italy Natural Food Preservatives Market, by Function, 2023-2030 (US$ Bn)
TABLE 106 Italy Natural Food Preservatives Market, by Application, 2017-2022 (US$ Bn)
TABLE 107 Italy Natural Food Preservatives Market, by Application, 2023-2030 (US$ Bn)
TABLE 108 Spain Natural Food Preservatives Market, by Type, 2017-2022 (US$ Bn)
TABLE 109 Spain Natural Food Preservatives Market, by Type, 2023-2030 (US$ Bn)
TABLE 110 Spain Natural Food Preservatives Market, by Function, 2017-2022 (US$ Bn)
TABLE 111 Spain Natural Food Preservatives Market, by Function, 2023-2030 (US$ Bn)
TABLE 112 Spain Natural Food Preservatives Market, by Application, 2017-2022 (US$ Bn)
TABLE 113 Spain Natural Food Preservatives Market, by Application, 2023-2030 (US$ Bn)
TABLE 114 Rest of Europe Natural Food Preservatives Market, by Type, 2017-2022 (US$ Bn)
TABLE 115 Rest of Europe Natural Food Preservatives Market, by Type, 2023-2030 (US$ Bn)
TABLE 116 Rest of Europe Natural Food Preservatives Market, by Function, 2017-2022 (US$ Bn)
TABLE 117 Rest of Europe Natural Food Preservatives Market, by Function, 2023-2030 (US$ Bn)
TABLE 118 Rest of Europe Natural Food Preservatives Market, by Application, 2017-2022 (US$ Bn)
TABLE 119 Rest of Europe Natural Food Preservatives Market, by Application, 2023-2030 (US$ Bn)
TABLE 120 Asia Pacific Natural Food Preservatives Market, by Type, 2017-2022 (US$ Bn)
TABLE 121 Asia Pacific Natural Food Preservatives Market, by Type, 2023-2030 (US$ Bn)
TABLE 122 Asia Pacific Natural Food Preservatives Market, by Function, 2017-2022 (US$ Bn)
TABLE 123 Asia Pacific Natural Food Preservatives Market, by Function, 2023-2030 (US$ Bn)
TABLE 124 Asia Pacific Natural Food Preservatives Market, by Application, 2017-2022 (US$ Bn)
TABLE 125 Asia Pacific Natural Food Preservatives Market, by Application, 2023-2030 (US$ Bn)
TABLE 126 China Natural Food Preservatives Market, by Type, 2017-2022 (US$ Bn)
TABLE 127 China Natural Food Preservatives Market, by Type, 2023-2030 (US$ Bn)
TABLE 128 China Natural Food Preservatives Market, by Function, 2017-2022 (US$ Bn)
TABLE 129 China Natural Food Preservatives Market, by Function, 2023-2030 (US$ Bn)
TABLE 130 China Natural Food Preservatives Market, by Application, 2017-2022 (US$ Bn)
TABLE 131 China Natural Food Preservatives Market, by Application, 2023-2030 (US$ Bn)
TABLE 132 Japan Natural Food Preservatives Market, by Type, 2017-2022 (US$ Bn)
TABLE 133 Japan Natural Food Preservatives Market, by Type, 2023-2030 (US$ Bn)
TABLE 134 Japan Natural Food Preservatives Market, by Function, 2017-2022 (US$ Bn)
TABLE 135 Japan Natural Food Preservatives Market, by Function, 2023-2030 (US$ Bn)
TABLE 136 Japan Natural Food Preservatives Market, by Application, 2017-2022 (US$ Bn)
TABLE 137 Japan Natural Food Preservatives Market, by Application, 2023-2030 (US$ Bn)
TABLE 138 India Natural Food Preservatives Market, by Type, 2017-2022 (US$ Bn)
TABLE 139 India Natural Food Preservatives Market, by Type, 2023-2030 (US$ Bn)
TABLE 140 India Natural Food Preservatives Market, by Function, 2017-2022 (US$ Bn)
TABLE 141 India Natural Food Preservatives Market, by Function, 2023-2030 (US$ Bn)
TABLE 142 India Natural Food Preservatives Market, by Application, 2017-2022 (US$ Bn)
TABLE 143 India Natural Food Preservatives Market, by Application, 2023-2030 (US$ Bn)
TABLE 144 South Korea Natural Food Preservatives Market, by Type, 2017-2022 (US$ Bn)
TABLE 145 South Korea Natural Food Preservatives Market, by Type, 2023-2030 (US$ Bn)
TABLE 146 South Korea Natural Food Preservatives Market, by Function, 2017-2022 (US$ Bn)
TABLE 147 South Korea Natural Food Preservatives Market, by Function, 2023-2030 (US$ Bn)
TABLE 148 South Korea Natural Food Preservatives Market, by Application, 2017-2022 (US$ Bn)
TABLE 149 South Korea Natural Food Preservatives Market, by Application, 2023-2030 (US$ Bn)
TABLE 150 South-East Asia Natural Food Preservatives Market, by Type, 2017-2022 (US$ Bn)
TABLE 151 South-East Asia Natural Food Preservatives Market, by Type, 2023-2030 (US$ Bn)
TABLE 152 South-East Asia Natural Food Preservatives Market, by Function, 2017-2022 (US$ Bn)
TABLE 153 South-East Asia Natural Food Preservatives Market, by Function, 2023-2030 (US$ Bn)
TABLE 154 South-East Asia Natural Food Preservatives Market, by Application, 2017-2022 (US$ Bn)
TABLE 155 South-East Asia Natural Food Preservatives Market, by Application, 2023-2030 (US$ Bn)
TABLE 156 Rest of Asia Pacific Natural Food Preservatives Market, by Type, 2017-2022 (US$ Bn)
TABLE 157 Rest of Asia Pacific Natural Food Preservatives Market, by Type, 2023-2030 (US$ Bn)
TABLE 158 Rest of Asia Pacific Natural Food Preservatives Market, by Function, 2017-2022 (US$ Bn)
TABLE 159 Rest of Asia Pacific Natural Food Preservatives Market, by Function, 2023-2030 (US$ Bn)
TABLE 160 Rest of Asia Pacific Natural Food Preservatives Market, by Application, 2017-2022 (US$ Bn)
TABLE 161 Rest of Asia Pacific Natural Food Preservatives Market, by Application, 2023-2030 (US$ Bn)
TABLE 162 Latin America Natural Food Preservatives Market, by Type, 2017-2022 (US$ Bn)
TABLE 163 Latin America Natural Food Preservatives Market, by Type, 2023-2030 (US$ Bn)
TABLE 164 Latin America Natural Food Preservatives Market, by Function, 2017-2022 (US$ Bn)
TABLE 165 Latin America Natural Food Preservatives Market, by Function, 2023-2030 (US$ Bn)
TABLE 166 Latin America Natural Food Preservatives Market, by Application, 2017-2022 (US$ Bn)
TABLE 167 Latin America Natural Food Preservatives Market, by Application, 2023-2030 (US$ Bn)
TABLE 168 Brazil Natural Food Preservatives Market, by Type, 2017-2022 (US$ Bn)
TABLE 169 Brazil Natural Food Preservatives Market, by Type, 2023-2030 (US$ Bn)
TABLE 170 Brazil Natural Food Preservatives Market, by Function, 2017-2022 (US$ Bn)
TABLE 171 Brazil Natural Food Preservatives Market, by Function, 2023-2030 (US$ Bn)
TABLE 172 Brazil Natural Food Preservatives Market, by Application, 2017-2022 (US$ Bn)
TABLE 173 Brazil Natural Food Preservatives Market, by Application, 2023-2030 (US$ Bn)
TABLE 174 Argentina Natural Food Preservatives Market, by Type, 2017-2022 (US$ Bn)
TABLE 175 Argentina Natural Food Preservatives Market, by Type, 2023-2030 (US$ Bn)
TABLE 176 Argentina Natural Food Preservatives Market, by Function, 2017-2022 (US$ Bn)
TABLE 177 Argentina Natural Food Preservatives Market, by Function, 2023-2030 (US$ Bn)
TABLE 178 Argentina Natural Food Preservatives Market, by Application, 2017-2022 (US$ Bn)
TABLE 179 Argentina Natural Food Preservatives Market, by Application, 2023-2030 (US$ Bn)
TABLE 180 Rest of Latin America Natural Food Preservatives Market, by Type, 2017-2022 (US$ Bn)
TABLE 181 Rest of Latin America Natural Food Preservatives Market, by Type, 2023-2030 (US$ Bn)
TABLE 182 Rest of Latin America Natural Food Preservatives Market, by Function, 2017-2022 (US$ Bn)
TABLE 183 Rest of Latin America Natural Food Preservatives Market, by Function, 2023-2030 (US$ Bn)
TABLE 184 Rest of Latin America Natural Food Preservatives Market, by Application, 2017-2022 (US$ Bn)
TABLE 185 Rest of Latin America Natural Food Preservatives Market, by Application, 2023-2030 (US$ Bn)
TABLE 186 Middle East and Africa Natural Food Preservatives Market, by Type, 2017-2022 (US$ Bn)
TABLE 187 Middle East and Africa Natural Food Preservatives Market, by Type, 2023-2030 (US$ Bn)
TABLE 188 Middle East and Africa Natural Food Preservatives Market, by Function, 2017-2022 (US$ Bn)
TABLE 189 Middle East and Africa Natural Food Preservatives Market, by Function, 2023-2030 (US$ Bn)
TABLE 190 Middle East and Africa Natural Food Preservatives Market, by Application, 2017-2022 (US$ Bn)
TABLE 191 Middle East and Africa Natural Food Preservatives Market, by Application, 2023-2030 (US$ Bn)
TABLE 192 GCC Countries Natural Food Preservatives Market, by Type, 2017-2022 (US$ Bn)
TABLE 193 GCC Countries Natural Food Preservatives Market, by Type, 2023-2030 (US$ Bn)
TABLE 194 GCC Countries Natural Food Preservatives Market, by Function, 2017-2022 (US$ Bn)
TABLE 195 GCC Countries Natural Food Preservatives Market, by Function, 2023-2030 (US$ Bn)
TABLE 196 GCC Countries Natural Food Preservatives Market, by Application, 2017-2022 (US$ Bn)
TABLE 197 GCC Countries Natural Food Preservatives Market, by Application, 2023-2030 (US$ Bn)
TABLE 198 South Africa Natural Food Preservatives Market, by Type, 2017-2022 (US$ Bn)
TABLE 199 South Africa Natural Food Preservatives Market, by Type, 2023-2030 (US$ Bn)
TABLE 200 South Africa Natural Food Preservatives Market, by Function, 2017-2022 (US$ Bn)
TABLE 201 South Africa Natural Food Preservatives Market, by Function, 2023-2030 (US$ Bn)
TABLE 202 South Africa Natural Food Preservatives Market, by Application, 2017-2022 (US$ Bn)
TABLE 203 South Africa Natural Food Preservatives Market, by Application, 2023-2030 (US$ Bn)
TABLE 204 Rest of Middle East and Africa Natural Food Preservatives Market, by Type, 2017-2022 (US$ Bn)
TABLE 205 Rest of Middle East and Africa Natural Food Preservatives Market, by Type, 2023-2030 (US$ Bn)
TABLE 206 Rest of Middle East and Africa Natural Food Preservatives Market, by Function, 2017-2022 (US$ Bn)
TABLE 207 Rest of Middle East and Africa Natural Food Preservatives Market, by Function, 2023-2030 (US$ Bn)
TABLE 208 Rest of Middle East and Africa Natural Food Preservatives Market, by Application, 2017-2022 (US$ Bn)
TABLE 209 Rest of Middle East and Africa Natural Food Preservatives Market, by Application, 2023-2030 (US$ Bn)

Frequently asked questions

What is the current size of the global natural food preservatives market?

The global natural food preservatives market was valued at USD 0.4 Billion in 2022.

What is the expected growth rate of the natural food preservatives market between 2023 and 2030?

The natural food preservatives market is expected to grow at a CAGR of 7.2% between 2023 and 2030, reaching USD 0.6 Billion in 2030.

Which segment is leading the market share in terms of Type?

Salt is the leading segment by type, holding over 20% share in value in 2022.

Which Function segment governs the demand for natural food preservatives worldwide?

The antioxidants segment governs the global demand for natural food preservatives, holding a massive share of over 30% in 2022.

Which segment is expected to post the highest CAGR during the forecast period?

The Sea food, meat & poultry equipment segment is expected to post the highest CAGR during the forecast period.

Which region is fueling the growth of the natural food preservatives industry?

Europe is fueling the growth of the natural food preservatives industry, with an over one-third share in 2022.

Who are the major players in the global natural food preservatives market?

The top players include BASF SE (BASF), Koninklijke DSM N.V., Cargill, Inc, and ITA 3 S.r.l.

What are the major market drivers of the natural food preservatives industry?

The major market drivers are increasing consumer demand for clean-label and natural products, rising awareness of health and wellness, and expanding the organic and natural food sector.

What are the major market restraints of natural food preservatives industry?

The major market restraints are the limited shelf life of natural preservatives compared to synthetic alternatives, higher cost, and limited availability of natural preservatives.

What are the major market opportunities in the natural food preservatives industry?

Increasing consumer demand for clean label and natural products, expansion of the organic and natural food sector, and growing focus on sustainability and environmentally friendly practices.

Dehydrated Food Market

Published:
Report ID: 4904

Argan Oil Market

Published:
Report ID: 1674

India Pet Food Market

Published:
Report ID: 36785

Amla Extracts Market

Published:
Report ID: 12475

Fermented Beverages Market

Published:
Report ID: 6227

Dairy Ingredients Market

Published:
Report ID: 4463

Food & Beverage Vending Machines Market

Published:
Report ID: 5489

Functional Food Ingredients Market

Published:
Report ID: 5704

Food And Beverages Nano-Enabled Packaging Market

Published:
Report ID: 5488

Almond Oil Market

Published:
Report ID: 36611

Edible Gold Market

Published:
Report ID: 36608

Artificial Sweetener Market

Published:
Report ID: 36605

Purchase Options

$2999
Delivery Format: Excel.
$4999
Designed for the individual purchaser.
$6999
Users located at a single corporate site or regional office.
$7999
Allowed for unlimited sharing globally within one company.
Smallform of Sample request

Have a question?

User Profile

Don’t settle for less – trust Mitul to help you find the best solution.

Report delivery within 24 to 48 hours

– Other Info –

What people say?-

User Review

I am very impressed with the information in this report. The author clearly did their research when they came up with this product and it has already given me a lot of ideas.

Jana Schmidt
CEDAR CX Technologies

– Connect with us –

Phone

+91 6232 49 3207


support

24/7 Research Support


sales@credenceresearch.com

– Research Methodology –

Going beyond the basics: advanced techniques in research methodology

– Trusted By –

Pepshi, LG, Nestle
Motorola, Honeywell, Johnson and johnson
LG Chem, SIEMENS, Pfizer
Unilever, Samsonite, QIAGEN