
Off-patent medicines carry most of the PBS script load
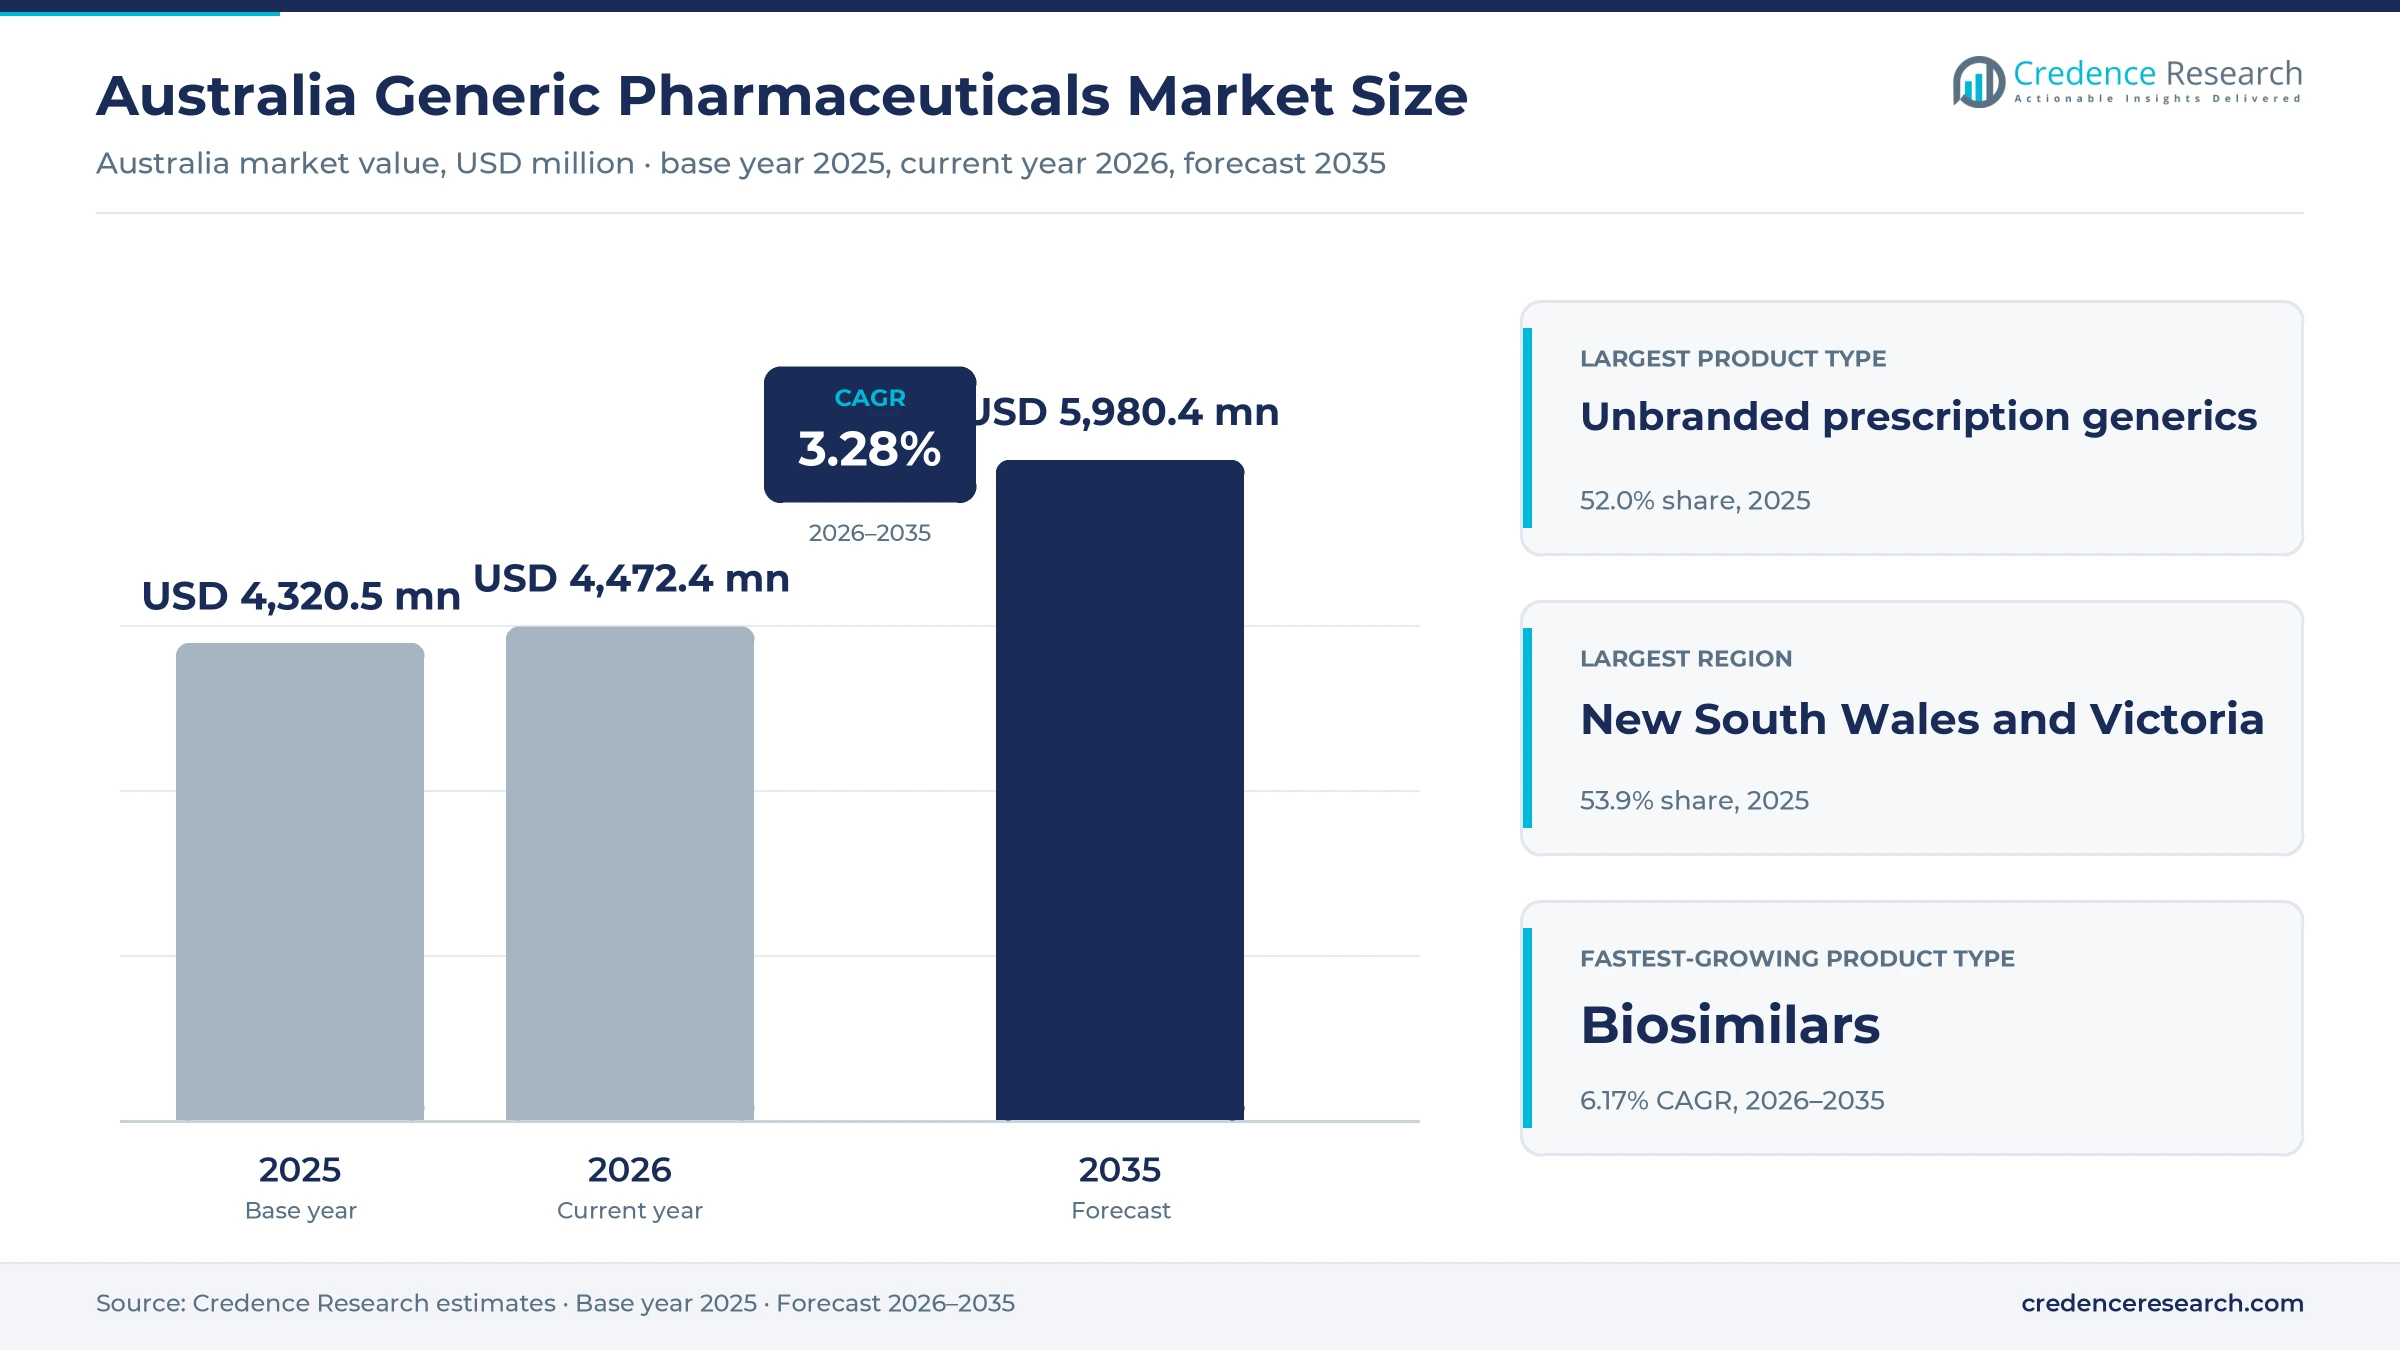
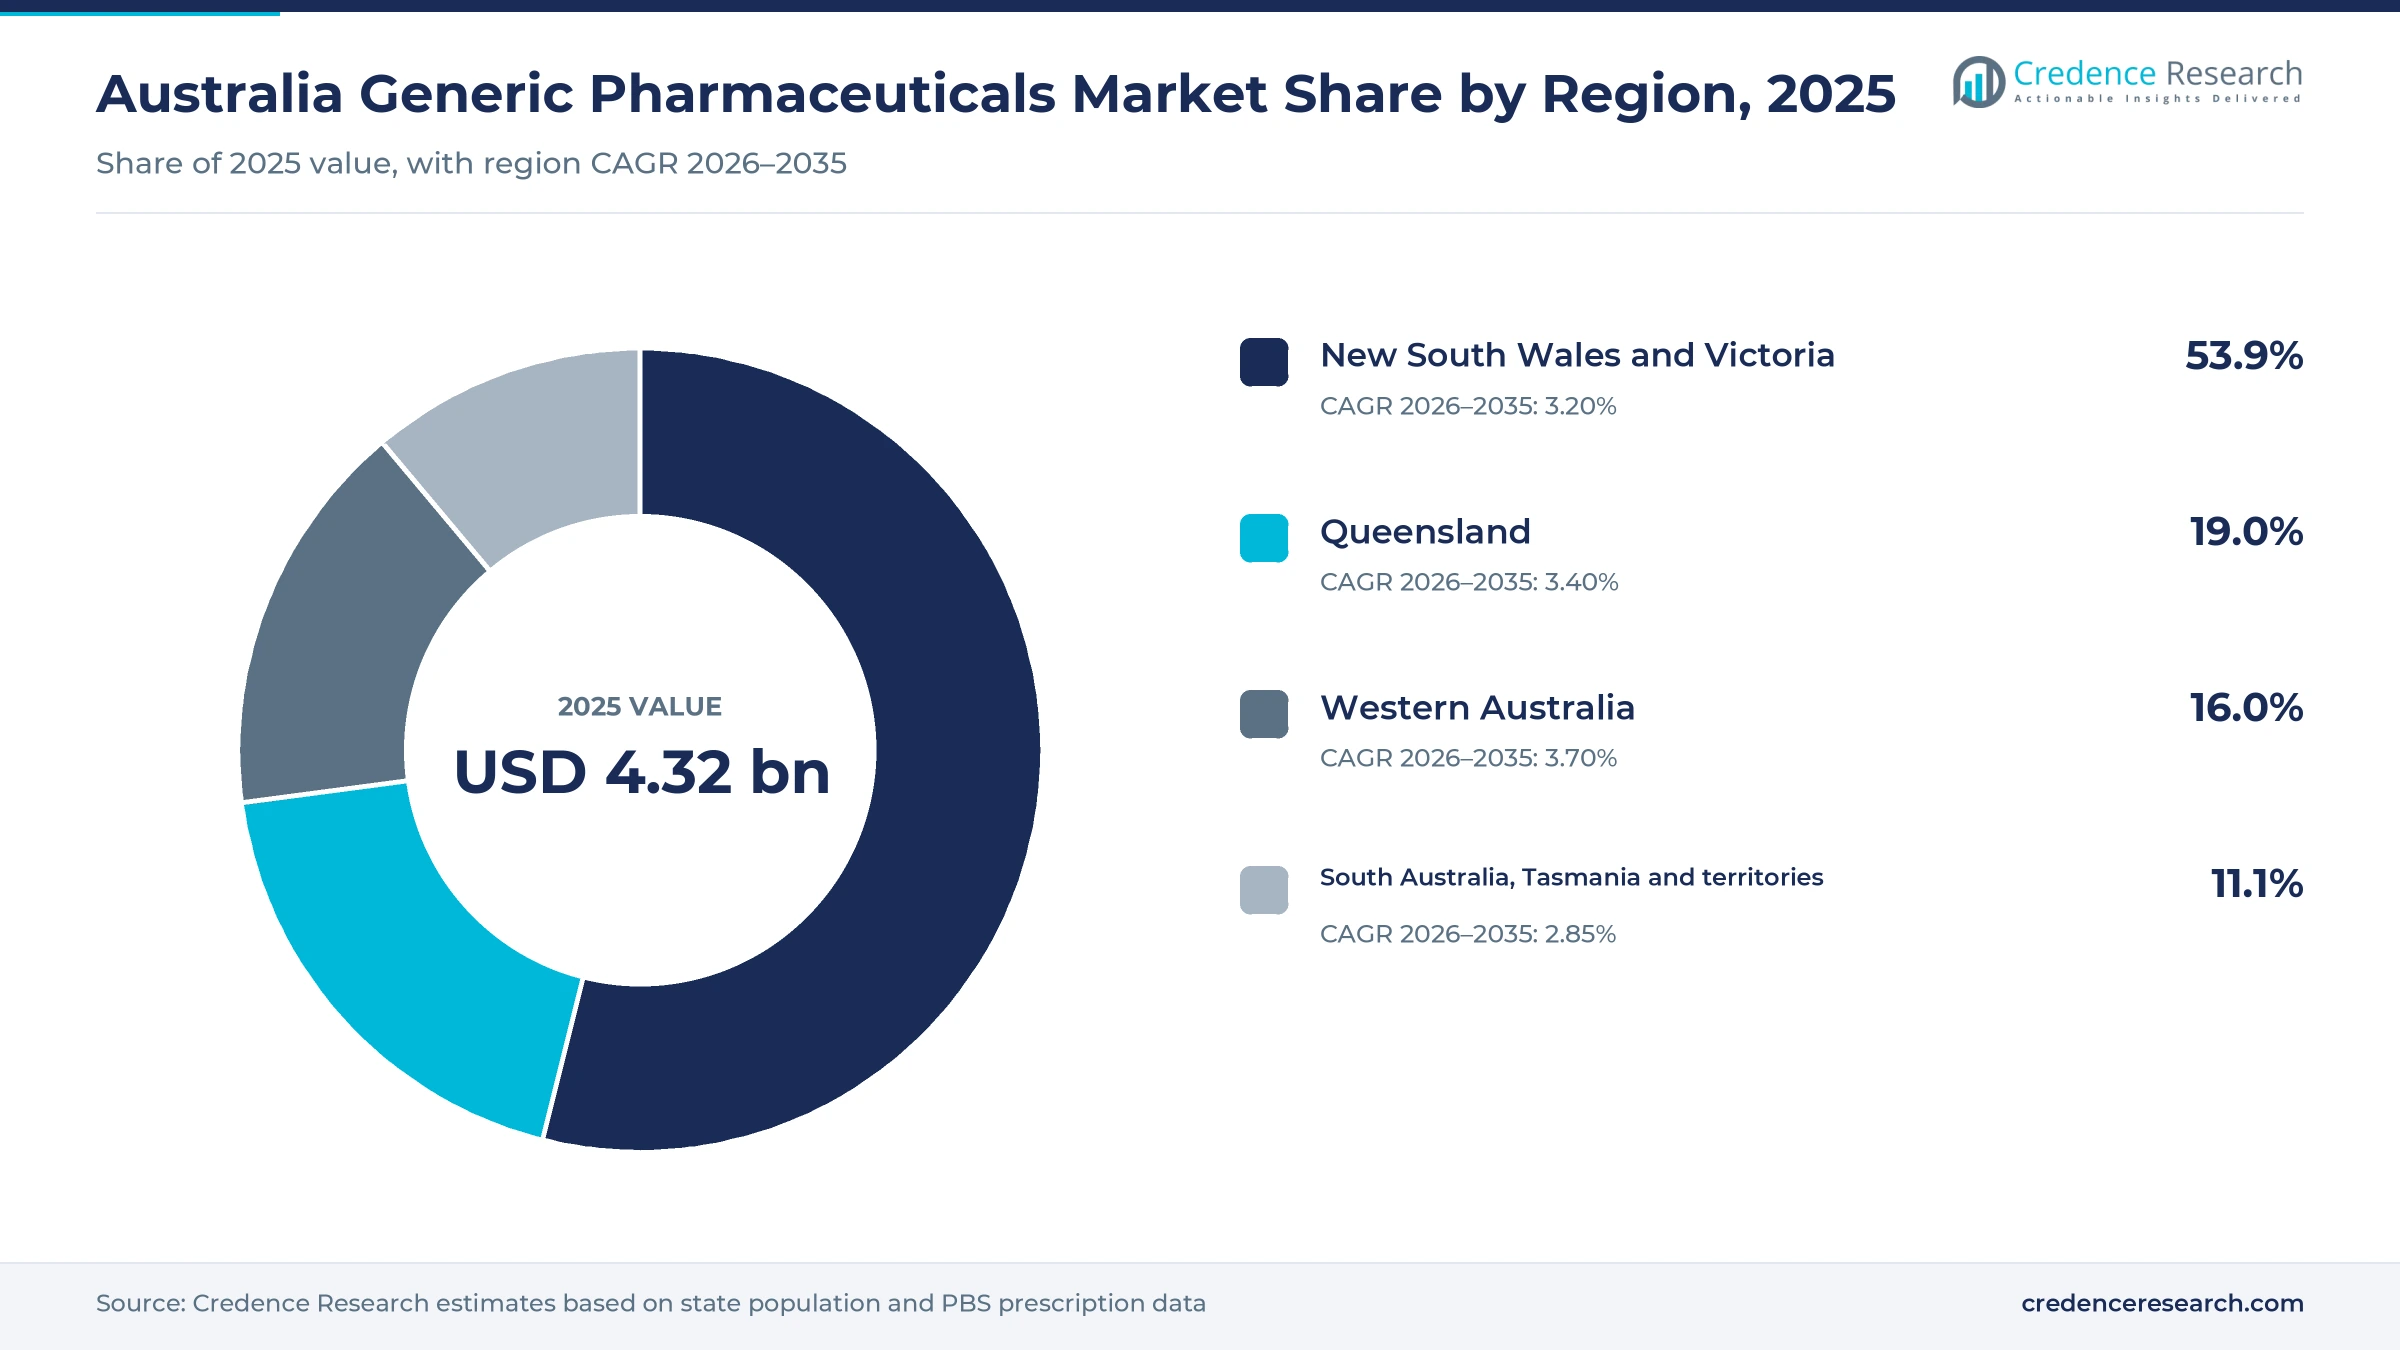
The Australia generic pharmaceuticals market was valued at USD 4.32 billion in 2025 and is projected to increase from USD 4.47 billion in 2026 to USD 5.98 billion by 2035, registering a CAGR of 3.28% during 2026–2035. Demand comes from people who refill medicines for high cholesterol, reflux, depression, blood pressure and diabetes every month, and from hospitals and aged care homes that buy off-patent products in bulk. Because pharmacists may substitute equivalent flagged brands at the counter, lower-priced generic and biosimilar brands compete on supply reliability, pharmacy terms and patient acceptance. New South Wales and Victoria held the largest regional share, 53.9% in 2025, while Western Australia is the fastest-growing region at 3.70% a year. In turn, the cut in the general patient co-payment to AUD 25 from Jan. 1, 2026, lowers the cost barrier for repeat prescriptions and supports steady dispensing volume across pharmacies.
Which off-patent medicines does the national estimate count?
The estimate measures the value of generic and biosimilar medicines sold in Australia at manufacturer selling prices. It counts unbranded and branded prescription generics, biosimilar brands of biological medicines and non-prescription generics supplied to community pharmacies, public and private hospitals, and residential aged care, whether products are imported finished, made locally or packed locally.
The estimate excludes originator brands that remain under patent, reference biological brands, compounded medicines, complementary medicines and veterinary products. The generic pharmaceuticals value chain runs from overseas and local manufacturers through Australian sponsors and full-line wholesalers to pharmacies, while state health services buy hospital volumes through direct tenders.
Australia Generic Pharmaceuticals Market Insights
- The Australia generic pharmaceuticals market was valued at USD 4.32 billion in 2025 and is projected to reach USD 5.98 billion by 2035, registering a CAGR of 3.28% during 2026–2035.
- New South Wales and Victoria held a 53.9% share of 2025 value, reflecting the largest populations and the highest PBS prescription counts in the country.
- Unbranded prescription generics led product types with a 52.0% share of 2025 value, because statins, acid suppressants and antidepressants dominate PBS dispensing volume.
- The PBS general patient co-payment fell from AUD 31.60 to AUD 25 on Jan. 1, 2026, while the concession co-payment stays at AUD 7.70 until 2030.
- Arrotex Pharmaceuticals states that it fulfills one in every two PBS scripts in Australia, which makes its supply reliability central to national access to off-patent medicines.
Unbranded scripts lead as biosimilars climb fastest
Why do unbranded scripts carry most off-patent value?
Based on product type, the market is categorized into Unbranded prescription generics, Branded prescription generics, Biosimilars and Non-prescription generics. Unbranded prescription generics led with a 52.0% share of 2025 value, because high-volume statins, acid suppressants and antidepressants are dispensed mainly under the active ingredient name. Biosimilars grow fastest at 6.17% a year, as new biosimilar brands of etanercept, denosumab and aflibercept reach the PBS.
How do pharmacies, hospitals and aged care split demand?
Based on care setting, the market is categorized into Community care, Hospital care and Residential aged care. Community care led with a 72.0% share of 2025 value, because most PBS prescriptions are filled at community pharmacies for people managing long-term conditions at home. Residential aged care grows fastest at 4.18% a year, as the number of older Australians living with several chronic conditions keeps rising.
Which disease areas generate the most off-patent value?
Based on disease area, the market is categorized into Cardiometabolic diseases, Neurological and psychiatric disorders, Infectious diseases and Specialty and multisystem conditions. Cardiometabolic diseases led with a 36.0% share of 2025 value, because cholesterol, blood pressure and diabetes medicines top PBS script counts. Specialty and multisystem conditions grow fastest at 4.35% a year, as biosimilars for arthritis, bone and eye disease widen the off-patent pool.
How do suppliers reach pharmacies and hospitals?
Based on sales channel, the market is categorized into Wholesale supply contracts, Direct institutional tenders and Direct pharmacy agreements. Wholesale supply contracts led with a 58.0% share of 2025 value, because full-line wholesalers deliver most PBS stock to community pharmacies. Direct institutional tenders grow fastest at 3.76% a year, as state health services tender biosimilars and injectables for public hospitals.
| Segment Group | Leading Sub-segment | Share, 2025 | Fastest-growing Sub-segment | CAGR, 2026–2035 |
|---|---|---|---|---|
| By Product Type | Unbranded prescription generics | 52.0% | Biosimilars | 6.17% |
| By Care Setting | Community care | 72.0% | Residential aged care | 4.18% |
| By Disease Area | Cardiometabolic diseases | 36.0% | Specialty and multisystem conditions | 4.35% |
| By Sales Channel | Wholesale supply contracts | 58.0% | Direct institutional tenders | 3.76% |
Request a Free Sample
Fill in your details and we'll send you a free sample report.
- Sample data tables & charts
- Research methodology
Chronic refills, biosimilar access and PBS reforms
How does repeat chronic treatment anchor generic volume?
Long-term conditions keep Australians on the same off-patent medicines for years, which gives generic suppliers a predictable refill base. One in two people, or 12.6 million, had at least one chronic condition in 2022, according to the Australian Bureau of Statistics, and mental and behavioral conditions affected 26.1% of the population. The PBS expenditure and prescriptions tables for 2024-25 show that rosuvastatin led prescription volume with 16.0 million scripts, followed by atorvastatin at 11.1 million and pantoprazole at 10.8 million. Metformin added 6.1 million scripts in the same year, which keeps diabetes treatment a core off-patent category. As a result, Cardiometabolic diseases held 36.0% of 2025 value across the national market.
Why does biosimilar market access widen the off-patent pool?
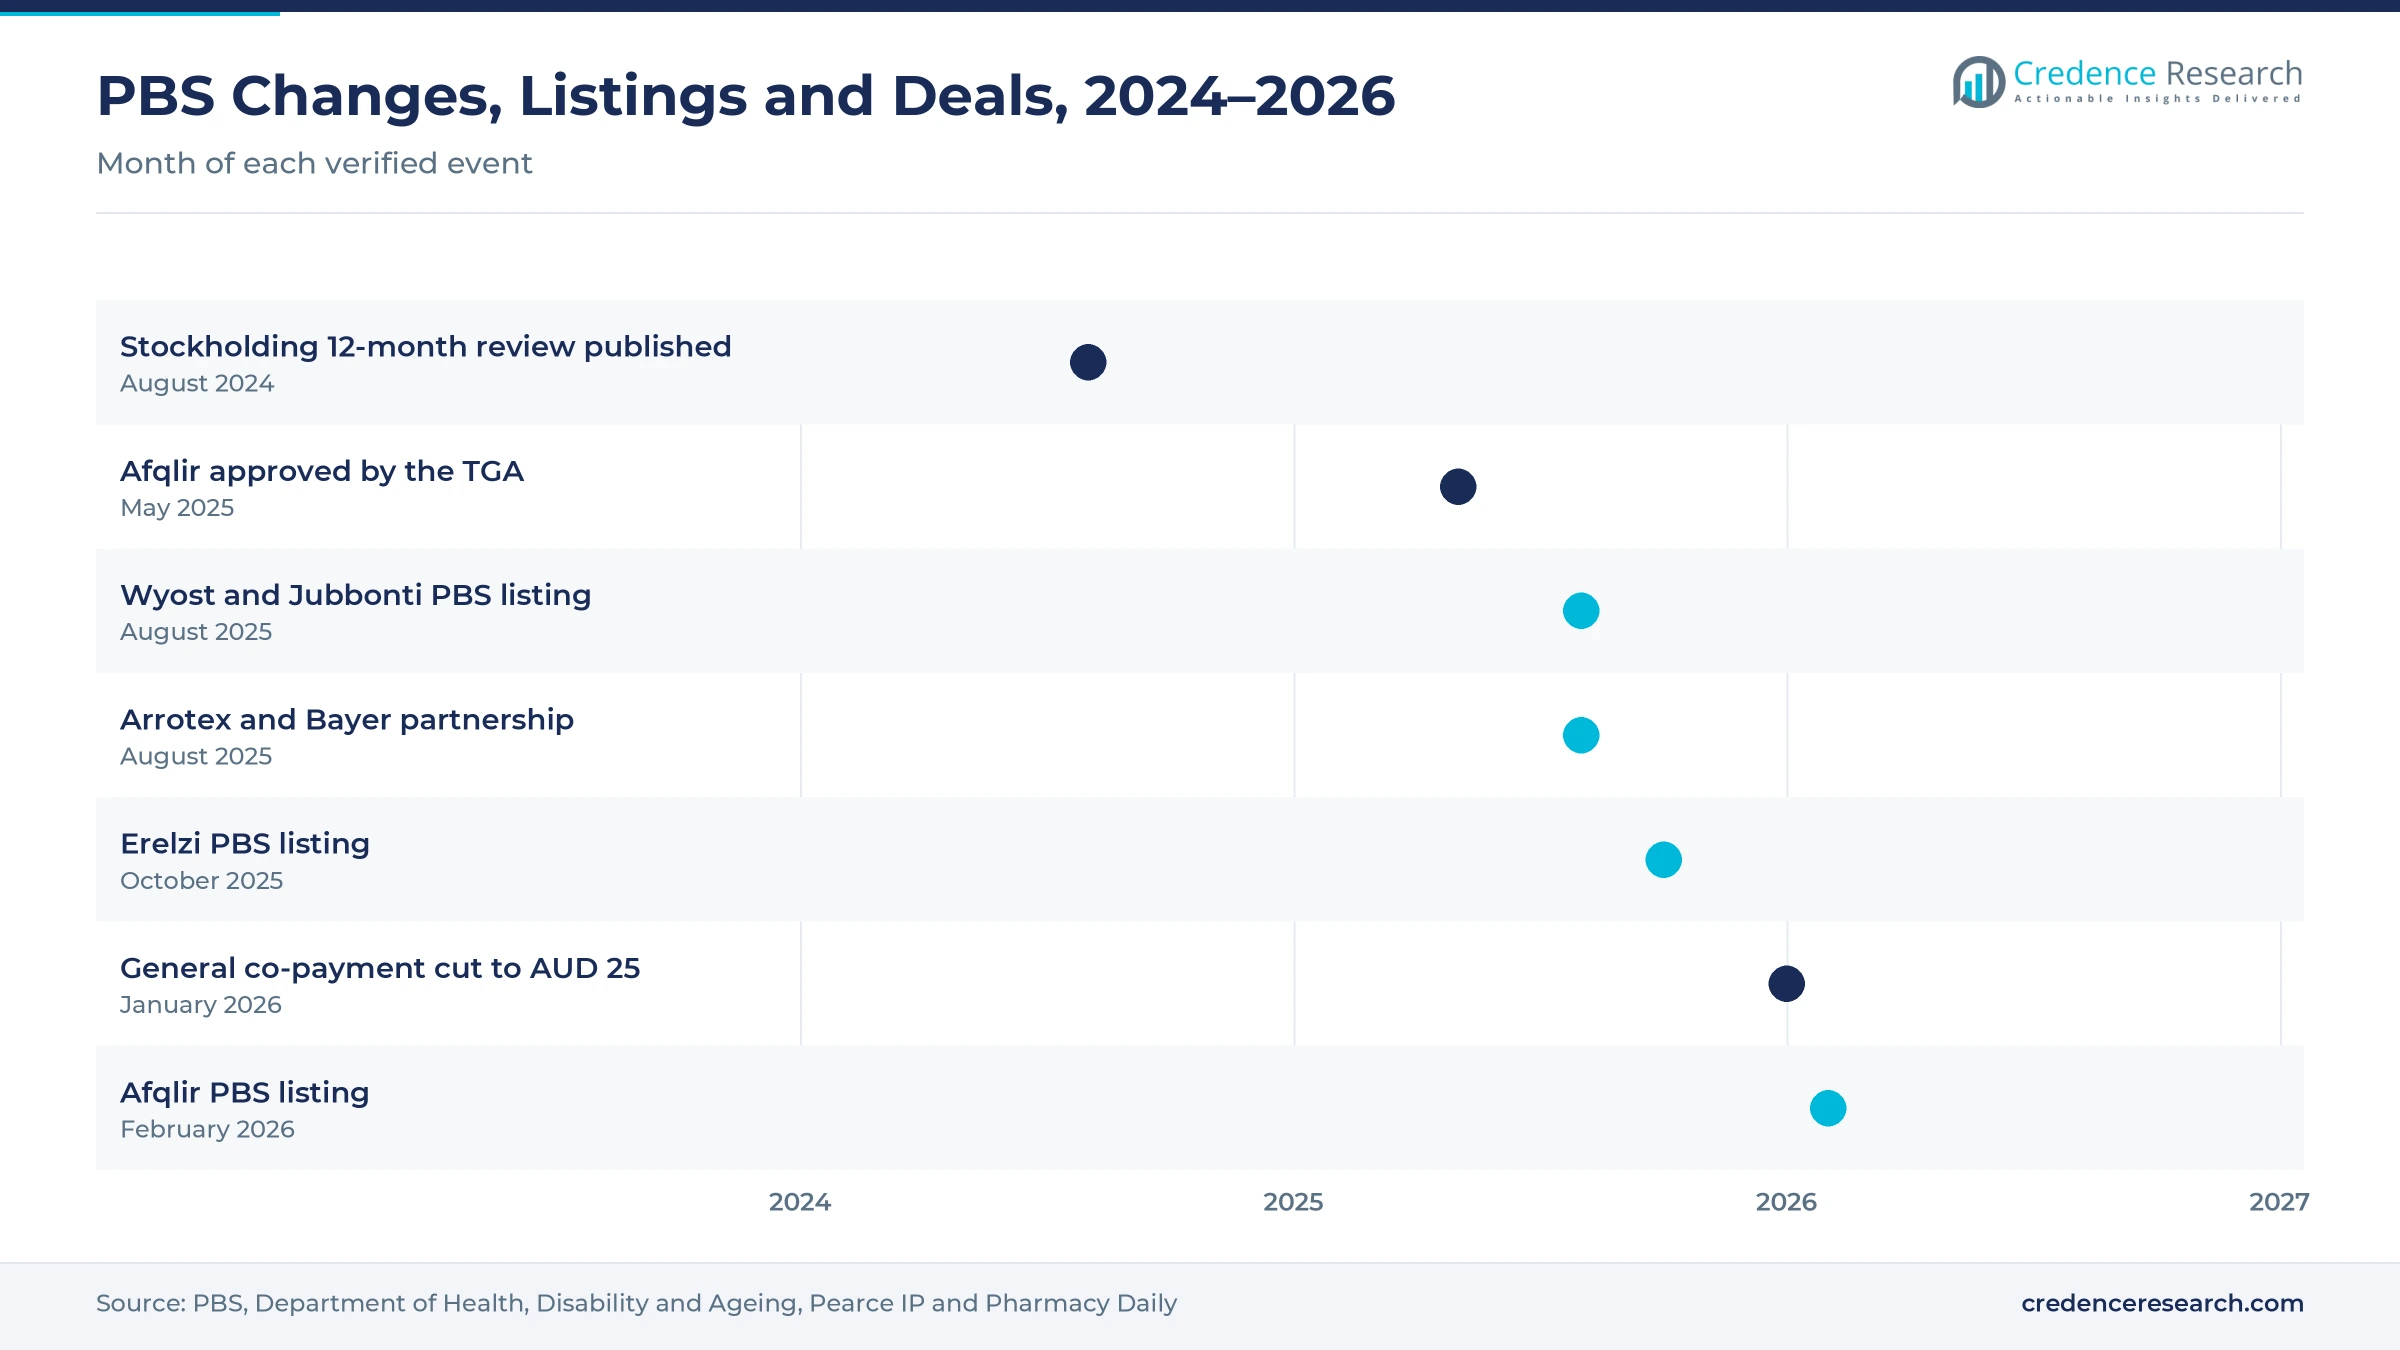
Policy settings that favor biosimilar medicines move costly biological treatments into the off-patent pool. Under uptake drivers agreed in the 2017 Budget process, the PBS encourages prescribing a biosimilar brand for treatment-naive patients and gives biosimilars a simpler streamlined authority. The Department of Health, Disability and Ageing states that the subsidized price of all brands falls by up to 25% when the first biosimilar of a biological medicine lists. Sandoz expanded its range in August 2025, when its denosumab biosimilars Wyost and Jubbonti were listed on the PBS, and law firm Pearce IP reports that Sandoz's Afqlir became the first PBS-listed aflibercept biosimilar on Feb. 1, 2026. As a result, Biosimilars grow fastest at 6.17% a year.
How do co-payment and prescribing reforms favor generics?
Affordability reforms lower out-of-pocket costs and steer prescriptions toward the lowest-priced equivalent brands. Active ingredient prescribing became mandatory on PBS and RPBS prescriptions from Feb. 1, 2021, and the PBS said the change was likely to increase use of generic and biosimilar medicines. Since Sept. 1, 2023, selected PBS medicines can be prescribed for 60 days, and the health department expected more than 300 medicines to qualify by September 2024. The Department of Health, Disability and Ageing cut the general patient co-payment from AUD 31.60 to AUD 25 on Jan. 1, 2026, and advises patients to ask for brands without a brand premium. In turn, community pharmacies remain the main outlet, and Community care held 72.0% of 2025 value.
How do stockholding rules reward reliable suppliers?
Supply-security rules raise the value of suppliers that can hold local inventory of low-cost medicines. Since July 1, 2023, sponsors of designated PBS brands must hold four or six months of stock in Australia under the Minimum Stockholding Requirements. A one-off price increase on Oct. 1, 2022, lifted the approved price of low-cost F2 medicines priced at AUD 2 or less to AUD 2.50. The PBS 24-month review found that designated brands with a six-month stockholding had shortage rates 20% lower than brands with a four-month requirement. The same review found that resolved shortages averaged 95 days after the rules began, compared with 126 days before. As a result, sponsors with deep local warehouses gain an edge in Wholesale supply contracts, which held 58.0% of 2025 value.
New biosimilar listings, partnerships and aged care
Why are biosimilar listings rising in eye and bone care?
Biosimilar competition is spreading from arthritis drugs into eye, bone and skin treatments, which shifts more hospital and specialist value into the off-patent pool. Pearce IP reports that Sandoz's etanercept biosimilar Erelzi became the third etanercept biosimilar on the PBS on Oct. 1, 2025, in syringe and pen devices. The same law firm reports that Celltrion's Steqeyma became the first PBS-listed ustekinumab biosimilar in August 2025, while the TGA approved Sandoz's Afqlir on May 27, 2025. PBS tables for 2024-25 show that the etanercept biosimilar Brenzys led biosimilar brands by government cost, with 51,657 subsidized prescriptions. In turn, Specialty and multisystem conditions grow fastest at 4.35% a year as these listings mature.
How are brand partnerships shifting the supplier mix?
Local generic leaders are adding established originator brands to their pharmacy portfolios, which blurs the line between generic and branded supply. Pharmacy Daily reported on Aug. 26, 2025, that Arrotex Pharmaceuticals and Bayer Australia announced a partnership under which Arrotex takes over sales, marketing and distribution of Bayer's Yaz and Yasmin oral contraceptives in Australia. DBG Health, the parent of Arrotex, states that the company offers more than 380 prescription medicines and 37 consumer health brands across 1,800 SKUs. It also describes Arrotex as the leading provider of hospital medicines to public and private hospitals in Australia. As a result, Unbranded prescription generics keep a 52.0% share while branded generic ranges widen through these licensing deals.
Can an older population open aged care supply growth?
An aging population creates an opening for suppliers that serve residential aged care with packed, reliable and low-cost medicines. Australians aged 65 and over made up 18.1% of the population in 2025, up from 17.4% in 2023, according to the World Bank. The ABS found that 50.2% of people aged 65 and over had two or more chronic conditions in 2022, which raises the number of daily medicines per resident. Active ingredient prescribing rules also exempt paper-based medication charts in residential aged care, so suppliers that support electronic charts and dose packing can win facility contracts. As a result, Residential aged care grows fastest at 4.18% a year.
Is domestic finishing a supply-security opening?
Shortage rules and price support create an opening for sponsors that make or pack medicines in Australia rather than relying fully on imports. Viatris states that it has more than 1,000 registered products in Australia, 900 of which are delivered through its Queensland warehouse, and that about one in three of its medicines supplied to Australian patients are made locally. A federal Supply Chain Resilience Initiative grant of AUD 1.1 million, approved in December 2021, backed investment in a new manufacturing suite at the Carole Park, Queensland, site that can add up to one billion doses a year. The PBS 24-month stockholding review found that 13 of 23 responding sponsors increased overseas production, so local contract manufacturing capacity remains a gap worth filling.
Price erosion, shortages and patent disputes
How does price disclosure erode supplier margins?
PBS price disclosure lowers the subsidized price of a medicine when suppliers give pharmacies large discounts, so competition steadily reduces the value of each script. Mature molecules such as statins and acid suppressants already sell at low prices, which leaves little room to absorb freight, currency and compliance costs. As a result, some sponsors withdraw low-margin brands from the PBS schedule. Floor price protections and the 2022 price increase for low-cost medicines ease this pressure for designated brands.
Why do shortages and import reliance remain a risk?
Many finished generic doses are imported, so factory problems, shipping delays and demand spikes abroad can leave Australian pharmacies short of common medicines. The PBS stockholding review found that fully unavailable shortages fell from 52% to 32% of all shortages, yet shortages still occur among designated brands. Brands with low compliance averaged a 13% monthly shortage rate in the review. Sponsors reduce this risk through larger local inventories, second suppliers and local packing.
How do patent disputes delay biosimilar launches?
Originator companies defend their biological brands in the Federal Court, which can delay biosimilar launches and raise legal costs for challengers. Regeneron and Bayer sued Sandoz in June 2025 over an aflibercept patent, and the court refused a preliminary injunction in September 2025. The parties settled all Australian aflibercept proceedings in December 2025 on undisclosed terms. Such disputes add timing risk to forecasts, so biosimilar sponsors prepare patent challenges well before planned launches.
Why do brand loyalty and premiums slow switching?
Some prescribers and patients prefer the originator brand they know, and prescribers can still tick the no-substitution box on a prescription. Patients who choose a brand with a premium pay more at the counter, while equivalent generic brands without a premium cost less. As a result, generic uptake varies by medicine, prescriber and pharmacy. Pharmacist advice, consumer education and active ingredient labels steadily reduce this barrier over time.
New South Wales and Victoria lead as WA grows fastest
| Region | Value, 2025 (USD billion) | Share, 2025 | CAGR, 2026–2035 |
|---|---|---|---|
| New South Wales and Victoria | 2.33 | 53.9% | 3.20% |
| Queensland | 0.82 | 19.0% | 3.40% |
| Western Australia | 0.69 | 16.0% | 3.70% |
| South Australia, Tasmania and territories | 0.48 | 11.1% | 2.85% |
Why do New South Wales and Victoria lead off-patent demand?
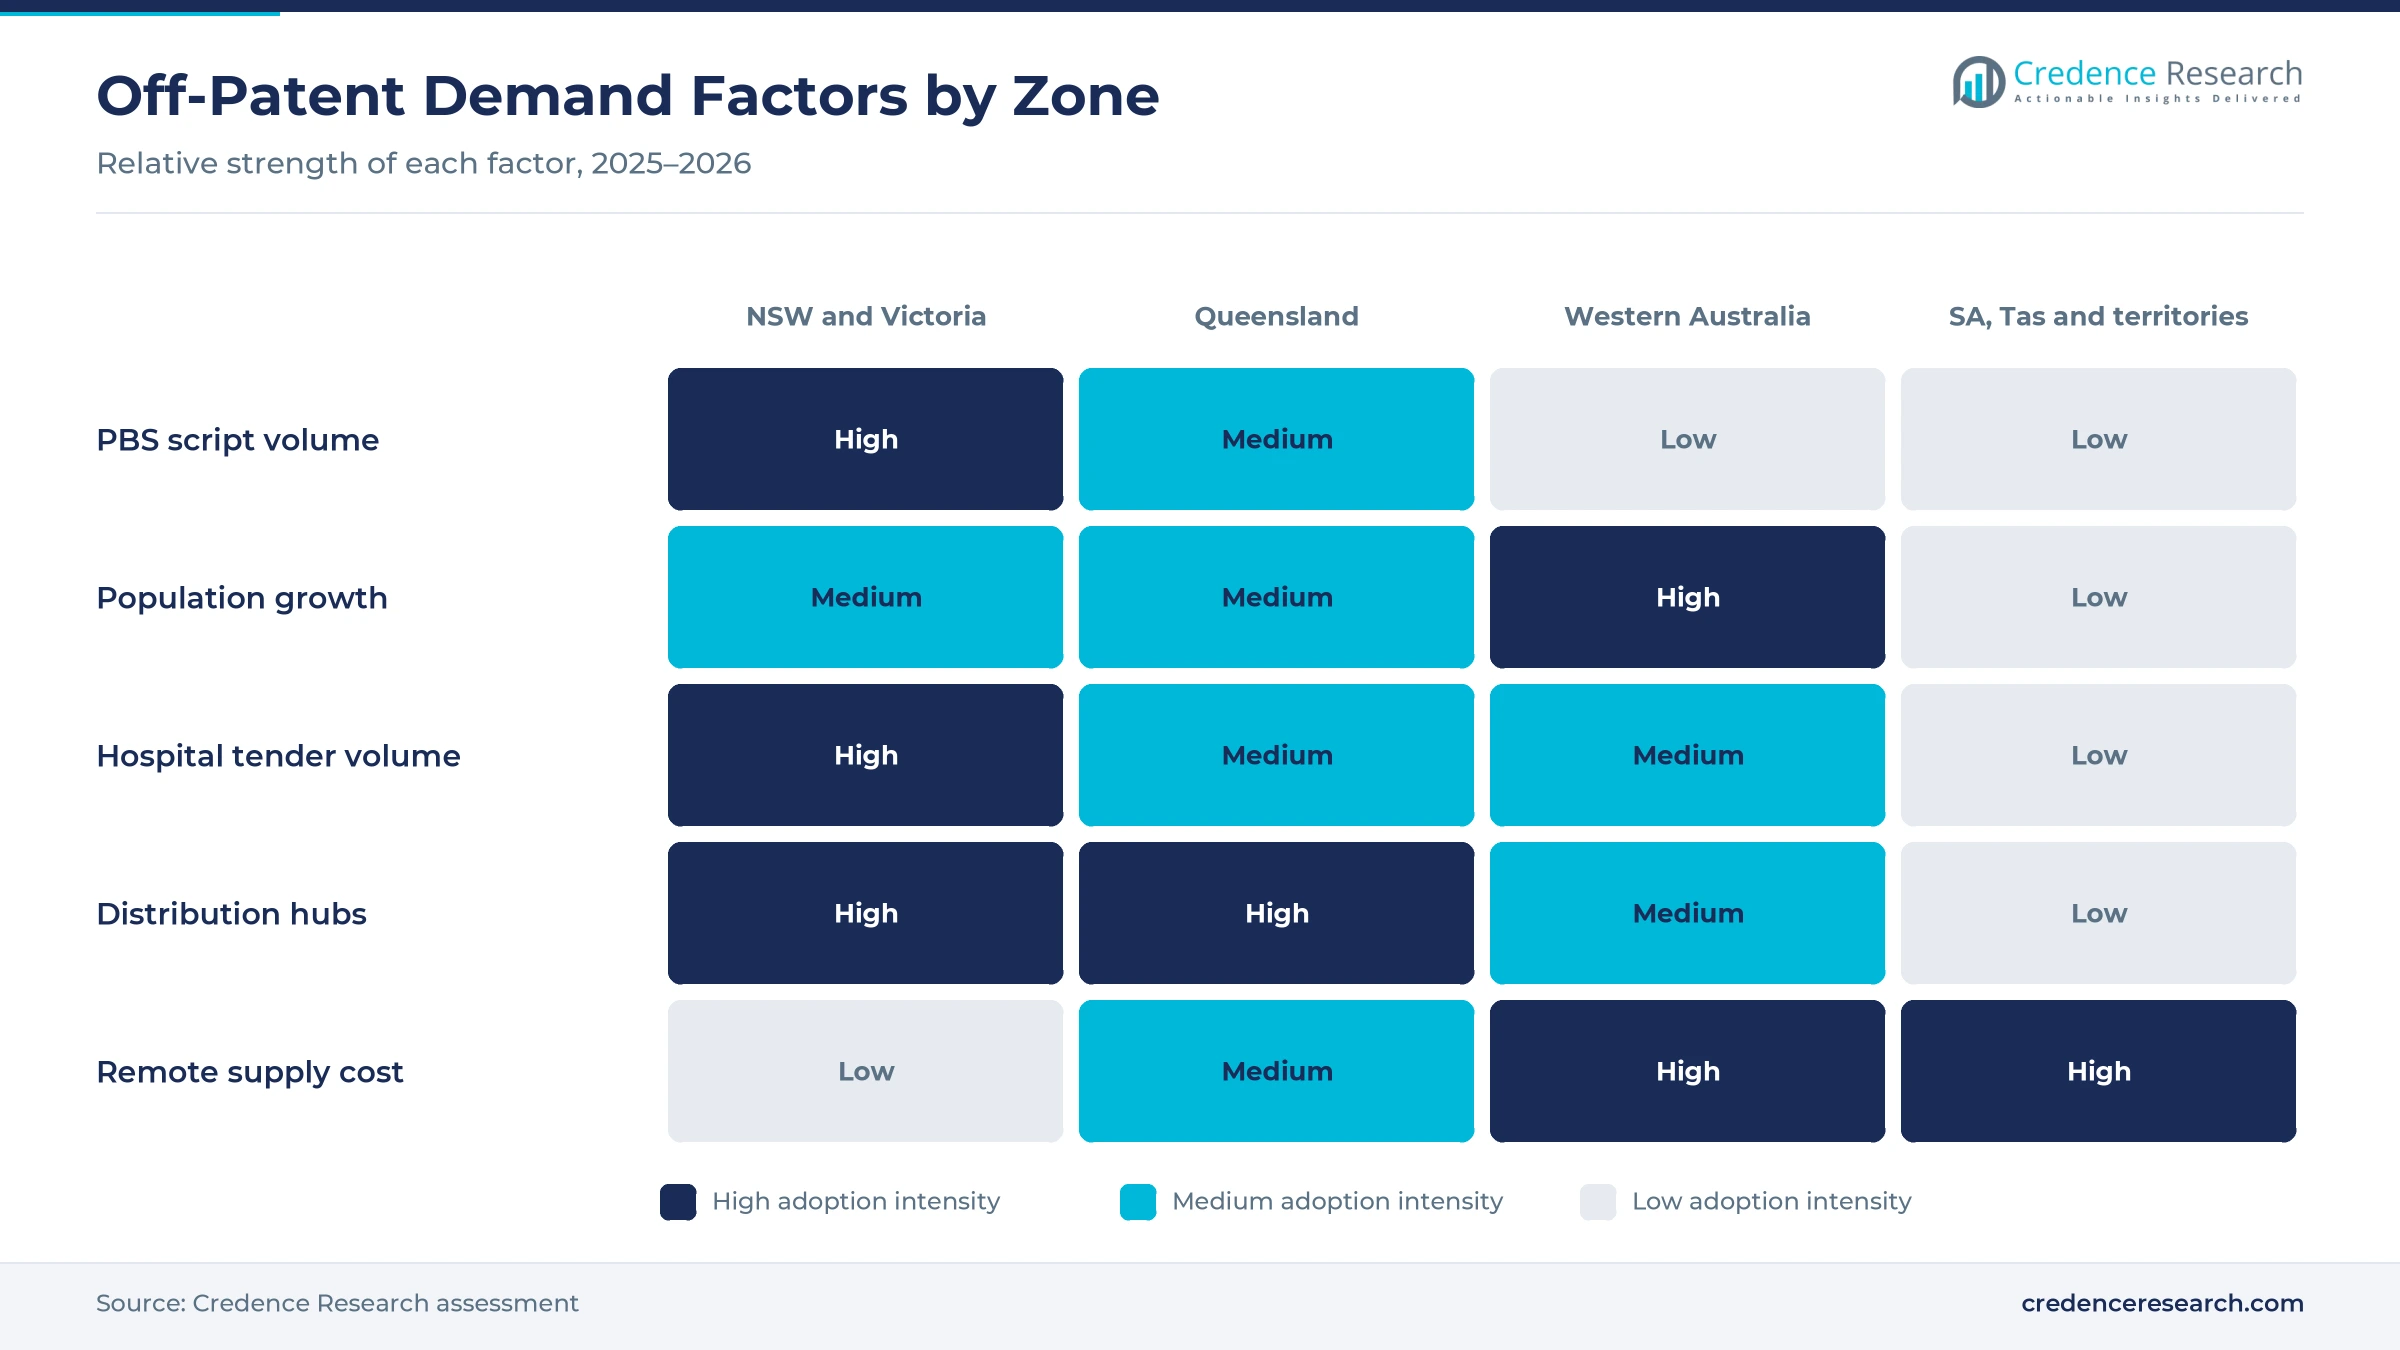
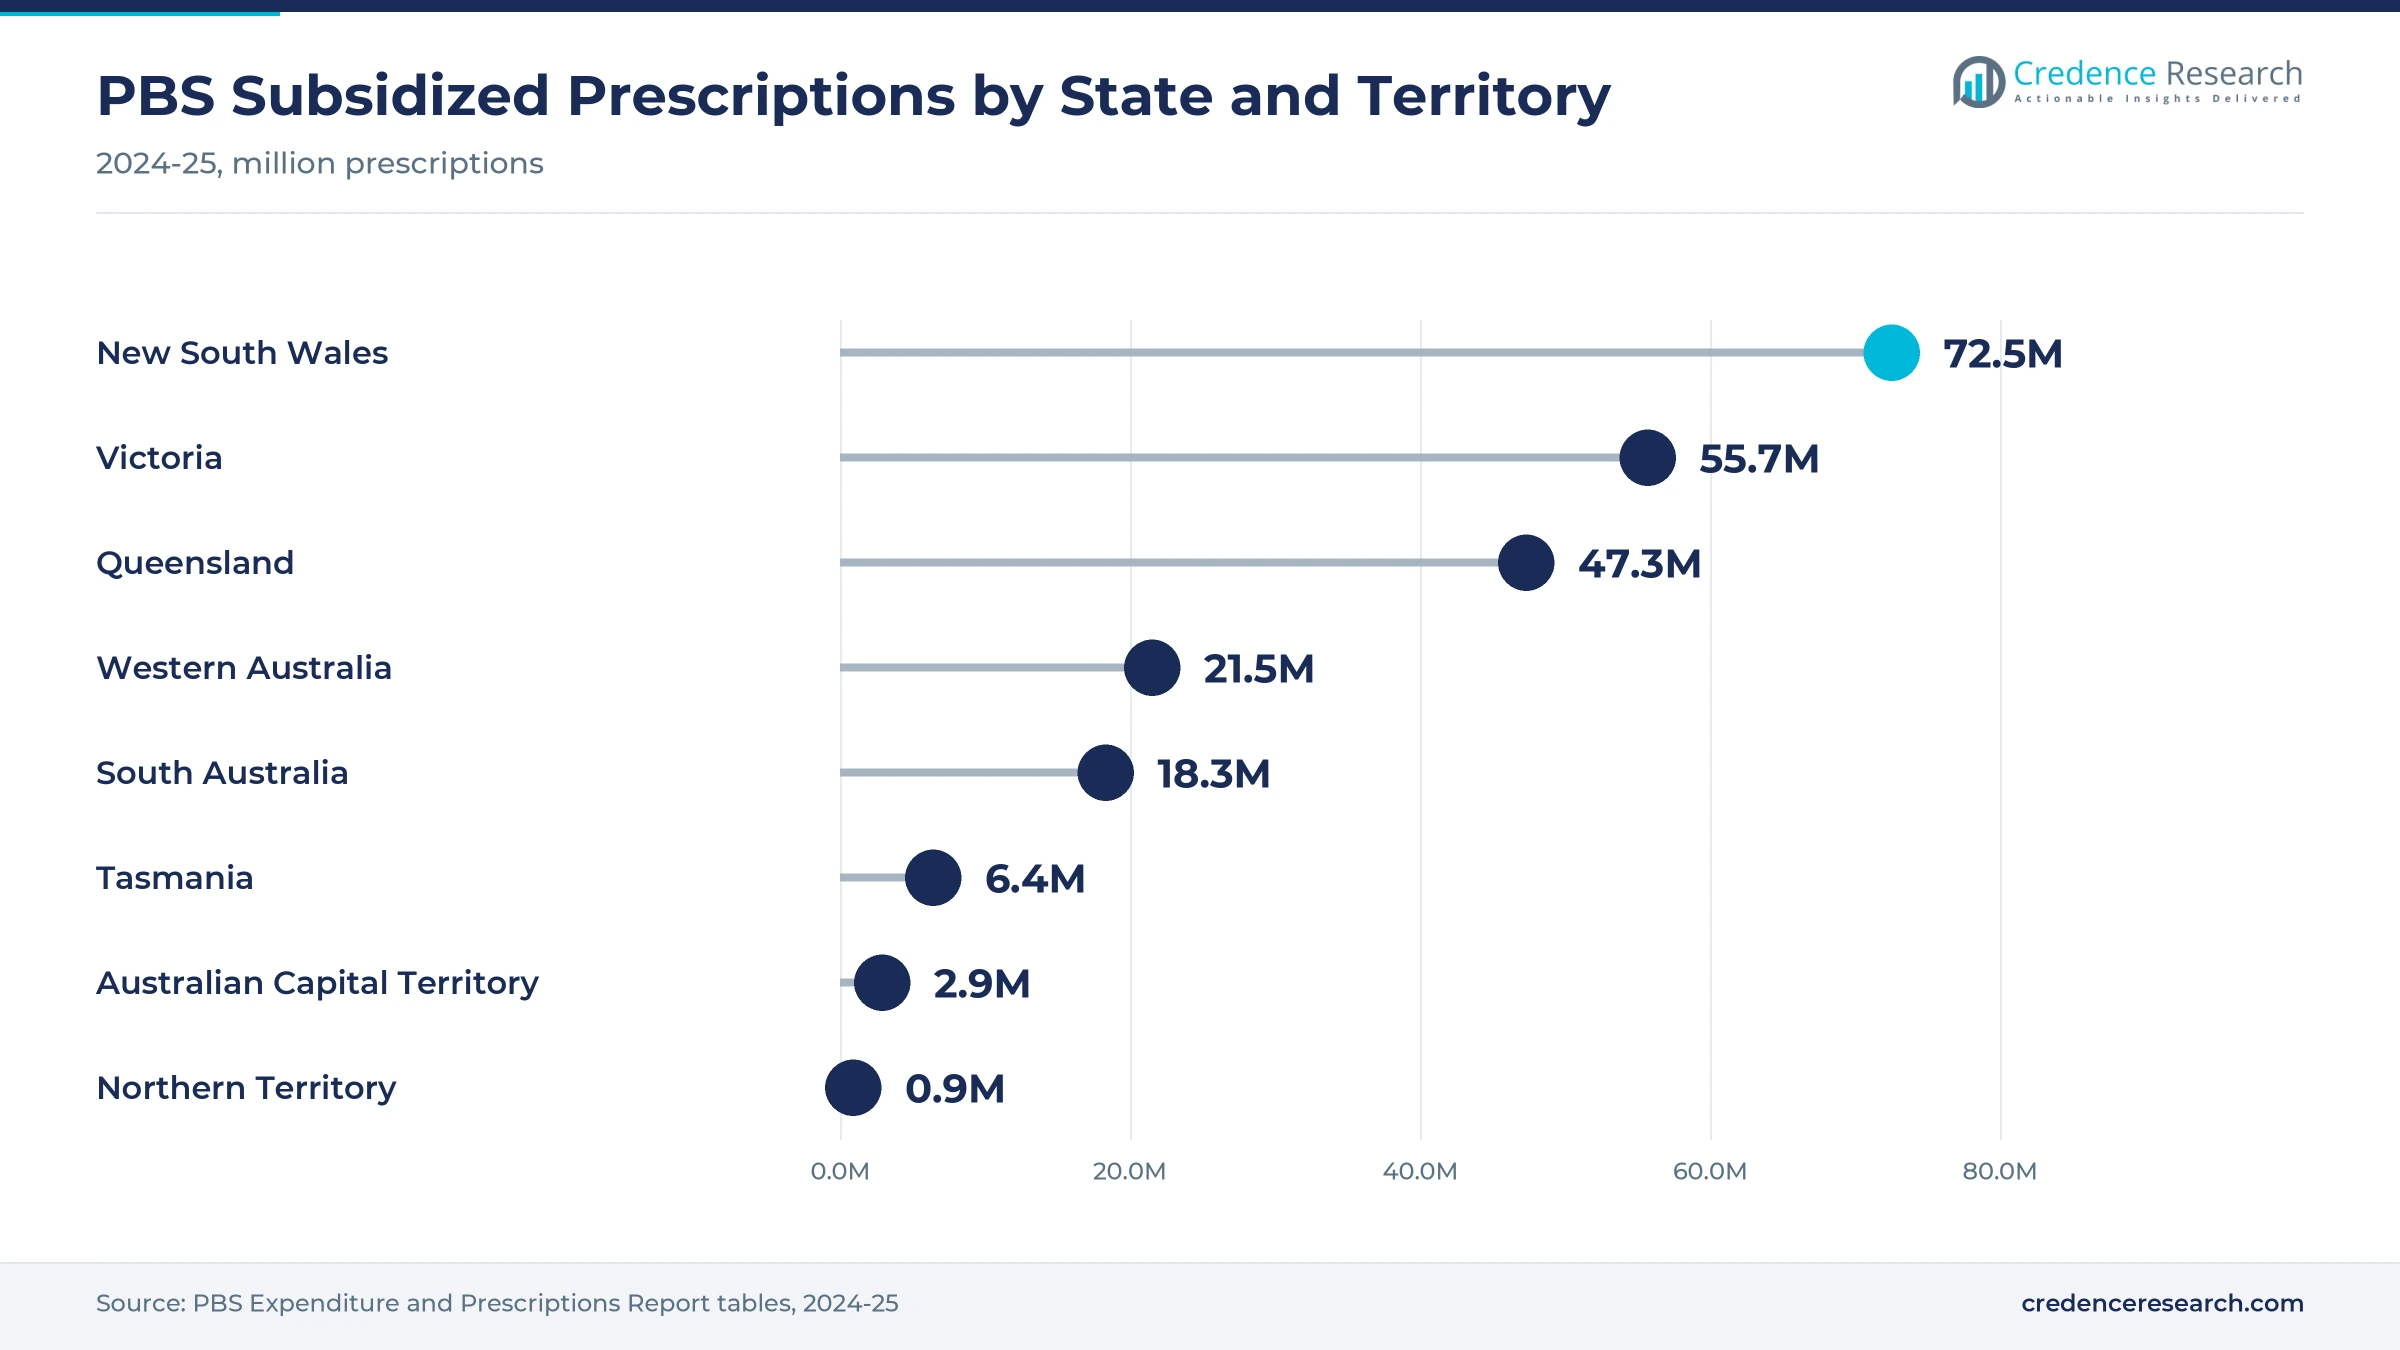
New South Wales and Victoria held 53.9% of 2025 value and grow at 3.20% a year, because the two states hold the largest populations and hospital networks. PBS tables show 72.5 million subsidized prescriptions in New South Wales and 55.7 million in Victoria in 2024-25. Victoria grew 1.6% to 7,154,200 residents in the year to March 31, 2026, while New South Wales grew 1.1% to 8,670,100. In turn, Victoria adds patients faster than its larger neighbor, and Melbourne and Sydney host dense pharmacy and hospital networks.
How do Perth suburbs and mining towns lift WA scripts?
Western Australia held 16.0% of 2025 value and grows fastest at 3.70% a year, because it has the fastest-growing population in the country. Generic medicine demand in the state rises with a population that grew 2.1% to 3,096,200 residents in the year to March 31, 2026, according to the ABS. PBS tables show 21.5 million subsidized prescriptions in the state in 2024-25, at a government cost of AUD 1.9 billion. As a result, new suburbs around Perth and mining regions add steady repeat prescriptions.
How does Queensland support steady generic supply?
Queensland held 19.0% of 2025 value and grows at 3.40% a year, as the state added 90,100 residents to reach 5,739,500 in the year to March 31, 2026. Queensland demand rests on 47.3 million subsidized prescriptions in 2024-25, the third-highest count among the states. Viatris delivers 900 registered products through its Queensland warehouse, which makes the state a national distribution hub. In turn, regional coastal towns with older residents sustain demand for cardiometabolic medicines.
Why do South Australia, Tasmania and territories grow slowest?
South Australia, Tasmania and territories held 11.1% of 2025 value and grow at 2.85% a year, the slowest rate among the zones. South Australia grew only 1.0% and Tasmania 0.6% in the year to March 31, 2026. PBS tables show 18.3 million subsidized prescriptions in South Australia, 6.4 million in Tasmania, 2.9 million in the Australian Capital Territory and 0.9 million in the Northern Territory in 2024-25. As a result, smaller and slower-growing populations keep this zone the smallest of the four regions.
PBS listings, co-payment cuts and deals, 2025–2026
| Development | Status and market relevance |
|---|---|
| In August 2025, Sandoz's denosumab biosimilars Wyost and Jubbonti became the first biosimilars of Prolia and Xgeva listed on the PBS. | Extended biosimilar competition to denosumab brands |
| In August 2025, Arrotex Pharmaceuticals and Bayer Australia announced a partnership under which Arrotex took over sales and distribution of Yaz and Yasmin. | Widened the branded range of the largest local supplier |
| In October 2025, Sandoz's Erelzi became the third etanercept biosimilar listed on the PBS, in syringe and pen devices. | Added price competition in rheumatology biologics |
| In January 2026, the PBS general patient co-payment fell from AUD 31.60 to AUD 25 for Medicare cardholders. | Lowers patient costs for repeat prescriptions |
| In February 2026, Sandoz's Afqlir became the first aflibercept biosimilar listed on the PBS, in vial and pre-filled syringe presentations. | Opened eye-care biologics to biosimilar competition |
Prescribing and pricing rules decide brand choice
- Active ingredient prescribing requires most PBS prescriptions to name the active ingredient first, which makes equivalent generic brands visible at the pharmacy.
- Brand substitution flags let pharmacists swap equivalent brands in consultation with the patient unless the prescriber marks that substitution is not permitted.
- Streamlined authority codes give biosimilar brands a faster approval route than reference biologics, which still need written or telephone authority.
- Price disclosure reduces the subsidized price of all brands when supplier discounts to pharmacies are large, which passes competition savings to the PBS.
Need a Custom Version of This Report?
Tailor the scope, geography, or segments to your exact requirements.
- Custom geography or segment scope
- Direct access to our analyst team
Local leaders and global groups compete on supply
Competition among suppliers of generic pharmaceuticals in Australia centers on one large local group and several global manufacturers. Arrotex Pharmaceuticals, owned by DBG Health, states that it fulfills one in every two PBS scripts and supplies public and private hospitals. Sandoz has added several recent biosimilar listings, including Erelzi, Wyost, Jubbonti and Afqlir. Viatris Australia holds more than 1,000 registered products and makes about one in three of the medicines it supplies locally. Lupin AU sells prescription generics and the Pharmacy Action range, and in July 2021 its subsidiary Generic Health signed an agreement to buy Southern Cross Pharma, adding more than 60 registered products. Teva Pharmaceuticals Australia supplies PBS brands from Macquarie Park, New South Wales. Rivals compete on stock reliability, pharmacy discounts, hospital tenders and the speed of first-to-market launches.
Which suppliers lead off-patent medicine supply in Australia?
| Company | Type | Role in the market |
|---|---|---|
| Arrotex Pharmaceuticals | Local generic leader | Fulfills one in two PBS scripts and supplies public and private hospitals |
| Sandoz | Generic and biosimilar maker | Listed Erelzi, Wyost, Jubbonti and Afqlir biosimilars on the PBS in 2025 and 2026 |
| Viatris Australia | Generic manufacturer | Holds over 1,000 registered products and runs a Queensland warehouse and plant |
| Lupin AU | Generic supplier | Sells prescription generics and Pharmacy Action over-the-counter medicines |
| Teva Pharmaceuticals Australia | Generic supplier | Supplies PBS-listed brands from Macquarie Park, New South Wales |
Credence Research view on off-patent demand to 2035
Credence Research's view is that Australian generic pharmaceuticals value will grow steadily rather than quickly, because volume growth from an aging population is offset by price disclosure cuts on mature molecules. Biosimilars are the main source of new value, as eye, bone and immunology biologics lose exclusivity and PBS settings favor biosimilar brands for new patients. The lower co-payment from January 2026 also supports adherence to repeat prescriptions. Supply reliability, local stock and hospital tender wins will decide which sponsors gain share, while patent disputes remain the main timing risk for new biosimilar launches.
How the national off-patent medicine estimate was built
The report uses 2025 as the base year on a calendar basis, and market values come from the Credence Research model. That model combines PBS expenditure and prescription statistics, state population data, chronic disease prevalence data and company product information. Segment splits and zone growth rates are Credence Research estimates, while zone shares follow the Credence Research regional split. Sources used are government agencies, official statistics, international organizations, legal publications, trade publications and company publications, and no interviews or surveys were conducted.
Biosimilars and lower co-payments shape 2035
Value across Australian generic pharmaceuticals is expected to reach USD 5.98 billion by 2035, a 3.28% CAGR during 2026–2035, as an aging population, new biosimilar listings and lower patient co-payments lift dispensing. Growth should be strongest in Western Australia, where population growth is fastest, and in residential aged care. Price disclosure will keep pressure on mature molecules, so sponsors will rely on biosimilars, hospital tenders and branded partnerships for value growth. Stockholding rules will reward suppliers that keep reliable local inventory through 2035.
Frequently Asked Questions
How big is the Australia generic pharmaceuticals market?
Which product type leads off-patent sales in Australia?
Which region leads off-patent medicine spending in Australia?
How does the lower PBS co-payment affect demand?
How does Australia encourage biosimilar use?
Which medicines are dispensed most often on the PBS?
Which companies supply off-patent medicines in Australia?
What are the main challenges for generic suppliers?
Table of Content
Chapter 1 Market Segmentation
- 1.1 Segmentation Framework
- 1.1.1 Product and Service Classification
- 1.1.2 Application and End-Use Classification
- 1.1.3 Technology and Solution Classification
- 1.1.4 Customer and Distribution Channel Classification
- 1.1.5 Geographic Segmentation
- 1.1.6 Market Segment Definitions and Boundaries
- 1.2 By Product Type
- 1.2.1 Unbranded prescription generics
- 1.2.2 Branded prescription generics
- 1.2.3 Biosimilars
- 1.2.4 Non-prescription generics
- 1.3 By Care Setting
- 1.3.1 Community care
- 1.3.2 Hospital care
- 1.3.3 Residential aged care
- 1.4 By Disease Area
- 1.4.1 Cardiometabolic diseases
- 1.4.2 Neurological and psychiatric disorders
- 1.4.3 Infectious diseases
- 1.4.4 Specialty and multisystem conditions
- 1.5 By Sales Channel
- 1.5.1 Wholesale supply contracts
- 1.5.2 Direct institutional tenders
- 1.5.3 Direct pharmacy agreements
Chapter 2 Introduction
- 2.1 Report Objectives and Scope
- 2.2 Product Definition and Industry Terminology
- 2.3 Market Inclusions and Exclusions
- 2.4 Research Process
- 2.4.1 Primary Research and Expert Interviews
- 2.4.2 Secondary Research and Source Review
- 2.4.3 Top-Down and Bottom-Up Estimation
- 2.4.4 Data Triangulation and Verification
- 2.5 Market Size Measurement Basis
- 2.5.1 2025: USD 4.32 billion → 2035: USD 5.98 billion
- 2.6 Historical and Forecast Reference Periods
- 2.6.1 Historical Period: 2018-2025
- 2.6.2 Base Year: 2025
- 2.6.3 Forecast Period: 2025-2035
- 2.7 Research Assumptions and Limitations
Chapter 3 Executive Summary
- 3.1 Market Snapshot and Key Findings
- 3.2 Base-Year Market Size, 2025
- 3.3 Forecast Market Size, 2035
- 3.4 Revenue and Volume Growth Outlook
- 3.5 Key Demand and Supply Indicators
- 3.6 Leading Market Segments
- 3.7 Fastest-Growing Market Opportunities
- 3.8 Regional Performance Highlights
- 3.9 Technology and Industry Transformation
- 3.10 Competitive Landscape Summary
- 3.11 Analyst View and Strategic Implications
Chapter 4 Australia Generic Pharmaceuticals Market Trends and Developments
- 4.1 Historical Industry Development, 2018-2025
- 4.2 Recent Market Trends and Developments
- 4.3 Demand and Customer Behavior Trends
- 4.4 Technology and Product Innovation
- 4.5 Artificial Intelligence, Automation and Digitalization
- 4.6 Local Manufacturing and Supply Chain Realignment
- 4.7 Industry Partnerships, Mergers and Acquisitions
- 4.8 Sustainability and Circular Economy Developments
- 4.9 Government and Private Sector Investment Trends
- 4.10 Emerging Business Models and Commercialization
- 4.11 Industry Developments and Announcements
Chapter 5 Australia Generic Pharmaceuticals Market Production, Supply and Demand Analysis
- 5.1 Demand Trend and Consumption Analysis, 2018-2025
- 5.2 Demand Forecast, 2025-2035
- 5.3 Production and Output Trend, 2018-2025
- 5.4 Production and Output Forecast, 2025-2035
- 5.5 Installed Capacity and Capacity Utilization
- 5.6 Company-Wise Production Plants and Statistics
- 5.6.1 Installed Production Capacity
- 5.6.2 Actual Production
- 5.6.3 Planned Capacity and Expansion Targets
- 5.7 Supply Chain Structure and Procurement Trends
- 5.8 Supply-Demand Gap and Bottlenecks
- 5.9 Import Dependence and Sourcing Structure
- 5.10 Contract Manufacturing and Outsourcing
- 5.11 Regional Supply and Demand Concentration
Chapter 6 Australia Generic Pharmaceuticals Market Pricing Analysis
- 6.1 Pricing Structure and Measurement
- 6.2 Historical Pricing Trends, 2018-2025
- 6.3 Pricing Outlook, 2025-2035
- 6.4 Average Selling Price and Unit Economics
- 6.5 Pricing by Product and Market Segment
- 6.6 Geographic Pricing Differences
- 6.7 Key Input, Energy, Labor and Logistics Costs
- 6.8 Contract Pricing and Purchasing Models
- 6.9 Pricing Sensitivity and Competitive Positioning
- 6.10 Price, Margin and Profitability Implications
Chapter 7 Australia Generic Pharmaceuticals Market Dynamics
- 7.1 Market Growth Drivers
- 7.1.1 Demand-Side Drivers
- 7.1.2 Technology and Innovation Drivers
- 7.1.3 Infrastructure and Investment Drivers
- 7.1.4 Regulatory and Policy Drivers
- 7.2 Market Restraints
- 7.2.1 Cost and Affordability Constraints
- 7.2.2 Technology and Adoption Barriers
- 7.2.3 Supply Chain and Operational Constraints
- 7.3 Market Challenges
- 7.3.1 Competitive Pressure and Margin Erosion
- 7.3.2 Skills, Infrastructure and Implementation Gaps
- 7.4 Emerging Market Opportunities
- 7.5 Market Dynamics Impact and Time-Horizon Assessment
Chapter 8 Australia Generic Pharmaceuticals Value Chain Analysis
- 8.1 Industry Value Chain Overview
- 8.2 Upstream Suppliers and Critical Inputs
- 8.3 Technology and Component Providers
- 8.4 Manufacturing or Service Delivery
- 8.5 Distribution, Channel Partners and Integrators
- 8.6 Downstream Applications and End Users
- 8.7 Value Addition and Profit Pools
- 8.8 Vertical Integration and Outsourcing
- 8.9 Supplier Concentration and Risk
- 8.10 Supply Chain Localization and Resilience
Chapter 9 Australia Generic Pharmaceuticals Market Regulations and Policies
- 9.1 Relevant Laws, Standards and Compliance Frameworks
- 9.2 Product, Service, Safety and Quality Requirements
- 9.3 Government Policies, Incentives and Subsidies
- 9.4 Imports, Exports and Trade Barriers
- 9.5 Public Procurement and Local Content Requirements
- 9.6 Environmental and Sustainability Compliance
- 9.7 Upcoming Policy Changes and Market Implications
Chapter 10 Australia Generic Pharmaceuticals Market Hotspots and Opportunities
- 10.1 Market Opportunity Mapping and Growth Hotspots
- 10.2 High-Growth Applications and Customer Groups
- 10.3 Underserved Markets and White-Space Opportunities
- 10.4 Emerging Technology and Product Opportunities
- 10.5 New Capacity and Investment Hotspots
- 10.6 Market Entry and Expansion Opportunities
- 10.7 Distribution and Partnership Opportunities
- 10.8 Near-Term and Long-Term Commercial Potential
- 10.9 Opportunity Attractiveness and Execution Risks
Chapter 11 Australia Generic Pharmaceuticals Market Outlook, 2025-2035
- 11.1 Market Size and Analysis
- 11.1.1 Revenue (Market Measurement: 2025: USD 4.32 billion → 2035: USD 5.98 billion)
- 11.1.2 Market Volume and Quantity Sold
- 11.1.3 Historical Market Size, 2018-2025
- 11.1.4 Base-Year Market Size, 2025
- 11.2 Market Forecast, 2025-2035
- 11.2.1 Revenue Forecast to 2035
- 11.2.2 Volume Forecast to 2035
- 11.2.3 CAGR and Year-on-Year Growth
- 11.2.4 Incremental Revenue Opportunity
- 11.3 Forecast Assumptions and Scenario Analysis
- 11.3.1 Base-Case Forecast
- 11.3.2 Optimistic and Conservative Scenarios
- 11.3.3 Technology, Pricing and Policy Sensitivities
- 11.4 Market Attractiveness and Growth Outlook
Chapter 12 Australia Generic Pharmaceuticals Market Segmentation and Outlook
- 12.1 Segmentation Summary and Market Shares, 2025
- 12.2 Largest and Fastest-Growing Segments
- 12.3 By Product Type - Market Size and Forecast, 2025-2035
- 12.3.1 Segment Definition and Scope
- 12.3.2 Historical Market Size, 2018-2025
- 12.3.3 Revenue Forecast, 2025-2035
- 12.3.4 Volume Forecast, 2025-2035
- 12.3.5 Base-Year Market Share, 2025
- 12.3.6 Segment CAGR and Growth Drivers
- 12.3.7 Subsegment Market Size and Forecast
- 12.3.7.1 Unbranded prescription generics
- 12.3.7.2 Branded prescription generics
- 12.3.7.3 Biosimilars
- 12.3.7.4 Non-prescription generics
- 12.3.8 Subsegment Pricing and Adoption Trends
- 12.3.9 Leading Suppliers and Competition
- 12.3.10 Regional Demand and Opportunities
- 12.4 By Care Setting - Market Size and Forecast, 2025-2035
- 12.4.1 Segment Definition and Scope
- 12.4.2 Historical Market Size, 2018-2025
- 12.4.3 Revenue Forecast, 2025-2035
- 12.4.4 Volume Forecast, 2025-2035
- 12.4.5 Base-Year Market Share, 2025
- 12.4.6 Segment CAGR and Growth Drivers
- 12.4.7 Subsegment Market Size and Forecast
- 12.4.7.1 Community care
- 12.4.7.2 Hospital care
- 12.4.7.3 Residential aged care
- 12.4.8 Subsegment Pricing and Adoption Trends
- 12.4.9 Leading Suppliers and Competition
- 12.4.10 Regional Demand and Opportunities
- 12.5 By Disease Area - Market Size and Forecast, 2025-2035
- 12.5.1 Segment Definition and Scope
- 12.5.2 Historical Market Size, 2018-2025
- 12.5.3 Revenue Forecast, 2025-2035
- 12.5.4 Volume Forecast, 2025-2035
- 12.5.5 Base-Year Market Share, 2025
- 12.5.6 Segment CAGR and Growth Drivers
- 12.5.7 Subsegment Market Size and Forecast
- 12.5.7.1 Cardiometabolic diseases
- 12.5.7.2 Neurological and psychiatric disorders
- 12.5.7.3 Infectious diseases
- 12.5.7.4 Specialty and multisystem conditions
- 12.5.8 Subsegment Pricing and Adoption Trends
- 12.5.9 Leading Suppliers and Competition
- 12.5.10 Regional Demand and Opportunities
- 12.6 By Sales Channel - Market Size and Forecast, 2025-2035
- 12.6.1 Segment Definition and Scope
- 12.6.2 Historical Market Size, 2018-2025
- 12.6.3 Revenue Forecast, 2025-2035
- 12.6.4 Volume Forecast, 2025-2035
- 12.6.5 Base-Year Market Share, 2025
- 12.6.6 Segment CAGR and Growth Drivers
- 12.6.7 Subsegment Market Size and Forecast
- 12.6.7.1 Wholesale supply contracts
- 12.6.7.2 Direct institutional tenders
- 12.6.7.3 Direct pharmacy agreements
- 12.6.8 Subsegment Pricing and Adoption Trends
- 12.6.9 Leading Suppliers and Competition
- 12.6.10 Regional Demand and Opportunities
- 12.7 Segment Growth Comparison
- 12.8 Segment Attractiveness and Priority Matrix
Chapter 13 Australia Generic Pharmaceuticals Geographic Market Outlook, 2025-2035
- 13.1 Domestic Market Distribution and Demand Clusters
- 13.2 State- or Province-Wise Market Size and Forecast, 2025-2035
- 13.3 City and Metropolitan Market Outlook
- 13.4 Industrial, Manufacturing and Commercial Clusters
- 13.5 Geographic Concentration of Key End Users
- 13.6 Local Pricing and Purchasing Differences
- 13.7 Domestic Production Facilities and Capacity Map
- 13.8 Local Infrastructure and Project Pipeline
- 13.9 State-Level Policy and Incentive Differences
- 13.10 Subnational Investment Hotspots and Opportunities
- 13.11 Distribution and Logistics Networks
- 13.12 Domestic Competitive Footprint
Chapter 14 Australia Generic Pharmaceuticals Technology, Innovation and Sustainability Outlook
- 14.1 Technology Landscape and Maturity
- 14.2 Product, Process and Service Innovation
- 14.3 AI, Automation and Digital Tools in the Industry
- 14.4 Technology Adoption and Performance Benchmarking
- 14.5 Innovation Pipeline and R&D Investment
- 14.6 Patent and Intellectual Property Trends
- 14.7 Energy Efficiency and Resource Management
- 14.8 Sustainability, Recycling and Circularity
- 14.9 Technology Roadmap, 2025-2035
- 14.10 Risks of Obsolescence and Technology Substitution
Chapter 15 Australia Generic Pharmaceuticals Market Key Strategic Imperatives
- 15.1 Growth and Market Entry Priorities
- 15.2 High-Return Products and Segments
- 15.3 Pricing, Profitability and Cost Optimization
- 15.4 Technology Investment and Product Differentiation
- 15.5 Supply Chain Localization and Resilience
- 15.6 Distribution and Customer Acquisition
- 15.7 Partnership, Acquisition and Capacity Strategy
- 15.8 Regional Expansion Priorities
- 15.9 Short-, Medium- and Long-Term Actions
Chapter 16 Competition Outlook
- 16.1 Industry Competition Characteristics
- 16.2 Market Structure and Concentration
- 16.3 Market Share and Competitive Positioning, 2025
- 16.4 Company-Wise Revenue and Product Benchmarking
- 16.5 Production and Service Capacity Benchmarking
- 16.6 Technology, Pricing and Differentiation
- 16.7 Regional Footprint and Distribution Strength
- 16.8 Mergers, Acquisitions and Strategic Alliances
- 16.9 New Entrants and Competitive Threats
- 16.10 Porter's Five Forces and Industry Attractiveness
- 16.11 Competitive Outlook, 2025-2035
Chapter 17 Company Profiles
- 17.1 Company Coverage and Selection Criteria
- 17.2 Arrotex Pharmaceuticals
- 17.2.1 Business Description
- 17.2.2 Company Ownership and Geographic Presence
- 17.2.3 Product and Service Portfolio
- 17.2.4 Manufacturing and Operating Footprint
- 17.2.5 Production Capacity and Expansion Plans
- 17.2.6 Financial Performance and Investment
- 17.2.7 Market Share and Competitive Position
- 17.2.8 Technology and Innovation Capabilities
- 17.2.9 Strategic Alliances or Partnerships
- 17.2.10 Recent Developments
- 17.2.11 Growth Strategy and Outlook
- 17.3 Sandoz
- 17.4 Viatris Australia
- 17.5 Lupin AU
- 17.6 Teva Pharmaceuticals Australia
- 17.7 Other Relevant Market Participants
Note: Every listed company is profiled on the structure shown under the first company. The company list is preliminary and may change based on research findings, market developments, data availability and client requirements.
Chapter 18 Disclaimer
- 18.1 Research and Forecast Disclaimer
- 18.2 Data Source and Estimation Limitations
Note: The depth of individual sections depends on data availability for this market. Volume, capacity, trade and other unit-based metrics are included where applicable.

