
Market Overview
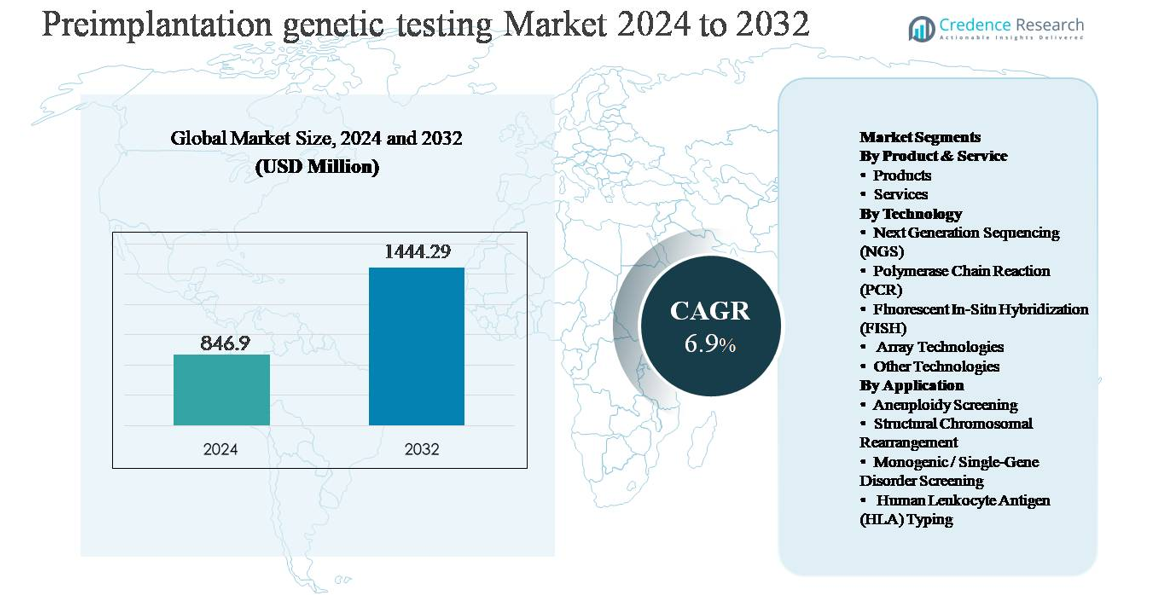
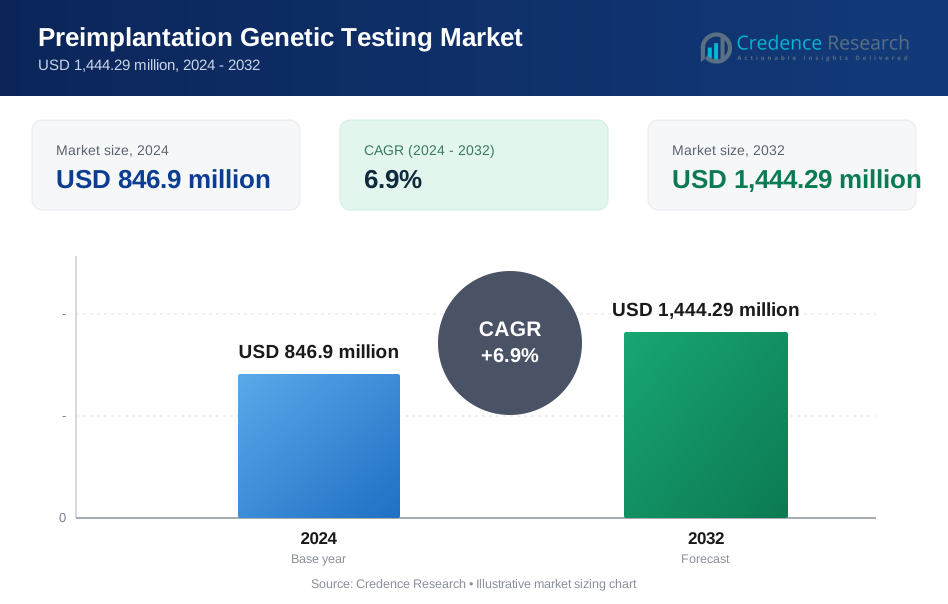
The preimplantation genetic testing (PGT) market was valued at USD 846.9 million in 2024 and is projected to reach USD 1,444.29 million by 2032, expanding at a compound annual growth rate (CAGR) of 6.9% during the forecast period.
| REPORT ATTRIBUTE | DETAILS |
|---|---|
| Historical Period | 2020-2023 |
| Base Year | 2024 |
| Forecast Period | 2025-2032 |
| Preimplantation Genetic Testing Market Size 2024 | USD 846.9 million |
| Preimplantation Genetic Testing Market, CAGR | 6.9% |
| Preimplantation Genetic Testing Market Size 2032 | USD 1,444.29 million |
The preimplantation genetic testing market is led by a group of globally established diagnostics and genomics companies, including Illumina, Thermo Fisher Scientific, Agilent Technologies, Natera, Fulgent Genetics, Takara Bio, Revvity, Medicover Genetics, Genea BIOMEDX, and RGI. These players compete through advanced sequencing platforms, validated PGT workflows, and strong integration with fertility clinics and reference laboratories. North America is the leading regional market, accounting for approximately 39% of global market share, driven by high IVF adoption, advanced genetic testing infrastructure, and early uptake of NGS-based PGT. Europe follows with around 31% share, supported by established reproductive medicine networks and genetic disease prevention programs, while Asia-Pacific holds about 21%, reflecting rapid expansion of private fertility services and improving access to advanced diagnostics.
Market Insights
- The preimplantation genetic testing market was valued at USD 846.9 million in 2024 and is projected to reach USD 1,444.29 million by 2032, growing at a CAGR of 6.9% during the forecast period, supported by increasing integration of genetic screening in IVF workflows.
- Market growth is primarily driven by rising IVF procedure volumes, increasing maternal age, and higher clinical emphasis on reducing implantation failure and miscarriage risks through aneuploidy and monogenic disorder screening.
- Key trends include the dominance of NGS technology with ~45-50% segment share, growing preference for comprehensive PGT panels, and increasing outsourcing of testing services, which account for ~60–65% of the product & service segment.
- The competitive landscape is shaped by global genomics and diagnostics players focusing on high-throughput sequencing, faster turnaround times, clinic partnerships, and scalable service models to strengthen market presence.
- Regionally, North America leads with ~39% market share, followed by Europe at ~31% and Asia-Pacific at ~21%, with Asia-Pacific showing the fastest growth due to expanding fertility clinics and improving access to advanced diagnostics.
Market Segmentation Analysis:
By Product & Service:
Within the preimplantation genetic testing market, services represent the dominant sub-segment, accounting for an estimated ~60-65% market share. This dominance is driven by the complexity of embryo biopsy interpretation, stringent quality requirements, and the need for certified laboratories with advanced bioinformatics capabilities. Fertility clinics increasingly outsource testing to specialized service providers to ensure diagnostic accuracy, regulatory compliance, and faster turnaround times. Meanwhile, products including reagents, consumables, and testing kits maintain steady demand, supported by rising IVF procedure volumes and continuous improvements in assay sensitivity and workflow standardization.
- For instance, Natera’s PGT services utilize high-depth NGS workflows capable of analyzing whole-genome amplified embryo samples with read lengths of 2 × 150 base pairs, enabling reliable detection of chromosomal copy number variations. Meanwhile, products such as reagents, consumables, and kits sustain steady demand as IVF volumes rise.
By Technology:
Next Generation Sequencing (NGS) is the leading technology sub-segment, holding approximately 45-50% market share, due to its high resolution, scalability, and ability to simultaneously detect aneuploidies, segmental imbalances, and single-gene mutations. NGS adoption is driven by declining sequencing costs, improved data analytics, and its compatibility with comprehensive PGT workflows. PCR and FISH remain relevant in targeted or legacy applications, while array-based technologies continue to serve structural variation analysis. However, limited multiplexing and lower resolution constrain their growth relative to NGS-driven platforms.
- For instance, Illumina’s NovaSeq X platform can generate up to 16 terabases of data per run, enabling high-depth embryo analysis with consistent coverage.
By Application:
Aneuploidy screening dominates the application segment, contributing nearly 50% of overall market revenue, as it is routinely integrated into IVF cycles to improve implantation rates and reduce miscarriage risk. The primary drivers include rising maternal age, higher IVF success optimization goals, and growing clinical consensus on PGT-A benefits. Monogenic/single-gene disorder screening is expanding steadily, supported by increased awareness of inherited diseases and carrier screening programs. Structural chromosomal rearrangement testing and HLA typing remain niche but critical, particularly for recurrent pregnancy loss and sibling donor selection cases.
Key Growth Drivers
Rising Global IVF Procedure Volumes
The steady increase in in vitro fertilization (IVF) procedures worldwide is a primary growth driver for the preimplantation genetic testing (PGT) market. Factors such as delayed parenthood, rising infertility prevalence, lifestyle-related reproductive disorders, and greater social acceptance of assisted reproductive technologies are expanding the IVF patient pool. As IVF cycles increase, clinicians increasingly integrate PGT to improve implantation rates, reduce miscarriage risk, and minimize the likelihood of genetic abnormalities. Fertility clinics view PGT as a value-enhancing adjunct that supports better clinical outcomes and patient confidence. The growing number of private fertility centers, particularly in emerging economies, further reinforces routine PGT adoption as part of standardized IVF protocols.
- For instance, Genea BIOMEDX supports IVF laboratories with time-lapse incubation systems capable of capturing over 5,000 embryo images per cycle, enabling precise embryo selection workflows that complement genetic testing.
Increasing Maternal Age and Genetic Risk Awareness
Rising maternal age is significantly increasing demand for PGT, as the risk of chromosomal abnormalities escalates with age. Couples and clinicians are becoming more proactive in mitigating genetic risks associated with advanced maternal age, recurrent pregnancy loss, and repeated IVF failure. Improved genetic counseling and wider access to carrier screening programs are strengthening awareness of heritable conditions, encouraging pre-emptive embryo testing. This shift toward preventive reproductive care positions PGT as a critical clinical tool rather than an optional add-on. As patient education improves, demand continues to rise for comprehensive genetic screening prior to embryo implantation.
- For instance,"Fulgent Genetics offers expanded carrier screening (ECS) panels covering more than 700 inherited conditions, which aids in early risk identification and helps inform reproductive decisions.
Technological Advancements in Genetic Testing Platforms
Rapid advances in molecular diagnostics, particularly next generation sequencing (NGS), are driving strong growth in the PGT market. Improved sequencing accuracy, higher throughput, faster turnaround times, and declining per-sample costs have expanded clinical adoption. Enhanced bioinformatics pipelines enable more reliable detection of aneuploidies, segmental imbalances, and single-gene mutations within a single workflow. These innovations are improving diagnostic confidence while supporting scalable testing models for high-volume fertility centers. Continuous innovation by test developers and service providers is accelerating clinical acceptance and expanding the addressable patient base for PGT.
Key Trends & Opportunities
Shift Toward Comprehensive PGT Workflows
A key trend in the PGT market is the shift from single-indication testing toward comprehensive, multi-condition screening approaches. Clinics increasingly prefer platforms capable of simultaneously assessing aneuploidy, monogenic disorders, and structural chromosomal abnormalities. This integrated testing model improves clinical efficiency, reduces the need for multiple assays, and supports personalized embryo selection strategies. The trend creates strong opportunities for technology providers offering scalable, all-in-one PGT solutions with advanced data interpretation tools. As fertility clinics seek to differentiate through success rates, comprehensive PGT workflows are becoming a competitive necessity.
- For instance, Thermo Fisher Scientific’s bioinformatics pipelines for reproductive genetics can process hundreds of embryo samples per sequencing run, enabling scalable, all-in-one PGT solutions that improve clinical efficiency and consistency across high-volume fertility centers.
Expansion in Emerging Fertility Markets
Emerging markets across Asia-Pacific, Latin America, and parts of the Middle East present significant growth opportunities for PGT. Expanding middle-class populations, improving healthcare infrastructure, and rising investments in private fertility clinics are increasing access to advanced reproductive services. Governments and insurers in select regions are also gradually recognizing infertility as a medical condition, improving affordability. These markets offer strong potential for service-based PGT models, where centralized laboratories support multiple clinics. Strategic partnerships and regional laboratory expansion are expected to accelerate market penetration.
- For instance, Medicover Genetics has expanded its reproductive genetics laboratory network across Europe, the Middle East, and Asia, operating facilities capable of processing thousands of reproductive genetic tests per month to support cross-border clinic demand.
Key Challenges
High Cost and Limited Reimbursement Coverage
The high cost of PGT remains a significant barrier to broader adoption, particularly in price-sensitive regions. Testing expenses add substantially to overall IVF cycle costs, limiting access for many patients. In most countries, PGT is not fully reimbursed by public or private insurers, positioning it as an out-of-pocket expense. This financial burden restricts utilization despite demonstrated clinical benefits. Cost sensitivity also pressures clinics to carefully justify testing recommendations, slowing adoption in routine IVF cycles. Addressing affordability remains critical for sustained market expansion.
Ethical, Regulatory, and Standardization Constraints
Ethical concerns surrounding embryo selection and genetic screening present ongoing challenges for the PGT market. Regulations governing embryo testing vary widely across countries, creating compliance complexity for laboratories and clinics operating internationally. Inconsistent testing standards and reporting criteria can also affect result interpretation and clinical decision-making. Public debates around genetic selection further influence policy development and patient perception. These regulatory and ethical constraints can delay technology adoption, limit test scope, and increase operational costs, requiring continuous stakeholder engagement and regulatory alignment.
Regional Analysis
North America
North America dominates the preimplantation genetic testing market, accounting for approximately 38-40% of global market share. The region benefits from high IVF procedure volumes, advanced genetic testing infrastructure, and early adoption of next generation sequencing based PGT. The United States leads regional demand, supported by a strong network of specialized fertility clinics, well-established reference laboratories, and high patient awareness of genetic risk screening. Favorable clinical guidelines, strong private insurance penetration for infertility services, and continuous technological innovation further reinforce market leadership. Canada contributes steadily, supported by expanding private fertility centers and growing acceptance of PGT in routine IVF cycles.
Europe
Europe represents around 30-32% of the global preimplantation genetic testing market, supported by widespread IVF adoption and strong clinical emphasis on genetic disease prevention. Countries such as the UK, Germany, France, Spain, and Italy drive regional demand through advanced reproductive medicine infrastructure and growing maternal age trends. Public and private healthcare systems increasingly integrate PGT for high-risk pregnancies, particularly for aneuploidy and monogenic disorder screening. However, market growth varies by country due to differing regulatory frameworks governing embryo testing. Despite regulatory complexity, strong clinical research activity and expanding private fertility services sustain Europe’s significant market share.
Asia-Pacific
Asia-Pacific accounts for approximately 20-22% of the global market and represents the fastest-growing regional segment. Rising infertility rates, delayed parenthood, and expanding access to assisted reproductive technologies are driving PGT adoption across China, Japan, India, South Korea, and Australia. Rapid growth in private fertility clinics, increasing medical tourism, and improving affordability of genetic testing technologies support market expansion. While awareness levels vary across countries, urban centers are rapidly adopting advanced PGT workflows. Government initiatives to address declining birth rates in select countries further strengthen long-term growth prospects for preimplantation genetic testing in the region.
Latin America
Latin America holds an estimated 5-6% market share, driven by gradual expansion of private fertility clinics and increasing awareness of genetic screening benefits. Brazil, Mexico, and Argentina are the primary contributors, supported by growing middle-class populations and rising demand for advanced reproductive care. While cost sensitivity and limited reimbursement constrain adoption, high-risk IVF patients increasingly opt for PGT to improve outcomes. Cross-border fertility travel within the region also supports demand for specialized testing services. Continued investment in laboratory infrastructure and clinician training is expected to steadily improve penetration across major Latin American markets.
Middle East & Africa
The Middle East & Africa region accounts for approximately 3-4% of the global market, reflecting early-stage but steadily growing adoption. Gulf countries such as the UAE and Saudi Arabia lead regional demand due to high healthcare spending, strong private fertility centers, and cultural emphasis on family planning. In Africa, market growth remains limited but is improving in urban hubs with expanding private healthcare access. Genetic disease prevalence in certain populations is encouraging selective PGT adoption. However, regulatory variability and affordability challenges continue to restrict widespread use, keeping overall market share comparatively modest.
Market Segmentations:
By Product & Service
- Products
- Services
By Technology
- Next Generation Sequencing (NGS)
- Polymerase Chain Reaction (PCR)
- Fluorescent In-Situ Hybridization (FISH)
- Array Technologies
- Other Technologies
By Application
- Aneuploidy Screening
- Structural Chromosomal Rearrangement
- Monogenic / Single-Gene Disorder Screening
- Human Leukocyte Antigen (HLA) Typing
By Geography
- North America
- U.S.
- Canada
- Mexico
- Europe
- Germany
- France
- U.K.
- Italy
- Spain
- Rest of Europe
- Asia Pacific
- China
- Japan
- India
- South Korea
- South-east Asia
- Rest of Asia Pacific
- Latin America
- Brazil
- Argentina
- Rest of Latin America
- Middle East & Africa
- GCC Countries
- South Africa
- Rest of the Middle East and Africa
Competitive Landscape
The competitive landscape of the preimplantation genetic testing (PGT) market is characterized by a mix of specialized genetic testing laboratories, molecular diagnostics companies, and fertility-focused service providers competing on accuracy, turnaround time, and technological depth. Leading players emphasize next generation sequencing–based platforms, robust bioinformatics pipelines, and validated clinical workflows to support comprehensive embryo screening. Strategic partnerships with fertility clinics and IVF networks are central to market positioning, enabling consistent sample volumes and long-term service contracts. Companies also invest in laboratory expansion, automation, and quality certifications to ensure scalability and regulatory compliance. Continuous assay refinement, expanded test menus covering aneuploidy and monogenic disorders, and enhanced data interpretation tools are key competitive differentiators. As demand grows, competition increasingly centers on service reliability, clinical integration, and the ability to deliver high-throughput, cost-efficient PGT solutions across diverse regulatory environments.
Key Player Analysis
- Illumina
- Thermo Fisher Scientific
- Agilent Technologies
- Natera
- Fulgent Genetics
- Takara Bio
- Revvity
- Medicover Genetics
- Genea BIOMEDX
- RGI
Recent Developments
- In October 2025, Illumina launched its 5-base sequencing solution, enabling simultaneous high-resolution detection of genomic variants and DNA methylation from a single workflow using proprietary chemistry and DRAGEN algorithms, greatly expanding multiomic insight capabilities for genetic analysis. This platform supports comprehensive genomic and epigenomic profiling that can be leveraged in research workflows including reproductive genetics.
- In July 2025,Takara Bio strengthened its support for preimplantation genetic testing workflows with the expansion of its SMARTer® PicoPLEX® whole-genome amplification technology, validated for single-cell and sub-100 pg DNA inputs. This development improved genome uniformity and coverage consistency, supporting reliable downstream NGS analysis from embryo biopsy samples used in PGT applications.
- In March 2025, Fulgent Genetics expanded its reproductive genetics portfolio by enhancing its NGS-based carrier screening and embryo-related testing workflows, integrating updated bioinformatics pipelines capable of analyzing over 500 clinically relevant genes from low-input DNA samples. The upgrade improved variant calling accuracy and turnaround time for laboratories supporting IVF and embryo screening programs.
Report Coverage
The research report offers an in-depth analysis based on Product&Service, Technology, Application and Geography. It details leading market players, providing an overview of their business, product offerings, investments, revenue streams, and key applications. Additionally, the report includes insights into the competitive environment, SWOT analysis, current market trends, as well as the primary drivers and constraints. Furthermore, it discusses various factors that have driven market expansion in recent years. The report also explores market dynamics, regulatory scenarios, and technological advancements that are shaping the industry. It assesses the impact of external factors and global economic changes on market growth. Lastly, it provides strategic recommendations for new entrants and established companies to navigate the complexities of the market.
Future Outlook
- Preimplantation genetic testing will become a standard component of IVF protocols as clinics focus on improving implantation success and reducing miscarriage risk.
- Adoption of next generation sequencing will continue to expand, supported by higher accuracy, faster analysis, and broader clinical utility.
- Demand for comprehensive testing covering aneuploidy, monogenic disorders, and structural abnormalities will increase across fertility centers.
- Service-based testing models will strengthen as clinics rely on specialized laboratories for advanced genetic analysis and interpretation.
- Automation and bioinformatics integration will improve testing consistency, turnaround time, and scalability.
- Emerging markets will contribute a larger share as access to assisted reproductive technologies expands.
- Genetic counseling will play a more prominent role in guiding patient decision-making and test selection.
- Regulatory frameworks will gradually evolve to support standardized testing and reporting practices.
- Cost optimization efforts will improve affordability and support broader patient access.
- Strategic partnerships between technology providers and fertility networks will shape long-term market development.
Request a Free Sample
Fill in your details and we'll send you a free sample report.
- Sample data tables & charts
- Research methodology
Need a Custom Version of This Report?
Tailor the scope, geography, or segments to your exact requirements.
- Custom geography or segment scope
- Direct access to our analyst team
Frequently Asked Questions
What is the current market size for Preimplantation Genetic Testing, and what is its projected size in 2032?
At what Compound Annual Growth Rate is the Preimplantation Genetic Testing market projected to grow between 2024 and 2032?
Which Preimplantation Genetic Testing segment held the largest share in 2024?
What are the primary factors fueling the growth of the Preimplantation Genetic Testing market?
Who are the leading companies in the Preimplantation Genetic Testing market?
Table of Content
Chapter 1. Report Introduction
- 1.1 Report Description & Purpose
- 1.1.1 Report Title & Market Definition
- 1.1.2 Unique Selling Propositions (USP) & Key Differentiators
- 1.1.3 Value Proposition for Stakeholders
- 1.2 Research Objectives
- 1.2.1 Market Sizing Objectives (Volume & Revenue)
- 1.2.2 Segmentation Objectives
- 1.2.3 Competitive Intelligence Objectives
- 1.2.4 Forecast & Scenario Objectives
- 1.3 Report Scope
- 1.3.1 Preimplantation Genetic Testing Scope – Types & Subtypes Covered
- 1.3.2 Geographic Scope – Regions & Countries Covered
- 1.3.3 Historical Period, Base Year & Forecast Period (2024; forecast to 2032)
- 1.3.4 Inclusions & Exclusions
- 1.4 HS Code & Classification Framework
- 1.5 Currency, Units & Pricing Basis
- 1.6 Target Stakeholders
- 1.7 Limitations & Assumptions
Chapter 2. Executive Summary
- 2.1 Global Preimplantation Genetic Testing Market Snapshot
- 2.1.1 Market Size – Historical (2024) & Forecast (2024-2032) (2024: USD 846.9 million → 2032: USD 1,444.29 million)
- 2.1.2 Volume & Revenue – Global Totals
- 2.1.3 Key Market Highlights – Top Five Facts
- 2.2 Preimplantation Genetic Testing Market Segmentation Snapshot
- 2.2.1 Market Split by Region – 2024 vs. 2032
- 2.3 Competitive Snapshot
- 2.3.1 Top 10 Players by Revenue Share – 2024
- 2.3.2 Top 10 Players by Volume Share – 2024
- 2.3.3 Recent Strategic Developments (18-Month Summary)
- 2.4 Key Investment Highlights & Strategic Conclusions
Chapter 3. Preimplantation Genetic Testing Market Dynamics & Industry Analysis
- 3.1 Market Overview & Context
- 3.1.1 Preimplantation Genetic Testing Market Position in the Broader Automotive Value Chain
- 3.1.2 OEM vs. Replacement Market Dynamics
- 3.1.3 Market Maturity & Development Stage by Region
- 3.2 Preimplantation Genetic Testing Market Drivers
- 3.3 Preimplantation Genetic Testing Market Restraints & Challenges
- 3.4 Preimplantation Genetic Testing Market Opportunities
- 3.5 Porter's Five Forces Analysis
- 3.5.1 Threat of New Entrants
- 3.5.2 Bargaining Power of Suppliers
- 3.5.3 Bargaining Power of Buyers
- 3.5.4 Threat of Substitutes
- 3.5.5 Competitive Rivalry – Intensity Assessment
- 3.6 Preimplantation Genetic Testing Value Chain Analysis
- 3.6.1 Upstream – Raw Material/Input Suppliers
- 3.6.1.1 Raw Material/Input 1
- 3.6.1.2 Raw Material/Input 2
- 3.6.1.3 Raw Material/Input 3
- 3.6.2 Midstream – Production/Manufacturing/Service Delivery
- 3.6.2.1 Production/Process Overview
- 3.6.2.2 Key Facility Locations & Capacity by Manufacturer
- 3.6.3 Downstream – Distribution & End Consumer
- 3.6.3.1 Primary Channel – B2B/OEM
- 3.6.3.2 Secondary Channels – Dealer, Retail, Online, Direct
- 3.6.4 Value Chain Profitability Analysis
- 3.6.1 Upstream – Raw Material/Input Suppliers
- 3.7 PESTEL Analysis
- 3.7.1 Political Factors
- 3.7.2 Economic Factors
- 3.7.3 Social Factors
- 3.7.4 Technological Factors
- 3.7.5 Environmental Factors
- 3.7.6 Legal Factors
- 3.8 Preimplantation Genetic Testing Supply Chain Analysis
- 3.8.1 Raw Material/Input Supply Risk Assessment
- 3.8.2 Manufacturing Concentration Risk (Geographic Exposure)
- 3.8.3 Trade Disruption Impact Analysis
- 3.9 Regulatory & Policy Landscape
Note: The regulatory and policy landscape section covers regulations based on their applicability to the market, Preimplantation Genetic Testing category, geography, and scope of the study. Only regulatory frameworks with a material impact on operations, compliance, trade, sustainability, or market access are analyzed in detail.
Chapter 4. Key Investment Pockets & Opportunity Analysis
- 4.1 Preimplantation Genetic Testing Market Attractiveness Analysis
- 4.1.1 By Region – Investment Attractiveness Matrix (Volume × CAGR)
- 4.2 Absolute Revenue Growth Opportunity
- 4.2.1 By Region – Absolute USD Growth Through 2032
- 4.3 Incremental Volume Opportunity
- 4.3.1 By Region – Incremental Volume Through 2032
- 4.3.2 Segment – Incremental Volume
- 4.4 Emerging Submarket Opportunity Deep Dive (Subject to Applicability)
- 4.5 Emerging Market Opportunity Scorecards
- 4.5.1 United States
- 4.5.2 Europe
- 4.5.3 Asia
- 4.5.4 Middle East & Africa
Note: Emerging Market Opportunity Scorecards will be included based on relevance and strategic importance. Regions listed are indicative and may vary depending on data availability and market dynamics.
Chapter 5. Preimplantation Genetic Testing Import-Export Analysis & Trade Flows
- 5.1 Global Trade Overview
- 5.1.1 Global Export Value by Country (2024)
- 5.1.2 Global Export Volume by Country (2024)
- 5.1.3 Global Import Value by Country (2024)
- 5.1.4 Global Import Volume by Country (2024)
- 5.1.5 Net Trade Balance by Country (2024)
- 5.2 Export Analysis – Segment
- 5.2.1 Type 1 (HS Code)
- 5.2.2 Type 2 (HS Code)
- 5.2.3 Type 3 (HS Code)
- 5.2.4 Type 4 (HS Code)
- 5.2.5 Type 5 (HS Code)
- 5.3 Import Analysis – Segment
- 5.3.1 Type 1 (HS Code)
- 5.3.2 Type 2 (HS Code)
- 5.3.3 Type 3 (HS Code)
- 5.3.4 Type 4 (HS Code)
- 5.3.5 Type 5 (HS Code)
- 5.4 Average Unit Trade Prices
- 5.4.1 Average Export Price – Segment & Country
- 5.4.2 Average Import Price – Segment & Source Country
- 5.4.3 Price Trends (2024)
- 5.5 Key Trade Route Analysis
- 5.5.1 Trade Route 1
- 5.5.2 Trade Route 2
- 5.5.3 Trade Route 3
- 5.5.4 Trade Route 4
- 5.5.5 Trade Route 5
- 5.6 Trade Policy Impact Assessment
- 5.6.1 US Anti-Dumping & Section 301 Tariffs
- 5.6.2 EU Customs Union Impact
- 5.6.3 Major Free Trade Agreements
- 5.6.4 USMCA Rules of Origin
Note: Trade policy analysis will be included only where relevant to the Preimplantation Genetic Testing market.
Chapter 6. Competitive Landscape & Company Benchmarking
- 6.1 Preimplantation Genetic Testing Market Concentration & Structure
- 6.1.1 Herfindahl-Hirschman Index (HHI) – vs. 2024
- 6.1.2 Tier 1, Tier 2 & Tier 3 Market Structure
- 6.1.3 Global, Regional & Local Player Dynamics
- 6.2 Preimplantation Genetic Testing Market Share Analysis – 2024
- 6.2.1 Global Revenue Share by Company
- 6.2.2 Global Volume Share by Company
- 6.2.3 Regional Revenue Share
- 6.2.4 Market Share Evolution ( vs. 2024)
- 6.2.5 OEM Segment Share by Company
- 6.2.6 Replacement Segment Share by Company
- 6.3 Production/Delivery Capacity & Facility Analysis
- 6.3.1 Global Installed Capacity
- 6.3.2 Capacity Utilization Rates
- 6.3.3 Production/Output Volume
- 6.3.4 Facility Locations & Capacity Map
- 6.3.5 Planned Capacity Additions
- 6.4 Preimplantation Genetic Testing Competitive Benchmarking Matrix
- 6.4.1 Revenue, Volume, CAGR & Profitability Comparison
- 6.4.2 Channel Revenue Mix
- 6.4.3 Geographic Revenue Exposure
- 6.4.4 R&D Intensity
- 6.4.5 Sustainability Maturity
- 6.5 Strategic Developments in Preimplantation Genetic Testing (Last 24 Months)
- 6.5.1 Mergers, Acquisitions & Divestments
- 6.5.2 New Preimplantation Genetic Testing Launches
- 6.5.3 Facility Expansions
- 6.5.4 Strategic Alliances, Joint Ventures & Partnerships
- 6.5.5 Distribution Expansion & Market Entry
- 6.5.6 Sustainability & ESG Initiatives
- 6.6 Competitive Strategy Mapping
- 6.6.1 Leader, Challenger, Follower & Niche Classification
- 6.6.2 Pricing Strategy Comparison
- 6.6.3 Channel Strategy Matrix
Note: Strategic developments are included based on their materiality and the availability of reliable information.
Chapter 7. Global Preimplantation Genetic Testing Market – By Distribution Channel
- 7.1 Segment Overview
- 7.1.1 Volume & Revenue Split by Channel (2024 & 2032)
- 7.1.2 Channel Mix Evolution (2024-2032)
Chapter 8. Regional Market Analysis – Global Overview
- 8.1 Global Regional Overview
- 8.1.1 Regional Volume Share
- 8.1.2 Regional Revenue Share
- 8.1.3 Regional Volume by Region
- 8.1.4 Regional Revenue by Region
- 8.1.5 Regional Forecast Through 2032
- 8.2 Cross-Regional Segment Analysis
- 8.2.1 By Distribution Channel
- 8.2.2 By Brand/Price Tier
Chapter 9. North America Preimplantation Genetic Testing Market
- 9.1 United States
- 9.2 Canada
- 9.3 Mexico
Chapter 10. Europe Preimplantation Genetic Testing Market
- 10.1 Germany
- 10.2 France
- 10.3 Italy
- 10.4 United Kingdom
- 10.5 Spain
- 10.6 Poland
- 10.7 Russia
- 10.8 Netherlands
- 10.9 Belgium
- 10.10 Sweden
- 10.11 Denmark
- 10.12 Norway
- 10.13 Rest of Europe
Chapter 11. Asia Pacific Preimplantation Genetic Testing Market
- 11.1 China
- 11.2 India
- 11.3 Japan
- 11.4 South Korea
- 11.5 Thailand
- 11.6 Indonesia
- 11.7 Vietnam
- 11.8 Malaysia
- 11.9 Australia
- 11.10 Rest of Asia Pacific
Chapter 12. Latin America Preimplantation Genetic Testing Market
- 12.1 Brazil
- 12.2 Argentina
- 12.3 Colombia
- 12.4 Chile
- 12.5 Rest of Latin America
Chapter 13. Middle East Preimplantation Genetic Testing Market
- 13.1 Saudi Arabia
- 13.2 United Arab Emirates
- 13.3 Turkey
- 13.4 Israel
- 13.5 Iran
- 13.6 Rest of the Middle East
Chapter 14. Africa Preimplantation Genetic Testing Market
- 14.1 South Africa
- 14.2 Egypt
- 14.3 Nigeria
- 14.4 Morocco
- 14.5 Rest of Africa
Chapter 15. Preimplantation Genetic Testing Company Profiles
- 15.1 [Company 01]
- 15.1.1 Company Overview
- 15.1.2 Key Management Personnel
- 15.1.3 Products & Services Portfolio
- 15.1.4 Financial Performance
- 15.1.5 Key Market Focus & Geographic Presence
- 15.1.6 Recent Developments & Strategic Initiatives
Note: The company profile list is preliminary and may change based on research findings, market developments, data availability, and client requirements.
Chapter 16. Appendices
- Appendix A – List of Abbreviations & Acronyms
- Appendix B – Industry Classification Code Reference – Full Series
- Appendix C – Production & Capacity Data Tables
- Appendix D – End-Use & Demand Base Tables
- Appendix E – Consumption & Replacement Rate Assumptions
- Appendix F – ASP Reference Tables
- Appendix G – Manufacturing & Facility Database
- Appendix H – Import-Export Data Tables
- Appendix I – Regulatory Summary Tables
- Appendix J – Primary Research Participant List (Anonymized)
- Appendix K – Primary Research Questionnaire Framework
- Appendix L – Data Sources & Bibliography
- Appendix M – Market Size Divergence & Source Comparison
Chapter 17. Research Methodology
- 17.1 Research Framework & Philosophy
- 17.2 Secondary Research – Sources, Hierarchy & Data Extraction
- 17.3 Data Modeling – Bottom-Up & Top-Down Market Sizing
- 17.4 Primary Research – Stakeholder Framework, LOI & Sample Sizes
- 17.5 Forecast Methodology – Regression, Scenario & Sensitivity Analysis
- 17.6 Quality Control – Four-Layer Validation Framework
- 17.7 Limitations & Standard Assumptions
- 17.8 Disclaimer
